Thesis by
Charles Frederick Koertin&
In Partial Fulfillment of the Requirements for the Degree of
Doctor of Philosophy
California Institute of Technology Pasadena, California
1985
© 1985
The work contained in this thesis required the cooperation and assis-tance of many individuals. At this time I would like to ackowledge their help. I owe a great deal to my reseach advisor Professor Aron Kupper-mann. His constant attention to detail provided much insight into the interpretation of the experimental results in addition to helping solve some of the vexing experimental problems I have encountered. He has provided the necessary scientific atmosphere which has encouraged thoroughness and creativity.
I wish to thank Dr. David Edmonson who had the patience to intro-duce me to the nuts and bolts aspect of experimental chemical physics. Dave was always a ready source of information concerning the trouble-shooting and operation of the electron optics he designed for EISIII. I also owe a secial debt of gratitude to my co-workers Dorothy Flanagan and Kerry Walzl. Dorothy wrote the computer routines used to analyze the data from the photoelectron experiment and was of great assistance in taming the sometimes tempermental computer associated with that experiment. Kerry helped collect the data on all of the electron-impact experiments presented in this thesis. He has been ever so helpful in for-mulating and expressing the concepts used to explain the data. Kerry has truly been invaluable to me over the past four years.
I also owe a special thanks to Jerry "Beamer" Winniczek. Jerry has always been an endless source of knowledge concerning computer pro-gramming and also wrote the computer programs which allowed us to
both past and present, Dave Moll, Jack Kaye, Jim Garvey, Diane Hood, Paul Hipes, Garth Parker, Joseph Wong, and Steve Cuccaro for their friendship over the years. I also acknowledge the friendship of some of the other students in the chemical physics program at Caltech, Francis Celli, Maureen Hanratty, and Bruce Schilling.
Professors Jack Beauchamp, William Goddard III, Harry Gray and Randy Sparks were all ready sources of ideas and advice concerning the experiments. I thank them for their help.
The work presented in this thesis would not have been possible were it not for the aid and assistance of the personnel of the chemistry depart-ment shops. I personally thank Bill Schuelke, Tony Stark, Guy Durem-berg, Ray Garcia, and Delmer Dill for their cooperation in the construc-tion, design, and maintenence of the instruments used in these studies. Jim Olsen and Jim Gangwer of the mechanics shop also deserve a hearty thanks for their efforts in keeping the pumping systems on the spectrom-eter in top condition. I also owe a great deal to Tom Dunn and Jack Guledjian of the electronics shop for the miracles they worked in keeping our electronics in operation.
I wish to thank our group secretaries, Heidi Tanciar and Adria McMil-lan for their ever-available assistance. I especially thank Heidi who did a great deal of the typing of this manuscript.
The complementary techniques of low-energy, variable-angle electron-impact spectroscopy and ultraviolet variable-angle photoelec-tron spectroscopy have been used to study the elecphotoelec-tronic spectroscopy and structure of several series of molecules. Electron-impact studies were performed at incident beam energies between 25 eV and 100 eV and at scattering angles ranging from oa to goa. The energy-loss regions from 0 eV to greater than 15 eV were studied. Photoelectron spectroscopic studies were conducted using a He! radiation source and spectra were measured at scattering angles from 45a to goo. The molecules studied were chosen because of their spectroscopic, chemical, and structural interest. The operation of a new electron-impact spectrometer with multiple-mode target source capability is described. This spectrometer has been used to investigate the spin-forbidden transitions in a number of molecular systems.
fluoro-hexacarbonyls have been studied in the 0 eV to 15 eV region. The differential cross sections were obtained for several features in the 3-7 eV energy-loss region. The symmetry-forbidden nature of the 1A
18-+ 1A18, 2t21(TT) -+ 3t21(TT•) transition in these compounds was confirmed by the high-energy, low-angle behavior of their relative intensities. Several low-lying transitions have been assigned to ligand field transitions on the basis of the energy and angular behavior of the differential cross sections for these transitions. No transitions which could clearly be assigned to singlet -+ triplet excitations involving metal orbitals were located. A number of states lying above the first ionization potential have been observed for the first time. A nwnber of features in the 6-14 eV energy -loss region of the spectra of these compounds correspond quite well to those observed in free CO.
region which are most likely due to Rydberg transitions converging to the higher ionization potentials of this molecule. This is the first reported electron-impact spectrum of a polyatomic free radical.
Acknowledgments... iv
Abstract . . . ... . . .. . .. .. .. .. . .. .. . . .. . .. .. .. . . . .. .. . .. . . .. .. . . ... . . .. . . .. .. .. . . .. . .. . . .. . .. . .. . . vi
Table of Contents... lx CHAPTER 1: INTRODUCTION .... .. . .. . .... .. .. . . ... ... .... ... .. .. . .. .. .. . .. ... ... . . .. . ... . 1
References . .. ... . . ... .. . ... .. ... . . . .... .... ... . . .. ... . .. ... ... . . .. .. . .. .. ... . . .. .. ... ... . . .. . 4
CHAPTER 2: INTRODUCTION TO ELECTRON-IMPACT SPECTROSCOPY... 5
References... 12
Tables... 15
CHAPTER 3: TIIEORY OF ELECTRON IMPACT ... 16
References ... 23
CHAPTER 4: EXPERIMENTAL ELECTRON-IMPACT SPECTROSCOPY... 25
References . . . .. . . ... .. .. .. . .. . .. .. . . .. . . . .. . . .. .... . .... . . . .. . . .. .. . . .. .... . . ... ... .. .. . ... . . . . .. S6 Tables ... 57
Figures ...
sa
CHAPTER 5: ELECTRON-IMPACT SPECTROSCOPY OF TilE CHLOROETI1YLENES... ... .. . . .. . .. . . .. . . . .. . .. .. . . .. . . .. .. . . . .. . . .. . . 46References . ... ... . .. ... . .. . ... .. . ... . . .... . .. .. . . .. . .. .. .... . ... .. ... ... . . .. .. .. .. . ... . . .. .. .. .. .. . . . 74
Tables ... 61
Figures ... 117
CHAPTER 6: TilE SPECTROSCOPY OF TilE GROUP Vlb TRANSITION METAL HEXACARBONYLS AS STUDIED BY ELECTRON-IMPACT... 153
References . . .. ... .. .. . ... .. . .. .. ... .. . . .. ... .. . . .. . . .. .. . .. . .. .. . .. . .. .... . . .. .. . . .. . .. .. . . .. 169
Tables ... 175
CJiAPTER 7: !:XPLORATORY STUDIES ... 207
References ... 212
Tables ... 214
Fi&ures ... 219
CJiAPTER B: INTRODUCTION TO VARIABLE-ANGLE PHOTOELECTRON SPECTROSCOPY ... 229
References . . .. .. .. . . .. . .. . .. . . .. .. ... .... . .. .. . .. .. . . . .. .. . .. .. .. .. . ... . .... .. . .. .. ... . .. ... .. . .. . . 233
CHAPTER 9: TiiEORY OF PHOTOELECTRON ANGUlAR DISTRIBUTIONS . .... .. .. .. 235
References... 247
Fi£ures . .. . . .. . .. .. . .. .. . . .. .. .. . .. .. .. . .. . .... . ... .. .. . .. .. .... .. .. .. ... . .. .. .. .. .. . .. .... . . .... . .. .. . . .. . 249
CHAPTER 10: EXPERIMENTAL VARIABLE-ANGLE PHOTOELECTRON SPECTROSCOPY ... 252
References . .. .. .. .. . . .. . .. . .. .... . .. .. . .. .. .. .. ... . . . .. .... . .. .. . .... . .. . .. .. . .. . .. . .. . . .. . . .... .. . .. . 263
Fi&ure s .. . .. . .. . . .. . .. . . .. . .. .. . . .. .. .. . .. .. . .. .. . . .. .. .. . .. .. . . .. .. . .. .. . .. . . .. . .. . . .. . .. . .. .. . .. .. . . . 264
CHAPTER 11: TiiE ANGLE RESOLVED PHOTOELECTRON SPECTROSCOPY OF CYCLOPROPANE, ETHYLENE OXIDE, AND ETHYLENEIMINE .... .. .... 273
References . .. . .... . . ... .. .. . .... . .. .. .... ... .. ... .. .. .. ... . . . .. .. .. . . . .. .. .. . .. .. . . .. . .. . . . .. . .. . . 285
Tables ... 289
invaluable tool in the study of the electronic structures of atoms and
molecules. The past 20 years have seen a renaissance occur within this . field, primarily due to technological advances in vacuum techniques and methods of electron beam production, energy analysis and detection.
Electron spectroscopy is a term which covers a broad range of types of
measurements. Many of these techniques are reviewed in the excellent
series of monographs on electron spectroscopy edited by C. R. Brundle
and A. D. Baker.1 The common feature in all of these techniques is that they all involve measurements of processes that are either induced by
electrons incident upon a target or that involve electrons which are
emit-ted by the target. The target may consist of atomic or molecular gases,
solids, or atomic or molecular species adsorbed on surfaces.
The majority of electron spectroscopic techniques may be classified
into two major types. In those of the first type, electrons are produced
by the interaction of ionizing electromagnetic radiation (usually
ultra-violet light --+ x-ray) with the target. This type of electron spectroscopy is
usually referred to as photoelectron spectroscopy (PES). In those of the
second type of electron spectroscopy, the electrons themselves are used
as the excitation source. This type is referred to as electron-impact
spectroscopy (EIS). In this work, experiments involving variable-angle,
low-energy electron-impact spectroscopy and variable-angle ultraviolet
photoelectron spectroscopy will be described.
There are fundamental similarities and differences between both
to accomplish this task. The major difference between them concems the nature of the excitation sources involved. When a vacuum ultraviolet or x-ray photon interacts with a target, as occurs in PES, it is generally annihilated and does not scatter with a different energy than it came in with (the exceptions being Raman and Compton scattering which are not important processes in the experiments under consideration here). On the other hand, when an electron interacts with a target, it is not annihi-lated but usually scattered either with no change in its kinetic energy (elastic scattering) or with a kinetic energy which is different by a 6E than its intial energy, where 6E corresponds to the energy imparted to or removed from the target. Other differences exist in the nature of the information obtained from these experiments. Photoelectron spectros-copy probes the energetics of bound state to ionic state transitions while in the electron impact spectroscopy considered in this thesis, we probe the bound state to bound state excitations.
In spite of the differences between these two kinds of experiments, the information obtained from them is mutually complementary in that both involve the same intial state. One example of this interconnection involves the use of EIS to measure the positions and determine the nature of the Rydberg type excitations of a molecule. These in turn are used to confirm the location and nature of the ionic states observed in PES. Conversely, one can use the locations and band shapes observed in the PES spectrum to approximately predict the position of the Rydberg states of a molecule thereby facilitating the assignment of the states observed by EIS.
being the angle between the incident photon beam and the ejected
elec-tron beam. In the low-energy variable-angle elecelec-tron-impact
spectros-copy experiment, 8 is defined as the angle between the incident and the
scattered electrons. The use of this variable in the experiments allows
one not only to obtain additional information concerning the electronic
structure of the target but also provides useful information about the
dynamics involved in these processes. Thus the use of 8 as an
experi-mental parameter presents us with a "key" to deciphering some of the
information contained in the electron kinetic energy spectrum produced
by both experiments. In EIS. the measurement of the differential cross
section (DCS) for a given excitation as a function of 8 allows us to
eluci-date the nature of the transition and thus shed light on the intial and
final states involved. In PES the variation of the DCS as a function of 8
allows one to determine the assymetry parameter, {J, which in turn can
help identify the intial states involved in addition to identifying whether
or not such dynamical processes as shape resonances or autoionization
are occurring.
The work which follows can be divided into two major sections.
Chapters 2-7 deal with the technique of low-energy, variable-angle
electron-impact spectroscopy and its application to the chloro-
substi-tuted ethylenes and the group Vlb transition metal hexacarbonyls.
Chapters 8-11 involve experiments using variable-angle, ultraviolet
pho-toelectron spectroscopy. This technique is described along with its
1) Electron Spectroscopy, Theory, Techniques, and Applications. Vols
1-4 edited by C. R. Brundle and A. D. Baker (Academic Press, New
The collision of an electron with a gas phase-atom or molecule may result in a number of possible outcomes. Some of these are transfer of translational energy, excitation or de-excitation of internal target states (electronic, vibrational, or rotational), ionization, negative ion formation, molecular fragmentation, or various combinations of these processes. Data from electron scattering experiments are useful not only for the study of the internal states of the target but also for gathering dynamical information about the electron-target interaction. The information gleaned from such experiments has direct application in the study and understanding of upper atmospheric processes, 1 electron beam transport in gases,2 gaseous discharges,3-5 plasma chemistry and physics,e-a elec-tron beam pumped lasers,9•10 and astrophysics.11 In this work, our pri-mary concern is with the inelastic scattering of electrons by gas phase molecular systems. In particular, we v.ill be dealing with the formation of electronic excited states of these systems by the electron-impact pro-cess. A knowledge of the energy and nature of these states is important in understanding photochemistry12 and radiation chemistry and phy-sics. 13 The transition energies and cross section data also serve to pro-vide "benchmarks" with which to compare a.b intio electronic structure
calculations and calculations of the dynamics of electron scattering. Conversely, accurate calculations may be used to help interpret the data obtained from electron-impact experiments.
measuring the energy of the scattered electrons at a given scattering angle, 8, and for a given incident electron energy, E . Care must be
0
taken to keep the gas pressure of the sample low enough so that an elec-tron traversing the interaction region undergoes no more than a single collision otherwise inaccuracies will result in the measured cross-sections and energy losses for the observed transitions. The result of such a measurement is the energy-loss spectrum, and is the electron-impact analog of the optical spectrum. This type of measurement is not new; in fact. the first electron energy-loss spectra where recorded for atomic species by Franck and Hertz 14•15 in the early 1900's.
Electron impact spectroscopy has several advantages and disadvan-tages when compared with optical spectroscopy. The major advantage of optical spectroscopy is its superior resolution in the infared and visible regions of the spectrwn. Rotational resolution is not difficult to achieve in this region and is several orders of magnitude better than the typical 20-30 meV resolution achieved with today's state-of-the-art electron-impact spectrometers. Another major advantage of optical spectroscopy is that the theory of optical absorption is much easier than that of low-energy electron-impact spectroscopy and has been the subject of many detailed studies over the past 80 years. Much theoretical work on the interpretation of optical spectra exists and the selection rules are gen-erally well-defined. 16-18 Theoretical work of this type has generally lagged behind somewhat in the field of electron-impact. Even though efforts are being made to rectify this situation , the difficulty of theory involved is still a serious stumbling block.
spec-extends from the infrared (several meV) clear through the x-ray region of the spectrum (several hundred eV ) with a constant energy resolution over the entire range. This capability does not exist for optical spectros-copy, which would require several instruments to scan the same energy-loss range. The advantages of using electron-impact spectroscopy become readily apparent in the spectral region beyond the LiF cutoff fre-quency (about 12 eV). Very little optical work has been performed in the energy-loss region of 10-20 eV due to the complex instrumentation required for such studies. Using the electron-impact method, it is as easy to study energy-loss regions at 20 eV as it is to study them at 2 eV. The spectral region from 10 to 20 eV is especially interesting in that it contains transitions to super-excited states which lie above the first ioni-zation potentials of the molecules. An understanding of the nature of these states is important to understand the physics and chemistry occur-ring in this little-studied spectral region. In this region the resolution of electron-impact spectroscopy equals or exceeds that available with typi-cal vacuum-ultraviolet rnonochromaters. The electron-impact method also avoids some of the complications such as line saturation effects which must be contended with when using optical spectroscopy to obtain
accurate oscillator strengths for transitions within this region.19
Electron-impact also has the advantage of possessing two variables in addition to the energy-loss for determining the nature of the excited states of the target. These are the incident energy, E , and the
scatter-o
symmetry-forbidden transtions. To see why this occurs, we must first
discuss the two modes of excitation which exist in electron-impact spec
-troscopy. The first mechanism is referred to as the direct or Coulomb
excitation. In this case the target sees a rise in the electric field due to
the passing electron's charge. The target may absorb energy form this
field in a similar manner to which it can be thought to absorb energy
from a light wave. By conservation of energy, the amount of energy the
target absorbs shows up as an energy-loss experienced by the passing
electron. Transitions which are primarily excited by this mechanism see
a slow increase in intensity as the incident electron energy increases
from threshold to 50-100 eV above threshold after which they show a slow
decrease as one goes to higher incident energies.22 Transitions excited
by this mechanism also exhibit a marked intensity peak at 0° scattering
angle, dropping off by one to two orders of magnitude as the scattering
angle is increased from D-90°.20·21 This is due to the relatively long-range
nature of the electrostatic force which drives these excitations, as a
result of which the electron does not have to pass very close to the target
for the latter to "feel" that charge. This results in the majority of the
electrons undergoing little or no change in direction after interacting
with the target. At high energies and low scattering angles, where the
Born approximation holds,23 this mechanism of excitation obeys the
opti-cal selection rules. 24•25
The second mechanism of excitation has no optical analog and
involves the electron exchange process. This process, first discussed by
Oppenheimer 26•27 involves the physical exchange between the incident
it the same amount of energy the incident electron came in with. Second, the electron may exchange with an electron of identical spin and leave the target with an energy-loss corresponding to an excitation energy of the target. Third, the electron may exchange with an electron of opposite spin and leave the target in an excited state. the outgoing electron leaving with an energy-loss corresponding to the spin forbidden excitation energy. It is this last possible outcome that circumvents the conservation of spin selection rule of optical spectroscopy. One must remember, however, that this AS=O selection rule is not violated for the electron plus target system since the spin of the entire system does not change even though the spin multiplicity of the target changes. Excita-tions involving the exchange mechanism exhibit rapid intensity decreases as one moves from incident energies near threshold to higher incident electron energies.28 Transitions excited by this mechanism exhibit a nearly uniform intensity as one increases the scattering angle from 10°
to
90°. This is due to the scrambling of the directional information car-ried by the incident electron during the exchange process. It is this trait of spin-forbidden transitions which permits their essentially unambiguous identification in electron-impact spectroscopy in systems for which spin-orbit coupling is small.inten-previously, these experimental parameters have no optical analog since photoabsorption is a resonant process in which the photon is anhilated. The measured quantity which is the primary carrier of the dynamical information is known as the cross section. The cross section is defined as being the number of events per unit time per target divided by the number of incident electrons per unit time per unit area 29 thus giving the cross section the dimensions of an area per target. There are two kinds of cross sections referred to in describing the collision process. The first is the differential cross section (DCS) which is just the cross sec-tion per unit solid angle for scattering into a given direcsec-tion defined by the spherical polar angles 8 and ~- In our experiments in the gas phase, the target molecules are randomly oriented with respect to the incident electron beam and thus the ~ dependence of the DCS will vanish.21 The other is the integral cross section and is just the differential cross sec-tion integrated over all scattering direcsec-tions. Again, experiments measuring the angular dependence of the DCS for ineleastic electron scattering are not new, the first having been performed by Dymond in
1927.30
symmetry- forbidden transitons present an intermediate case. DCS's for
these transitions do not fall off quite as rapidly as a function of angle as
do the fully allowed transtions nor do they remain as constant over the
angular range as do spin-forbidden transitions.:u Examples of this type
of transition occur in both the chloroethylenes and the transition metal
hexacarbonyls and makes the identification of the symmetry-forbidden
transitions in these compounds a rather straightforward task. It is this
ability to observe and assign optically forbidden transitions that makes
electron impact spectroscopy the powerful tool that it is. Table 1 shows
examples of the enhancements of both types of forbidden transitions as
observed in the spectrum of helium.
In this work we will be applying these principles to the study of a
series of chlorinated ethylenes and the group Vlb transition metal
hexa-carbonyls (chapters 5 and 6, respectively). In chapter 3 a brief
introduc-tion to the theoretical foundations of the concepts presented in this
chapter will be presented. In chapter 4 the instrument used in these
stu-dies will be described. At this point those readers who desire further
material concerning electron impact spectroscopy are referred to some
1) K. Takayanagi andY. Iti..kawa, Space Science Reviews 11, 380 (1970).
2) P. H. de Haan, R. N. Singh, H. J. Hopman, G. C. A. M. Janssen, E. H. A.
Granneman, and P. S. Slrelkov, J. Phys. E 14, 373 (1981).
3) L. G. H. Huxley and R. W. Crompton, Tlls! Dijfu.sion a.nd Drift of Elec-f.Tons in Gases, (John Wiley and Sons, New York 1974).
4) A. Gilardini, Low Energy Electron CoUisions in Gases; Swa:rm a.nd
.Pta.sTTLa. Methods Applied to Their Study, (John Wiley and Sons, New
York 1972).
5) E. W. McDaniel, CoUision Phenomena in Ionized Gases, (John Wiley
and Sons, New York 1964).
6) T. Taniguchi, H. Tagashira, andY. Sakai, J. Phys. D 10, 2301 (1977).
7) P. D. Edgley and A. von Engel, Proc. Roy. Soc. 1370, 375 (1980).
8) A. Kh. Mnatsakanyan, High Temp. 12, 745 (1974).
9) C. S. Willett, Introduction to Gas Lasers: Population Inversion
Mecha:n.isms, (Pergamon Press, New York 1974).
10) C. Brau in Topics in Applied Physics, vol 30, Exci:mer Lasers
(Springer-Verlag, Berlin 1979), p 87.
11) J. H. Black, Astrophys. J. ~. 125 (1978).
12) J. G. Calvert and J. N. Pitts Jr. Photoclls!mistry, (John Wiley and Sons,
New York 1966).
13) V.I. Makarov and L. S. Polak, High Energy Chern. (USSR) 4, 1 (1970).
14) J. Franck and G. Hertz, Verk. der Phys. Ges. 16,457 (1914).
17) G. Herzberg, Spectra of Diatomic Molecules, (Van Nostrand, New
York 1950).
18) G. Herzberg, Electronic Spectra of Polyatomic Molecules, {Van
Nos-trand, New York 1966).
19) R. S. CeloUa and R. H. Huebner in Electron Spectroscopy: Theory,
Techniques , and Applications, vel 3 edited by C. R. Brundle and A. D.
Baker, (Academic Press 1979), pp 41-125.
20) A. Kuppermann, J. K. Rice, and S. Trajmar, J. Phys Chern, 72, 3894
(1968).
21) S Trajmar, J. K. Rice, and A. Kuppermann, Adv. Chern. Phys. 18, 15
( 1970).
22) H. S. W. Massey and E. H. S. Burhop, Electronic and Ionic Impact
Phenomena, 2nd ed., vel 3 (Oxford University Press, London 1969),
pp437, 880, 968.
23) N. F. Mott and H. S. W. Massey, The Theory of Atomic Collisions, 3rd
ed., (Oxford University Press, London 1965), p87.
24) E. N. Lassettre and A. Skerebele in Inelastic Electron Scattering,
Methods Experimental Physics, vel 3 (Academic Press, New York
1974),pp 868-951.
25) E. N. Lassettre, A. Skerebele, and M. A. Dillon Jr., J. Chern Phys. 50,
1829 (1969).
28) D. C. Cartwright and A. Kuppermann, Phys. Rev. lftJ, 86 (1967).
29) A. Messiah, Qu.a:ntu.m Mechanics vel 2 (John Wiley ans Sons, New York
1961) p 833.
30) E. G. Dymond, Phys. Rev. 29, 433 (1927).
31) M. A. Dillon in Oreation and .Detection of th2 Excited State, vel 1
(Dekker, New York 1971),pp 375-427.
32) E. N. Lassettre in Chemical Spectroscopy and Photochemistry in th2
Va.cu.u.m Ultraviolet edited by C. Sandorfy, P. Ausloss, and M. B. Robin
(D. Reidel Publ. Co., Dordrecht, Holland 1974), pp 43-73.
33) D. E. Golden, Adv. Atom. and Melee. Phys., 14, 1, (1978).
34) S. J. Trajmar, Accts. Chern. Res., 13, 14, (1980).
35) A. Kuppermann, W. M. Flicker, and 0. A. Mosher, Chern. Rev 79, 77
(1979).
36) G. Herzberg, Atomic Spectra. a:nd Atomic Structure (Dover
Publica-tions, NewYork 1944)
37) M.S. Yurev, Opt. Spectry., 25, 157 (1968).
38) D. R. Bates, and A. Fundaminsky, J. W. Leech, and H. S. W. Massey,
Trans. Roy. Soc., .A243, 93 (1950).
39) J.D. Jobe and R. M. St. John, Phys. Rev., 164, 117 (1967).
40) J. K. Rice, A. Kuppermann, and S. Trajmar, J. Chern. Phys., 48, 945
in Helium with Typical Optical Transition Probabilities. Popt is the Rela-tive Optical Excitation Probability; P~ec is the Relative Electron-Impact Excitation Probability for an Incident Ener&Y of 35 eV; and Pelec(8) is the Relative Probability for Electrons to Scatter at an Angle 8 After Causing the Excitation for an Incident Ener&Y of 35 eV.
Pelec(e)r Transition Transition Type Popt Pilec 8
=
0° 9=
70°t1
s ...
21P Electric dipole allowed.t•
t•
t• t•t1
s ...
21S Electric dipole forbidden,to-5- to-eb
0.18d 0.40 0.21electric quadrupole allowed
11S ... 2!T Spin forbidden, _10-to c 0.12• 0.023 1.3 electric dipole allowed.
a) The relative probability of this excitation is taken to be unity. b) Ref. 36
c) Ref. 37
d) Ref. 38 e) Ref. 39
TIIE TIIEORY OF ELECTRON IIIPACT
In this chapter, we will not attempt any rigorous derivation of the quantum mechanical formalisms of the electron scattering problem. Rather, we will present the results of such derivations with the major emphasis placed on their physical interpretation and their implications for the experimental results. A more detailed theoretical treatment is given in the appropriate reviews on the subject.1-5
The theoretical descriptions which follow may be divided into two separate approaches to the interpretation of the electron scattering problem. The first approach makes use of potential scattering theory in order to determine the general behavior of the differential cross section (DCS) for both the direct (Coulomb scattering) and exchange scattering processes. The second approach involves the use of the first Born approx-imation to show the relation between optical spectroscopy and electron-impact spectroscopy.
We will now show how the general behavior of the DCS for the various processes can be obtained from basic potential scattering theory. The argument presented here will generally follow that presented by Trajmar et al~ in their review on electron-impact spectroscopy.
The wave function of the incident electron, when far away from the target molecule 7, is a plane wave of the form
l!w
=
exp(ip-r/ll')=
exp(ik·r) ( 1) where the r is the electron's position vector and kits wave-number vec-tor. If we orient the z axis along the incident electron direction, equationwith the plane wave, the scattered electrons can be thought to emanate from the scattering center as a spherical wave which, as r .... .., has the form
lt.,;
=
I
(9) exp('ikr)r (3)
where /(9) is the amplitude for the electron scattering into the direction making an angle, 9, with the direction of the incident electron. The asymptotic behavior of Ule electron's total wave function is given by
;; =
exp(ikz)+I
(9) exp('ikr) rand the expression relating the scattering amplitude to the DCS is
d.u
=
11(9)12d.O
(4)
(5) If one applies partial wave analysis1 to this problem, one can express the
incident wave as sum of products of radial and angular functions
exp(iJ:z)
=
f;C2l+l)i1jL(Icr)P,(cos9) (6) teOwhere j, is now the spherical Bessel function of order L. One can now think of the scattering process as distorting the plane wave by introduc-ing phase shifts, '1t, in the different angular momentum terms of the incident wave. We can then relate the scattering amplitude to these phase shifts, "1t, by realizing that the wave function must asymptotically reduce to the form of equation 4. This leads to,
1(9) =
~
f;(2l+l)exp(i'7'Jt)sin'7'],P1(cos9)&=0
(B)
where each term in the expansion is called a contribution of partial wave
l to the DCS. If "7t is small then it can be shown, using a perturbation approach, that6
-"7t ~ - ; j[J,+Ji(kr)]2U(r)rdr 0
(9)
where U(r) is the electron- molecule interaction potential and Jt+M is a Bessel function.
We now make the assumption that r2U(r) has an effective ranger
max
and that within that range it never exceeds some finite value6: Thus we can state the following,
r21 U(r) I ~ a D<rsrm&%
= 0 rm&%<r
(lOa) (lOb)
kr
With a low enough impact energy such that ~
«
1 we can use the small argument form of Jt+M·9 When applied to equation 9, this givesriiiU
I
17'I
< rr 2 [f(l+}0] aJ (
0 lcr 2 )2l+l ctr _ r - (2l+l)3 2rra ( krmu: 2 )2l+l [r(l+}0] 1 (11)For small 17, equation 8 can be written as
da i
-dO ~ lc2 I ~ (2l + 1) "7t P, (cosa) 12 l=O
(12)
for the direct mechanism than for the exchange mechanism based purely
on the effective range of the interaction potential. Due to the nature of
the Legendre polynomials, the more of them that are included in the
expansion, the more forward peaked the DCS will become. For the
exchange mechanism, less terms are needed and thus the DCS will
display a more isotropic behavior. One can also see from equation 11
that if one lowers k (lower incident electron energy) that again fewer
par-tial waves are needed and that the DCS should become more isotropic. Both of these generaJ trends have been verified experimentally.6
At higher incident electron energies, we may approach the problem
from a different perspective. We will now present the basic arguments
used by Celotta and Huebner10 in relating optical results to electron scattering results in their review of electron-impact spectroscopy. For a
detailed discussion on the theory of high energy electron scattering, the
works of Bethe11 and Inokuti3 are recommended.
At sufficiently high incident energies one may use the first Born
approximation. From it one can write the differential cross section for
the scattering of an electron oft' a ground state target to produce an
excited state with an excitation energy of E as n
du lc:'
dO = 4a§~ltn(K)I2 (13)
where K is the momentum transfer vector K
=
k - k" One can relate themagnitude of K to the incident and scattered electron momenta, k and
k", and the corresponding kinetic energies T and T", where T"
=
T - E , by n(14)
The quantity
I
En (K)I
in equation 13 is defined as the transition matrix ele-ment between the intial state'¥to
and final state '¥'n of the target and can be written as~n(K)
= <YinI
f
exp(iK·rJl'¥'o>
J=l(15)
whe.re N is the total number of electrons in the ta::get and r. is the posi-l
tion vector of the jth electron. En (K) is often referred to as the inelastic-scattering form factor and contains the properties of the target. If this expression is summed over all molecular orientations and all degenerate substates, En becomes a function of the magnitude of K and will be writ-ten as En (K) from now on.
Bethe10 has introduced the concept of the generalized oscillator strength (GOS) as
(16)
We can then use this relation along with equation 13 to obtain the
follow-ing expression for the DCS in the first Born approximation.
d.u
=
4a.6
lcJc' /n(K)d.O T/ R
xe
(En/ R) (17)Equation 17 can now be used to introduce the concept of an apparent GOS, 1 n (k, T), based on the DCS, whether or not the first Born approxima-tion is valid. It is defined as
(19)
we can express !(l; kk' in terms of it as
: ;
=r+4s~
(20)Equation 18 applies to transitions between discrete states but Inokuti3 has discussed the modification of this expression to include transitions to continuum final states. This is done by replacing a by d.a/d.E and
fn(/0
by d.f (K,E)I d.E. d.f (K,E)I d.E is just the energy-loss density of GOS and is usually summed over all possible discrete and continuum states. This results ind./ (K,E)
=
~(En)
[ len(K) 12
]c5(En -E)
d.E n R (Ka0)2 (21)
where c5(En -E) is the delta function of energy transfer and ~ denotes a n
sum over discrete states and an integral over continuous ones. Lasset-tre12 has shown that the GOS can be obtained from the electron impact spectra regardless of whether or not the Born approximation is valid by extrapolating to k=O.
One can now expand the operator in the right-hand side of equation 15 using a power series expansion in the same manner one would expand the optical operator. This yields,
(22)
the absolute value of ~n (K) appears in the expression for the GOS, only
the even powers of K survive. One can see from the power series
expan-sion , that for small K only the dipole term is important. At large enough
K higher order terms become important and thus by altering K (which is
a function of incident electron energy and scattering angle) one can
observe dipole forbidden transitions. This is an important consequence of
equation 22.
Now one can relate the GOS to the optical oscillator strength
J
n by(23)
and therefore the optical oscillator strength can be obtained from
elec-tron scattering measurements
The importance of the electron exchange process in electron
scatter-ing was first pointed out by Oppenheimer13•14 in 1928. He pointed out that as the energy of the incident electron decreases the cross section
for exchange increases. Furthermore, Goddard 15 and Read and White-rod 16 have used symmetry arguments to predict the behavior of the DCS
for certain types of symmetry-forbidden transitions.
Exact calculations involving the electron scattering problem are at
best an extremely difficult if not impossible task involving the solution of
an infinite set of coupled integro-differential equations.17 To circumvent
this problem a number of approximate methods have been used to solve
these equations or to reformat the problem into a more tractable form.
We will not discuss any of these methods at the present time; however,
those who are interested are referred to the appropriate reviews lB-21 and
Phenomena. Vol 1 (Oxford University Press, London 1969).
2) A. Messiah, Quantum Mechanics Vol 2 (John Wiley and Sons , New
York 1961) pp 833.
3) M. Inokuti, Rev. Mod. Phys 43,297 (1971).
4) M. L. Goldberger and K. M. Watson, CoUision Th£ory, (John Wiley and
Sons, New York 1964).
5) N. F. Mott and H. S. W. Massey, Til£ Th£ory of Atomic CoUisions, 3rd ed. (Clarendon Press, Oxford 1952).
6) S. Trajmar, J. K. Rice . and A. Kuppermann Adv. Chern. Phys 18,15
( 1970).
7) D. Saxon, ELementary Qu.a:ntu.m Mechanics Vol 2 (Holden-Day, San
Francisco 1969) pp 352.
8) ref 5 pp. 28
9 H. S. W. Massey in Handbu.ch Der Physik Vol. 36 edited by S. Flugge
(Springer-Verlag, Berlin 1956) pp 240.
10) R. J. Celotta and R. H. Huebner ELectron Spectroscopy, Theory,
Tech-niques and Applications Vol. 3 edited by C. R. Brund.le and A. D.
Baker (Academic Press, New York 1979) pp 45- 121.
11) H. A. Bethe. Ann. Physik 5, 325 (1930).
12) E. N. Lassettre, A. Skerebele, M. A. Dillon J. Chern. Phys. 50, 1829
(1969).
15) W. A. Goddard III, D. L. Hustis, D. C. Cartwright, and S. Trajmar Chern.
Phys. Lett. 11, 329 (1971).
16) F. H. Read and G. L. Whiterod Proc. Phys. Soc. 82, 435 (1963).
17) I. C. Percival and M. J. Seaton, Proc. Cambridge Soc. 53, 654 (1957).
18) P. G. Burke and W. G. Robb Adv. Atom and Molec. Phys. 11, 143 (1975).
19) N. F. Lane Rev. Mod. Phys. 52, 29 (1980).
20) D. W. Norcorss and L. A. Collins Adv. Atom. and Molec. Phys. 18, 36
(1982).
21) Electron and Photon-Molecule CoUision Processes, edited by T.
The results presented in this thesis were obtained using a modified version of the Model III electron-impact spectrometer (EISIII) which has been described in the Ph.D. theses of W. M. Flicker1, R. P. Frueholz2 and R. Rianda. 3 In this chapter we will present a brief description of the experimental apparatus with emphasis being placed on the changes made in the instrument over the past five years. The instrumentation will be discussed in the following sections and a review of the data handling pro-cedures will also be included.
a) Vacuum system
The vacuum system used in these studies has been described previ-ously by Rice4 and Flicker5 and consists of a t¥304 stainless steel enclo-sure of about 70 liters in internal volume (figure 1). The chamber is con-nected to the pumping system via an 8" diameter flexible metal bellows assembly. The pumping system consists of a 10" pneumatically con-trolled gate valve, 9" diameter 304 stainless steel elbow, 9" liquid nitrogen trap, 9" freon baffle, and a 9" 1500 liters /second mercury diffusion pump.
The speed of the pumping system has been measured to be between 300 and 350 liters/second at the inlet to the main chamber. The diffusion pump is backed by a 500 liter /minute mechanical pump with a 2" diame-ter freon baffle at its inlet. The freon baffle prevents mercury from the diffusion pump from contaminating the oil in the backing pump. The base pressure of this system under typical operating conditions varies from 1 x 10⁻⁷ to 3 x 10⁻⁷ torr.
design. this pumping was
to
have been provided by a 30 liter /second ionpump. However, this was found to cause problems due to the
magnetiza-tion of some of the spectrometer parts and was replaced by a 30
liter /second mercury diffusion pump stack consisting of a 2" gate valve,
2" liquid nitrogen trap. and a 2" mercury diffusion pump backed by a 60
liter/minute mechanical pump. The base pressure of this pumping
sys-tem after several days of pumping varies from 5 x 10⁻⁷ to 1 x 10-e torr.
This pumping system can maintain a pressure differential of two orders of
magnitude between the electron optics enclosures and the main
chamber. 1bis is important, especially when the molecular beam source
is used, for maintaining clean electron optics to ensure reliable operation
of the spectrometer. The pressure in the optics chamber is usually
main-tained between 1 x 10-e and 4 x 10-e torr. The enclosures around the
electron optics also reduce the instrumental noise by shielding them
from stray background electrons.
The third source of pumping consists of a liquid nitrogen cooled
cryo-trap.1 Though initially designed as a beam dump, it was found that for
condensable materials, the pressure in the main chamber was lowered by
a factor of 2 to 5 when this pump was used.
The entire vacuum system is under the control of a vacuum interlock
system described by Mosher.5 This system shuts the gate valve and turns
off the diffusion pump in case of an over-pressure. The pressures are
monitored at the foreline and at several places on the spectrometer.
There is also a vacuum switch on the foreline which shuts down the
instrument when the pressure rises above 1 torr. 1bis interlock system
liquid nitrogen level sensing Torr Vacuum Products Cryomiser which has
proven to be more reliable than the clocks previously used. The 2"
diffusion pump trap and the cryopump must be filled manually at
approx-imately 8 hour intervals.
b) R.F. a:nd magnetic shielding
The spectrometer and its associated electronics are contained within
a specially designed RF shielded enclosure manufactured by Topatron
Inc. This room provides 100 dB attenuation of electromagnetic
frequen-cies in the range of 1o4 to 1011 hz. All of the electrical and mechanical
feedthroughs into this room are designed to minimize RF transmittance.
It had been thought that such shielding was necessary for high resolution
work4 but we have found that for the resolutions used in this work (30
-100 meV), that keeping the entrance door to the enclosure open or closed
made no difference in the operation of the spectrometer.
Magnetic shielding is very important in ensuring proper operation of
this instrument. The magnetic shielding used consists of a single .050"
~-metal shield which reduces the ambient magnetic field within the
spec-trometer to about 5 milligauss. Even with this shielding, care must be
taken not to introduce any highly magnetic materials or objects into the
vicinity of the spectrometer. It was found that LN2 dewars and some tools
had a visible effect on the electron beam when brought into the vicinity of
the instrument. This was especially true at the lower incident energies
(15- 25 eV).
eter since the operating characteristics of the instrument are deter-mined by them. There are two sets of electron optics which may be used with this instrument. The first set is that described in the Ph.D. thesis of W. M. Flicker1 and was initially tried with negative results. Negligible current was measured at the scattering center (in addition to being difficult to tune) leading to the design of a new set of electron optics. This set was designed by Dr. David Edmonson and is briefiy described in the thesis of R. Rianda. For a more detailed discussion of the design parameters used, the reader is referred to laboratory notebook 1/4377, pp. 11-79. While showing better characteristics than the original optics, this set also proved to have problems in ease of tuning and maintaining a usable electron current at the scattering center. A number of modifications were made before reliable operation was attained. We will thus proceed to describe this last set of optics with the design changes included since it is this set which was used in the collection of all the data presented in this thesis.
was changed to a symmetric configuration using four deflector plates.
This change resulled in greally increased currenl al Lhe scallering center in addition to simplifying the tuning of the instrument.
The 12:1 decelerator is formed by lens elements M3 and HMl. It is here that the image sizes, pencil angles, and energy of the electron beam are set prior to energy analysis. In the initial design, the window object and pupil were composed of .040" and .030" molybdenum apertures, respectively. These have been changed to two .020" apertures which resulted in slightly lower beam currents as measured at the hemispheri-cal analyzer but increased the beam current transmitted through the analyzer by at least a factor of :five as well as providing an increase of a factor of two in the energy resolution. There are four deflector plates located between these two apertures which are used to maximize current transmission and to counter surface potential effects. There is a .1"
diameter spatter aperture located in HM1 which serves to prevent stray electrons from entering the hemispherical analyzer. The electron energy analyzers in both the monochromator and analyzer sections of the instru-ment consist of hemispherical sectors with a mean radius of 2.25". The theoretical AE/ E of these analyzers is 1%.
con-the monochromator optics through a .030" aperture in the exit snout and enter the scattering region. The exit snout, scattering chamber, and entrance snout form a field free region for the electrons to traverse. The apertures in both snouts serve to perform additional collimation of the electon beam as well as separating the main vacuum chamber from the differentially pumped optics chambers. The beam divergence angle has been measured to be about 1.5 degrees. Ideally the interaction region is to be free of both electric and magnetic fields but in practice we have found that in using incident energies below 20 eV is difficult and requires very careful removal of all stray magnetic fields.
Two apertures (.030" and .015") within the exit snout define the
z
o
acceptance angle of the analyzer system. Electrons traveling through the snout are accelerated by the adder (All) which serves to add in the energy the electron lost in its interaction with the target gas. This lens is designed to be a "weak" lens in that the focal properties of the electron beam passing through it are not significantly changed. The focus lens (A9) functions over a wide voltage range and focuses the beam onto a 4:1:4 Einzellens formed by the lens elements A7, A5, and A3. A7 contains another set of 4 deflectors which permit fine beam steering. This Einzel lens translates the image to a 35: 1 decelerator formed by lens elements A3 and HA2. The electrons are again energy analyzed by a hemispherical sector analyzer identical to that used in the monochromator.The detector stage optics are not those originally designed for this set but rather those designed for the original electron optics by W. M.
located in HA2 which functions as the energy resolving aperture. This was
changed from the .050" aperture in the initial design. There is a set of
deflectors located in A4 in order to prevent "bore sighting" in the
elec-tron multiplier but these are not used at present and are just electrically
connected to A4. The theoretical voltages for the lens elements are listed
in table 1. These voltages only represent good starting points, the actual
voltages vary according to the operating conditions and cleanliness of the
electron optics.
As mentioned earlier, two of the problems encountered with both
sets of optics were the lack of usable current at the scattering center
and ease of tunability. It was found in the case of the second set of optics
that the asymmetric deflectors were the primary cause of this trouble.
The deflectors were changed to symmetric sets in both sets of optics even
though the Flicker design was not used in these studies. The instrument
wiring has been changed (see pages 154 and 162 of lab book #5000) to
accommodate both sets of optics in a way that interchanging them should
be an easy task.
Changes were also made to the control panel wiring described in Lab
book #4377, pages 140-141. The accelerator and decelerator lens
ele-ments on both the analyzer and monochromators were wired together
but this was changed such that all the elements were individually
adju-stable. This has made tuning easier and allows for more complete
com-pensation of surface potential effects.
The monochromator is mounted on a rotating table such that it may
100° due to the fact that the analyzer and monochromator are located at
an angle of 20° with respect to the horizontal plane (figure 4). This is
somewhal less lhan the 135° maximum scallerlng angle achievable wilh
the Flicker design. Initially this 20° angle caused difficulty in aligning the
optics however the mounting brackets on the front flange were modified
so that the entire spectrometer assembly can be tilted -20° with respect
to the horizontal plane such that one has a straight line-of-sight through
the optics for alignment. As mentioned previously both the analyzer and
monochromator optics assemblies are enclosed in differentially pumped
housings which maintain pressures below 5 x 10-e torr during
spectrome-ter operation. The entire spectrometer is mounted on a wheeled cart so
that it can be easily removed for servicing (figure 5).
Typical beam currents as measured at the scattering center range
from 1 to 20 nanoamps. System resolutions are typically between 50 and
100 meV FWHM as measured for the elastically scattered beam. High
resolution spectra have been taken at 30 meV FWHM under optimal
condi-tions.
d) Target source
In the thesis of W. M. Flicker1, a dual mode target source was
described which could either be used as a static gas cell or, with the
removal of a cap, a capillary-array molecular beam source. This was all
designed into two stainless steel blocks which also contained the electron
optics he designed. With the new electron optics, this system could not
be used so a new target source had to be devised. A new source was
dev-ised in such a way that it would be easy to convert from a static gas cell
.060" holes drilled opposite the slot at 0° and 55° which allow the electron
beam Lo exil inlo lhe analyzer and Faraday cup assemblies, respeclively.
The Faraday cup consists of a short length of OFHC copper tubing that is
sealed at one end. The tube slides onto a 3/8" OD copper tube and is held
in place by three set screws. The 3/8" tube functions as the gas inlet and
passes through the differential pumping stand in the center of the table
via a rotary seal assembly . In all other respects the sample inlet system
closely resembles that described by Flicker.1
Initially the molecular beam capillary array described by Flicker was
tried but it was found to load down the vacuum system without producing
a sufficient intensity at the scattering center. A new effusive source was
constructed using a #316 stainless steel hypodermic needle of .050" ID
and length-to-diameter ratio of 6 (figure 6). This assembly is press fit
onto the gas inlet tube and was found to provide adequate gas density at
the scattering center without overloading the pumping system. The
pres-sure in the main chamber is approximately a factor of two greater when
using the beam source as compared to the static gas cell. DCS
measure-ments using well-known systems were made using both sources to ensure
that no artifacts due to surface effects were present.
The third target source which may be used with this instrument is
the heated pyrolysis tube (figure 7). This consists of a 1 /4" OD quartz
tube which is constricted at one end to form a 1/8" OD, .060" ID, .3" long
capillary. Around this capillary is wrapped one layer of #316 stainless
steel sheathed heater wire (manufactured by Semco Industries) which
tion shield. Thermocouples located on the heater assembly are used to monitor the temperature. Temperatues in excess of
aooa
C have been attained with this source. The characteristics of this source are very similar to the capillary source described previously. The gas inlet line for this source is a #316 stainless steel flexible hose which connects to the normal inlet system at the front flange feedthrough. The flexline permits free rotation over the full angular range of the instrument. Preliminary results (see Chapter 7 of this thesis) indicate this type of source can be used to provide a usable density of free radicals at the scattering center.There are, however, several problems which must be addressed in future revisions of this design. The major problem incurred is the mag-netic field generated by the current flowing through the heater wire. At the maximum heater current a decrease of 20% in the electron beam current at the scattering center was observed. This may cause problems when accurate DCS measurements are desired.
e) Detection and data collection system
increment-being accwnulated on an oscilloscope and can plot the spectrwn on an
X-Y recorder. The spectra accumulated are stored on floppy disk for
transfer to a mainframe computer for further data analysis.
f) Data hD.ndling
The data handling programs written by R. Rianda 1 were not used in this work due to the removal of the computer for which they were
writ-ten. These programs were rewritten so that they would run on the
chem-istry department VAX 11 /?80. The floppy disk operating system on the
spectrometer computer uses a different storage format than that used by
the VAX. To remedy this a translation program was written by J. W.
Win-niczek which converts data from one storage format to the other. Once
the data is transfered, it may be further analyzed by a set of programs
based on the series of data analysis programs described by W. M. Flicker1
1. W. M. Flicker, Ph.D. Thesis, California Institute of Technology, Pasadena, CA. (1976).
2. R. P. Frueholz, Ph.D. Thesis, California Institute of Technology, Pasadena, CA. (1978).
3. R. Rianda, Ph.D. Thesis, California Institute of Technology, Pasadena, CA. ( 1981).
4. J. K. Rice, Ph.D. Thesis, California Institute of Technology, Pasadena, CA. (1969).
5. 0. A. Mosher, Ph.D. Thesis, California Institute of Technology, Pasadena, CA. (1975).
Table 1.
Lens Element Volta&es llonochromatorA
Anode Condenser 113 HM1.HM2 114 116 Field 116 Focus
200 24 2 24 175 60
Analyzerb
Eo
A9 Focus A4,A3,A7 A5 HAl,HA230 100 80 20 3 50 175 110 28 4
70 240 140 35 5
90 300 170 42 6
a) Voltages referenced to the filament center voltage.
Figure 1. Schematic diagram of the electron-impact spectrometer vacuum system. CB 1: 9" freon baffi.e, CB2: 2" freon baffle, CT: 9" LN2 cryotrap, DP: 9" mercury diffusion pump, E: stainless steel elbow, EL: mechanical pump exit line, FL: foreline, GV: 10" pneumatic gate valve, Gl, G2: ionization gages, MP: 500 liter/minute mechanical pump, T1, T2: thermocouple gages, V1: foreline valve, V2: roughing valve, V3: chamber vent valve, V4: foreline vent valve.
Figure 2. Schematic diagram of the electron optics (set 112).
Figure 3. Schematic diagram showing the rotation of the monochroma-tor relative to the analyzer about the pivot axis.
Figure 4. Schematic diagram showing the orientation of the electron energy anlyzers to the parting plane and the rotating table.
Figure 5. Schematic diagram showing the ftange cart with the spec-trometer mounting table and ftange indicated by the dashed lines.
Figure 6. Schematic diagram showing a) the effusive molecular beam source, b) the static gas cell. AES: analyzer entrance snout, CAP: hypodermic needle capillary, EA: exit aperature, ES:
entrance slot, GI: gas inlet, MES: monochromator exit snout. Figure 7. Schematic diagram showing the free radical beam source. GI:
Q)
"'0'-Q)~ -oo
Q ) -·- u ..cc:: (f)W
~
-
~
·
-
·
-
-
·
-:;-·-
·
- · 1
N
>
>
.
i
r--
I
I
I
w
r - - - - iI
I
.
I
I
I
I
I
Condenser
Anode
Cothode
M)fl.l0CHROMATOR
""'Hf~
;
;
,
·
M3 _ _.020
M7-
M5-~
- 035" 050"
M9-MS2
Foeld Focus
- - En1ronce Snout
.
030"-030"
---Exit Snout
ANALYZER
Pivot Axis
SPECTROMETER ORIENTATIO\J
..QJ .D
t2
.
~ ~
~
0a..
(f)0:
w
N~
<!
z
<!
0
0:
w
r5
!\
lL0
Q)
c
b
~~
I(f) (f)
a
t:r
c -
~ Q) ~0 l9
l 9 Z -o0.>
z
J
c .>
w
o~
0:
Eo
0
~
~
~c..9
.Q-
I~~
I·- ( f ) I
l2
0
a:
r--~ r-r- r-r-
r-r-I (""\ ~
-
I \ \r-
I \ \I I \ \
I r ' \ \
+--
'\
\I '
-
I',-
- - - -
-
-
-
-1--r' I
I I
'
I II
f -
~_t:-:::-:::-:::-:::-:::::~j
i
f - Iw
~I I
~
T.T
':,.~•
~
~
~
~
~
cY
(y
ROLLING CART
AES
1cm
...
GI
EA
~--QT
1
em
CHAPTER 5
Paper I:
Arthur Amos Noyes Laboratory of Chemical Physics, b
California Institute of Technology. Pasadena, California 91125 USA
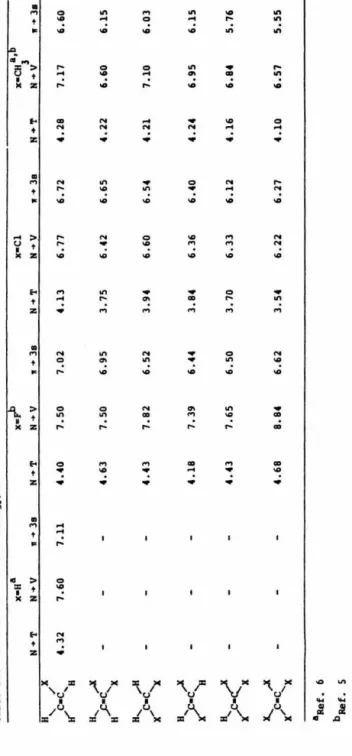
Electron-impact spectra of the six chloroethylenes have been
obtained at impact energies of 25, 50, and 100 eV and at scattering angles
from 0° to 90°. The angular and energy dependence of the relative
differential cross sections was obtained for several features in the energy-loss region from 0-11 eV. The behavior of the differential cross
section was used to identify transitions as being spin-forbidden,
symmetry-forbidden, or fully allowed. In each molecule the lowest
transi-tion was identified as being analogous to the N -+ T transition in ethylene. The position of the excitation maxima for these transitions decreases
from 4.13 eV in vinyl chloride to 3.54 eV in tetrachloroethylene.
Symmetry-forbidden features were also observed in trans-dichloroethylene and tetra-chloroethylene. Transitions to many states,
lying above the first ionization potential, were observed for the first time
and assigned as belonging to Rydberg series converging to higher
ioniza-tion potentials by using the term value method .
•
bWork performed in partial fulfillment of the requirements for the ·Ph.D. degree in chemistry at the California Institute of Technology.
between 10° and 90°. Higher resolution energy-loss spectra were meas-ured at 100 eV incident energy and
oo
scattering angles so as to approxi-mate "optical" spectra.1In the following sections we shall attempt to summarize the previous experimental and theoretical work on the chloroethylenes. The experi-mental details of this work will be described and results presented and discussed on a molecule-by- molecule basis. In the case of valence-type excitations, the assignments of the various transitions are made with reference to those in ethylene. For Rydberg transitions the term value approach is used. The relevance of this work to the photochemistry of the chloroethylenes will be discussed, as well as the trends observed in transition energies as a function of substitution. These trends will also be discussed in light of those for other substituents.5•6
ll. PREVIOUS WORK a} Erperimental
ence has been inferred from various shoulders appearing on the N -. V lransition.8 The remainder of the spectiJ.llll consists mainly of sharp bands which are Cl3p-. nl Rydberg-type_ transitions converging to the various ionization potentials of the molecules. Moore22 has previously studied the N,.. T, 1T ,.. n•, singlet -. triplet excitations in vinyl chloride, 1,1-dichloroethylene, and tetrachloroethylene using ion scattering tech-niques. This transition occurs as a broad structureless band extending between 2.5 and 4.5 eV.
A large number of photoelectron and photoionization studies have been performed on various members of this series of compounds. 1!7-4? In the tables of transitions for each molecule we will refer exclusively to the works of Lake and Thompson27 and Von Niessen et aL28
b) TheoTetical
No high quality, ab mitio type calculations exist for any of the chloroethylenes. However, semi-empirical MO-type calculations have been performed on this system by several groups. Pellegatli et al.,48 and Rajzmann and Pouzard49 have calculated 1T -.
n•,
N -. V excitation ener-gies while Kato et al. 50 have not only calculated the positions of N -. V transitions but have also calculated the positions of the N -. T excitations. Favani and Simonetta,51 Howe et aL,52 and Fueno and Yamaguchi53 have performed similar calculations on the dichloroethylenes. The results of these calculations will be listed in the tables of transitions for each molecule.m.
EXPERIIIENTALa) introduction of differentially pumped electron optics,
b) interchangeable target sources, i.e., static gas cell or effusive molec-ular beam sources,
c) larger hemispherical analyzers,
d) the monochromator and analyzer reside at 20° angles with respect to the horizontal plane.
In brief, it consists of an electron monochromator, which can be rotated about the scattering center from -15° to +100° with respect to the el ec-tron energy analyzer. The electron optical schematic is shown in figure 1.
The heart of both the monochromator and analyzer systems are two identical 2.25" mean radius hemispherical sector electron energy
stored in the memory of an MSC 8001. Z80 b