AN ACCELERATED K-MEANS CLUSTERING ALGORITHM
FOR IMAGE SEGMENTATION
1SEYED MOJTABA TAFAGHOD SADAT ZADEH, 1ALIREZA MEHRSINA, 2MINA BASIRAT,
1 Faculty of Computer Science and Information Systems, Universiti Teknologi Malaysia (UTM), Johor
Bahru, Johor, Malaysia
2
Faculty of Electrical, IT & Computer Science, Qazvin Islamic Azad University (QIAU), Qazvin, Iran
E-mail: [email protected], [email protected] , [email protected]
ABSTRACT
This paper proposes a new enhancement and efficient approach for diminution of iterations in K-Means algorithm. Also a quantized color and gray scale histograms are used for HSV color environments to reduce the process of image segmentation. As an apposed to traditional K-Means technique, in the suggested approach the initial centroids are automatically designated by an effective set of relations. Thus, pixel clustering process is only necessary to be done once after discovering all the centroids. Experimental results show that the new enhanced proposed approach gives better outcome in terms of speed and the results got from this research is closer to human visual perception from the colors.
Keywords: Color Image Segmentation, K-Means, Quantization, Image Processing, HSV Color Space
1. INTRODUCTION
One of the most important operations in image processing is segmentation. Image segmentation is considered as identification of consistent areas in the image. Several techniques have been proposed for gray scale images, however the segmentation of color images has received less attention [5]. Image segmentations generally defined as partitioning an image into set of similar groups, which the segments are separated in terms of color. There are some characteristics that good image segmentation should present [10]; the inner segments should be simple and without any small hole. The neighborhood segments should have completely different colors. And finally the segments borders should not be rough and must be simple and accurate. The most important feature in color image segmentation is region definition. Region is defined as set of pixels represented by a membership function, which is defined in color space. From another point of view several connected pixels bounded by edge pixels, create one color region [5].
Segmentation is playing a significant role in image processing and computer vision since it is dealing with low-level processing of the images [2]. For instance, one of most tangible and practical application of image segmentation is fast and efficient transmission of large image files through the Internet. When there is limited amount of
bandwidth available for transmitting multimedia files, the need for a kind of data compression emerges. Analyzing human vision in depth has led to the fact that there are huge amount of color ranges that human vision cannot detect. One scene of image can be divided into perceivable parts based on human visual system. This division is done through segmentation. After that the compression procedure is done by dedicating more bits for the regions human vision can perceive and dedicating fewer bits for that regions human vision cannot perceive. In general when there is limited size of bits for displaying an image or transmitting
Input Image (RGB)
Post-Processing Clustering
Segmentation Results
Color Space Transform
Quantization
[image:1.612.316.522.382.558.2]Maxmin Initialization
it, segmentation would help not only for compression of the images, but also for color quantization. For taking another example, in content-based image retrieval (CBIR) the image segmentation is a basic phase of the procedure. It is obvious that texture and color are two important components, which work in the basis of the regions obtained from image segmentation.
There are different types of approaches for segmentation regarding to various applications. These approaches are divided into 1) Pixel-based, 2) Region-based, 3) Physical and 4) Fuzzy logic approaches. In Pixel-based approach there are Clustering and Thresholding approaches. Region Growing, Region Splitting and Merging and Edge detections techniques are in Region-based Technique; and the Fuzzy Clustering is classified in Fuzzy Logic approaches.
Generally all image segmentation methods are considered to be based on two characteristics of the pixels, which are similarity and discontinuity. Techniques related to discontinuity are called boundary-based methods, and techniques related to similarity are called region-based methods but both of the techniques do not provide an accurate segmentation. However there are some integrated approaches of boundary-based and region-based techniques proposed to produce better results in the cases that the image scene is somehow complex such as the nature scenes in which the colors are difficult to be segmented [11,12].
One of the techniques is K-Means method, which is used in clustering. Clustering cumulates set of pixels into different groups in the color space. This algorithm is good for clustering pixels in images and video because of its simplicity and ability to group the pixels efficiently [3,4]. The important issue in the K-Means algorithm is to define suitable
K for it. The problem is to adjust this parameter fixed or finding a solution to dynamically find and set it to get the best result. One solution is to run the algorithm for several times to get the best number for K however this solution is not efficient because it will take too much time [3,6]. On the other hand for initialization of algorithm some cluster centers (centroids) are defined in color space. If these centers selected randomly the result will change every time the algorithm runs. Thus there is a need to propose an algorithm that can overcome these problems. Another important issue in segmentation is to choose a proper color space, as it will affect on the final result. Some researches show that segmentation in HSV color space produces better results than RGB color space [5,7]. In addition the
HSV color space is closer to human visual perception than other color spaces in terms of hue.
Chen et al [1] have applied K-Means algorithm to color image segmentation. They use a new quantization technique for HSV color space to generate a new histogram and make the algorithm faster. Also in this approach color and gray histograms have been considered together in clustering. They also have efficiently approximated the value of K. And the most important part in this approach is that the final result of segmentation is very close to human visual perception. Because of these advantages, the proposed approach is seem to be very useful for the systems with fewer computational resources and processing big image file. In spite of using quantization method for speeding up the image segmentation procedure, the number of repetition in K-Means causes taking more time in real-time systems.
In this paper the K-Means algorithm for color image segmentation, which is used in [1], has been optimized and leads to simplify the algorithm and efficiently improve it. In this research we have reduced the number of repetition to only once. The paper is organized in this way: In section 2, the proposed algorithm is explained. In section 3, the result of the proposed algorithm will be shown. Next in section 4, a comparison with that original K-Means algorithm is given. Finally in section 5, a short conclusion for the paper is given.
2. PROPOSED ALGORITHM
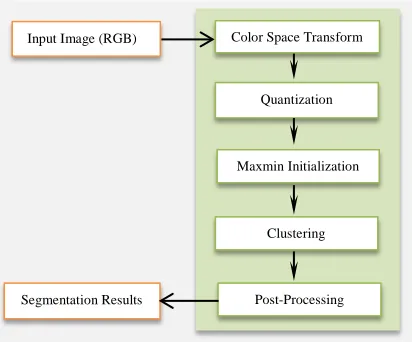
The overview of the proposed algorithm is shown in Fig.1 and in the following the details about the phases is explained.
2.1 Choosing Color space and Quantization
[image:2.612.367.476.602.689.2]In [1] work, HSV color space is chosen hence it is more familiar to human visual perception and in order to move from RGB to HSV, a transform is defined [8]. For normalization of dimensions in HSV, three parameters must be defined as follow:
h'=�Hue/h
Q�, (1)
s'=�Saturation/s
Q�, (2)
h'=�Value/v
Q�, (3)
Where ℎ′, 𝑠′ 𝑎𝑛𝑑 𝑣′ are the quantization index and the parameters ℎ𝑄= 12°, 𝑠𝑄= 0.125, 𝑣𝑄 =
0.125 are defined to reduce the color space and
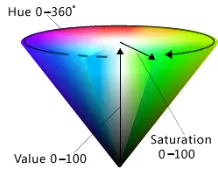
decrease the complexity of the computation. As it is shown in the Fig.2, in the HSV color space the Hue is [0,360°], Saturation is [0,1] and the Value is also [0,1]. Thus there are 30 × 8 × 8 = 1920 partitions in the HSV color space. Since pixels’ color with low
saturation is close to gray scale, they are suggested
to be ignored in the process of quantization for getting better results [6, 9]. As it has been shown in Fig.3, the pixels with the lowest saturation will give the gray histogram (8 colors only) and the rest are considered as color histogram of 30 × 7 × 7 = 1470 partitions. Thus, 𝐺(𝑣) refers to the number of pixel in the gray histogram bin with parameter v, whereas 𝐵 = (ℎ, 𝑠, 𝑣) indicates the number of pixel in the color histogram bin with parameters (ℎ, 𝑠, 𝑣). The correspondence of these parameters and the quantization indices are (ℎ′, 𝑠′, 𝑣′). Afterward, we convert origin image’s pixels colors into these partitions with eq(1-3) and start counting them to generate two histograms. Finally, each bin equals to a number of pixels which have same colors.
2.2. Initialization of the Centroids and Parameter Estimation
In the new proposed approach the Maxmin
algorithm estimates the initial position for the centroids [4]. However, in the traditional algorithm of K-Means, the number of K is given by the user and the positions for the centroids are randomly selected. The Maxmin algorithm for estimation procedure is done in 3 phases and explained in the following:
Phase 1: In the first phase, from the both color and gray histograms the one with the maximum number of pixels is selected to be the first centroid.
Phase 2: Next, for the other remaining histogram bins, Calculate the minimum distance for each bin
vector 𝐵𝑖= (ℎ𝑖, 𝑠𝑖, 𝑣𝑖) and nearest centroid vector 𝐶𝑗= (ℎ𝑗, 𝑠𝑗, 𝑣𝑗). The matter which is ignored in [1] is that we need to find eligible bins in connection with diversity and quantity. In this case, the number of pixel in each bin is very significant indicator to pick the rest centroids. Therefore, an efficient method introduced to calculate relative distances. The relative distances for histograms are proposed in (4) and (5) for both color and gray histograms respectively.
∅(Bi)= �j, if j = argmink D4 (Bi,Ck)×B(Bi)�
(4)
∅(Gi)= �j, if j = argmink D2 (Gi,Ck)×G(Gi)�
(5)
Where ∅(𝐵
𝑖) and ∅(𝐺𝑖) stores the nearest centroid
for each bin correspondingly for color and gray histograms. Also 𝐵(𝐵𝑖) donates the number of pixels in the color histogram bin and 𝐺(𝐺𝑖) refers to the number of pixels in the gray histogram bin. Since we reduced the color space into a limited one, distances between two adjacent bins are very close together, regarding the human visual perception the bins are mostly distinguished not quite the same. That’s why we increased the distance by adding power of 4 instead of power of 2, thus:
D4 �B
i,Cj(t)�=Dh4�hi,hj(t)�+�si-sj(t)� 4
+�vi-vj(t)� 4
(6) Where
Dh4�hi,hj(t)�=
⎩ ⎨ ⎧ �360
hQ - �hi-hj
(t)��4, if �h
i-hj(t)�>180h Q
�hi-hj(t)� 4
, otherwise
(7)
Note that this is just used for color histogram bins and not for the gray histogram. In gray histogram the distance equation is remained as before in [1] as subsequently:
D2 �G
i,Cj(t)�=�sj(t)� 2
+�vi-vj(t)� 2
(8) This means that the saturation values of gray histogram bins are all considered as zero, and the hue values can be arbitrary.
[image:3.612.100.282.597.660.2]Finally, the bin with the maximum value of minimum distance (the farthest distance with
previous centroids) is selected to be the next centroid.
Phase 3: This process will be repeated until the number of centroids equals to predefined threshold, which is called 𝐾𝑚𝑎𝑥. The threshold value normally is not more than 10 dominant colors in one image.
2.3. K-Means clustering in HSV color space The proposed K-Means algorithm for clustering in HSV color space contains 3 phases, which are explained as follow:
Phase 1: Basically, original k-means use iteration method to find best seeds, however because of choosing initial seeds randomly, the result depends to the time is dissimilar.In the first phase the initial centroids are estimated by proposed Maxmin algorithm introduced in section 2.2 and the bins, which were adequate for being nominated as centroid, provided for initial seeds for k-means in the best case. Consequently, k-means do not need using iteration method and also has the same result independently to the time.
Phase 2: Color and Gray of histogram bins will be clustered here in this phase. For the last time, recalculate the minimum distance for each bin vector 𝐵𝑖𝑎𝑛𝑑 𝐺𝑖 to the nearest centroid vector 𝐶𝑗= (ℎ𝑗, 𝑠𝑗, 𝑣𝑗) and then store index of centroid as
the bin’s centroid. As you see below, there is no need to multiply number of pixels regarding to the correspond bins.
∅(Bi)= �j, if j = argmink D4 (Bi,Ck)�
(9)
∅(Gi)= �j, if j = argmink D2 (Gi,Ck)�
(10)
Phase 3: Finally, origin image pixels need to be labeled with the index of nearest centroid of their corresponding histogram bins. A labeled image 𝑙(𝑥, 𝑦) is obtained here, and K-Means clustering is finished. To label a pixel, we firstly need to convert origin pixel color into HSV mode and use (1-3) to find relevant bin in color or gray histograms depending on value or saturation. Note that, pixels with value = 0 means black; saturation = 0 and
value = [1, 7] are considered from white to gray
(totally 8 gray scale colors); the other partitions are belonged to color histogram.
3. POST-PROCESSING OF SPATIAL
REGIONS
In the Post-Processing part, an efficient approach is used for eliminating noise and unnecessary details. There are convolution filters and non-convolution methods in spatial filtering. In Non-convolution filter, which is used in our approach, Erosion is a filter that changes the shape of the objects in an image by eroding or reducing boundaries of the bright objects and enlarging boundaries of the dark ones. On the other hand the
Dilation changes the shape of an object by dilating
or enlarging the boundaries of bright objects and reducing the boundaries of dark ones. In the proposed method both Dilation and Erosion are applied to the images to reduce the noise.
4. EXPERIMENTAL RESULTS
[image:4.612.314.523.446.552.2]The experimental results for the proposed approach are considered from different point of views. The first part is time complexity comparison. The time complexity for the algorithm [1] and the new proposed algorithm have been compared in Table 1. As it shows there are a few equations used in the proposed algorithm, however the old algorithm uses 12 complex equations.
Table 1. Time Complexity Comparison Between The Proposed Algorithm And The Algorithm In [1].
Equation No. of Methods in [1]
Time Complexity of Methods in [1]
Equation No. of Proposed Method
Time Complexity of Proposed Method
(4) O(3 I(N+M) (6) O(3(N+M)) (6) O(KI(N+M)) (4,5,9,10) O(K(N+M)) (7) O(2 I(N+M) (8) O(2(N+M)) (8 -11) O(KI*(N+M)) - 0
(12) O(2KI(N+ M)) - 0
Where, K is the number of clusters, N is the number of color histogram bins, M is the number of gray histograms bins, and I is the number of
iteration. As it can be seen in Table 1, it is obvious
that the time complexity for the proposed algorithm has been reduced and will obtain better results in terms of speed.
A(1) A(2) A(3)
B(1) B(2) B(3)
C(1) C(2) C(3)
D(1) D(2) D(3)
E(1) E(2) E(3)
Figure 4. Original Images: A(1) Kodim02, B(1) Kodim23, C(1) Kodim07, D(1) Kodim22, E(1) Kodim01. Segmentation Results For [1]: A(2) Kodim02 (K=2), B(2)
Kodim23 (K=7), C(2) Kodim07 (K=4), D(2) Kodim22 (K=6) E(1) Kodim01 (K=2). Segmentation Result For The New Proposed Approach: A(3) Kodim02 (K=3), B(3)
Kodim23 (K=6), C(3) Kodim07 (K=4), D(3) Kodim22 (K=5), E(3) Kodim01 (K=2).
As it is shown in Fig. 4 the results obtained form the new proposed algorithm A(3), B(3), C(3), D(3) and E(3) are appear better in respect to [1] A(2), B(2), C(2), D(2), E(2) in terms of color’s value. It can be seen that although some phases from the old K-Means algorithm [1] has been removed, time complexity is reduced and the results are almost better. As it is shown in the pictures the results from the proposed method can produce more natural segmentation, which is near to human visual perception.
5. COCLUSION
The new method for faster and efficient image segmentation is proposed in this paper. The method uses K-Means clustering foundation in HSV color space and the algorithm starts with the Maxmin initialization. The proposed approach obtains better segmentation results than the previous algorithm as the time complexity have been reduced and the results are more similar to human visual perception. Accordingly, this approach can be useful for real
time image processing tools such as Content-based image retrieval systems.
REFRENCES:
[1] T. Chen, Y. Chen, and S. Chien, “Fast image segmentation based on K-Means clustering with histograms in HSV color space,” 2008 IEEE 10th Workshop on Multimedia Signal Processing, pp. 322–325, Oct. 2008.
[2] L. Lucchese and S. K. Mitra, “Color image segmentation: A state of the art survey” 2001. [3] M. Luo, Y.-F. Ma, and H.-J. Zhang, “A spatial
constrained K-Means approach to image segmentation,” In Proceedings of the Joint Conference of International Conference on Information, Communications and Signal Processing, and Pacific Rim Conference on Multimedia, vol. 2, Dec. 2003, pp. 738–742.
[4] V. Mezaris, I. Kompatsiaris, and M. G. Strintzis, “Still image segmentation tools for content-based multimedia applications,” International Journal of pattern recognition and artificial intelligence, vol. 18, no. 4, pp. 701–725, Jun. 2004.
[5] W. Skarbek and A. Koschan, “Color image segmentation: A survey” 1994.
[6] S. Sural, G. Qian, and S. Pramanik, “Segmentation and histogram generation using the HSV color space for image retrieval,” in Proceedings of IEEE International Conference on Image Processing, Sep. 2002, pp. 589–592.
[7] Z. K. Huang and D.-H. Liu, “Segmentation of color image using EM algorithm in HSV color space,” in Proceedings of IEEE International Conference on Information Acquisition, Jul. 2007, pp. 316–319.
[8] W. Chen, Y. Q. Shi, and G. Xuan, “Identifying computer graphics using HSV color model and statistical moments of characteristic functions,” in Proceedings of IEEE International Conference on Multimedia and Expo, Jul. 2007, pp. 1123–1126.
[10] R. M. Haralik and L. G. Shapiro, “Computer Vision Graphics and Image Processing,” 1985.
[11] M. Salotti and C. Garbay, “Anew paradigm of segmentation”, International conference on Pattern recognition, vol. C, PP. 611-614, August 1992.
![Figure 3. Histogram generation process in HSV color space [1].](https://thumb-us.123doks.com/thumbv2/123dok_us/8915987.961831/3.612.100.282.597.660/figure-histogram-generation-process-hsv-color-space.webp)
![Table 1. Time Complexity Comparison Between The Proposed Algorithm And The Algorithm In [1]](https://thumb-us.123doks.com/thumbv2/123dok_us/8915987.961831/4.612.314.523.446.552/table-time-complexity-comparison-proposed-algorithm-algorithm.webp)
