Private Pensions in the UK: Coverage, Contributions and Consequences
Thesis submitted to the University o f London for the degree of Doctor o f Philosophy
Nicholas Richard Kirby
Department of Social Policy
London School of Economics and Political Science
UMI Number: U143023
All rights reserved
INFORMATION TO ALL USERS
The quality of this reproduction is dependent upon the quality of the copy submitted. In the unlikely event that the author did not send a complete manuscript and there are missing pages, these will be noted. Also, if material had to be removed,
a note will indicate the deletion.
Dissertation Publishing
UMI U143023
Published by ProQuest LLC 2014. Copyright in the Dissertation held by the Author. Microform Edition © ProQuest LLC.
All rights reserved. This work is protected against unauthorized copying under Title 17, United States Code.
ProQuest LLC
789 East Eisenhower Parkway P.O. Box 1346
f
W i t
f:S
o f ^• POLITICAL j!
Abstract
Private pensions play a greater role in the UK than in other European countries, and recent reforms proposed by the Labour government envisage an even greater role for them in the future. Although low earners are still to have their retirement income provided for through the state, middle and higher earners are to provide the bulk o f their retirement income through private pensions. This framework assumes that people are well-informed rational consumers who will choose to re-allocate their consumption over time, yet there has been little research effort to analyse current patterns o f private pension accumulation in the UK. This thesis aims to bridge this gap by using the Family Resources Survey 1994-95 to analyse this voluntary behaviour. This is done with reference to five themes: coverage, adequacy, compulsion, rationality, and asset accumulation.
The major part of the thesis uses both cross-tabulations and more sophisticated regression-based tools to analyse the constituent parts of pension accumulation. Private pension coverage is analysed for both occupational and personal pensions. The proportion making additional contributions and the amounts paid are also examined. The thesis also covers the employee contributions paid as a result o f scheme membership. Pensions are not the sole means by which a stream o f income can be built up and so the level of financial assets held is examined. In all cases the differences between various groups within the population are highlighted.
Table of Contents
ABSTRACT 2
TABLE OF CONTENTS 3
LIST OF TABLES 6
LIST OF FIGURES 11
ACKNOWLEDGEMENTS 12
INTRODUCTION 14
CHAPTER ONE: PENSION POLICY AND BEHAVIOUR IN THE UK 18
Introduction 18
Section A: Function, Economic Rationale and Effects of Pensions 18
Section B: The UK Pension System: Structure and Effects 24
Section C: Incomes and Assets of Pensioners 32
Section D: Private Pension Coverage and Contributions: Existing Evidence 37
Section E: Information and Attitudes 43
Section F: Reform Proposals 50
Conclusion 58
CHAPTER TWO-RESEARCH QUESTIONS AND METHODOLOGY 60
Introduction 60
Research Proposal 60
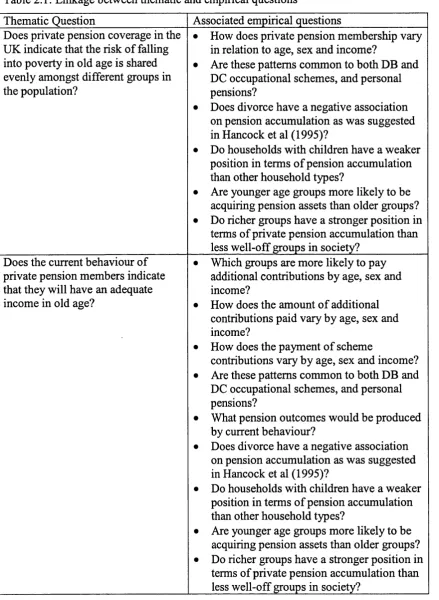
Thematic Questions 63
Empirical Questions 64
Methodology 70
Conclusion 83
CHAPTER THREE: PRIVATE PENSION COVERAGE 84
Introduction 84
Interim Summary 102
Section B: Logistic regression analysis 103
Conclusion 114
CHAPTER FOUR: ADDITIONAL CONTRIBUTIONS-WHO PAYS? 116
Introduction 116
Section A: Likelihood of Additional Contribution payment 117
Interim Summary 137
Section B: Logistic Regression Analysis 139
Conclusion 148
CHAPTER FIVE: SCHEME CONTRIBUTIONS 151
Introduction 151
Methodology 152
Section A: Scheme contributions to Private Pensions 153
Interim Summary 165
Section B: Regression Analysis of Scheme Contributions 167
Conclusion 175
CHAPTER SIX: ADDITIONAL CONTRIBUTIONS-HOW MUCH? 177
Introduction 177
Methodology 177
Section A: Additional contribution payment to occupational and personal pensions 178
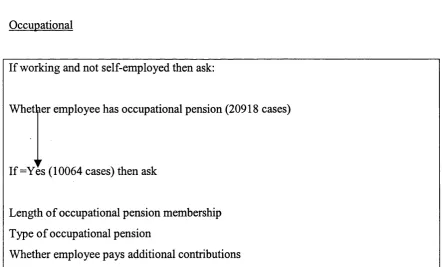
Occupational Pensions 178
Interim Summary 182
Personal Pensions 183
Interim Summary 194
Section B: Regression analysis of additional contribution payment 195
Conclusion 202
Introduction 205
Methodology 205
Section A: Asset accumulation by the whole population 206
Section A: Summary 219
Section B: Relationship of Asset and Pension Accumulation 220
Section B: Summary 231
Section C: Further Analysis and Illustrative Cases 232
Illustrative Cases 237
CHAPTER EIGHT: PRIVATE PENSION OUTCOMES 239
Introduction 239
Section A: Methodology 239
Section B: Base Scenario 243
Section C: Beyond the Base Scenario 247
Section D: Outcomes for different groups 253
Conclusion 262
CHAPTER NINE: CONCLUSION 265
Introduction 265
Section A: Lessons from the Empirical Evidence 265
Section B: Research-based Conclusions 278
Section C: Lessons for UK Pension Policy 284
APPENDICES 291
Appendix A- Bibliography 291
Appendix B- Relevant questions from the Family Resources Survey 1994/5 302
List of Tables
Table 1.1: The Pensioner Income Distribution 1995/6 at 1995 prices Table 1.2: Composition of Pensioner Incomes
Table 1.3: Distribution of Estimated Wealth in the UK 1986/7 (Estate Data) Table 1.4: Wealth by age band
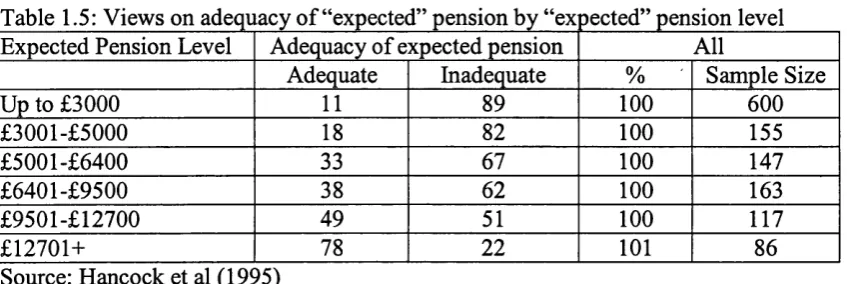
Table 1.5: Views on adequacy of “expected” pension by “expected” pension level Table 1.6: Compulsory contribution rates in pension proposals
Table 2.1: Linkage between thematic and empirical questions Table 2.2: Composition of those with two or more jobs
Table 2.3: Characteristics of groups with and without a payslip
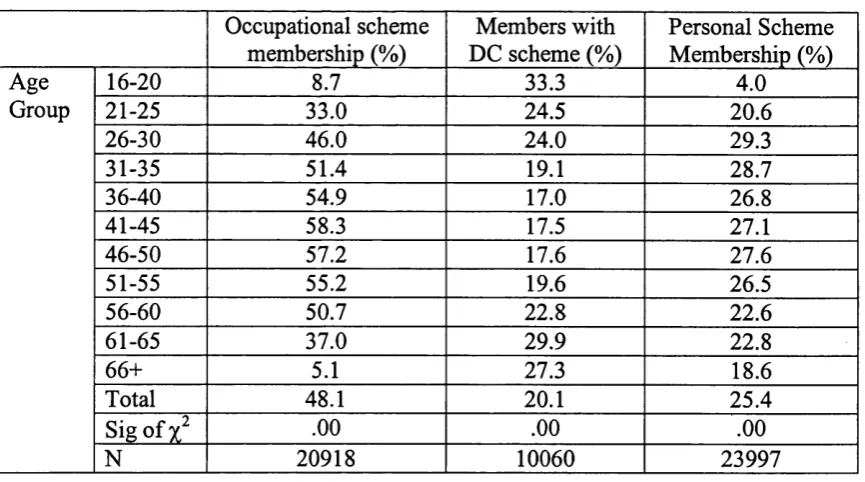
Table 2.4: Characteristics of occupational pension members as a percentage o f sample Table 2.5: Characteristics of personal pension members as a percentage of sample Table 3.1: Private pension coverage and type
Table 3.2: Current and past occupational scheme membership Table 3.3: Private pension coverage by income and pension type Table 3.4: Private pension coverage by sex and scheme type
Table 3.5: Private pension coverage by employment status and scheme type Table 3.6: Private pension coverage by age and scheme type
Table 3.7: Private pension coverage by age, sex and scheme type Table 3.8: Private pension coverage by marital status and scheme type Table 3.9: Private pension coverage by marital status, sex and scheme type Table 3.10: Private pension coverage by housing status and scheme type
Table 3.11: Private pension coverage by household composition and scheme type Table 3.12: Private pension coverage by number o f children in household and scheme type
Table 3.13: Private pension coverage for households with children Table 3.14: Variable coding for logistic regressions
Table 3.15: Logistic regression: occupational pension coverage
Table 3.16: Logistic regression: occupational pension coverage (variables with no explanatory power removed)
Table 3.17: Logistic regression: personal pension coverage
Table 4.1: Additional contribution payment by scheme type
Table 4.2: Additional contribution patterns o f personal pension members
Table 4.3: Percentages paying additional contributions by income level and scheme type Table 4.4: Percentages paying additional contributions by sex and scheme type
Table 4.5: Percentages paying additional contributions by employment status and scheme type
Table 4.6: Percentages paying additional contributions by age and scheme type Table 4.7: Percentages paying additional contributions by age, sex and scheme type Table 4.8: Percentages paying additional contributions by marital status and scheme type
Table 4.9: Percentages paying additional contribution by sex and marital status
Table 4.10: Percentages paying additional contributions by housing status and scheme type
Table 4.11: Percentages paying additional contributions by household composition and scheme type
Table 4.12: Percentages paying additional contributions by number of children in household
Table 4.13: Percentages paying additional contributions in households with children Table 4.14: Variable coding for logistic regressions
Table 4.15: Logistic regression: percentages paying additional contributions (occupational schemes)
Table 4.16: Logistic regression: percentages paying additional contributions to occupational schemes (variables with no explanatory power removed)
Table 4.17: Logistic regression: percentages paying additional contributions (personal schemes)
Table 4.18: Logistic regression: percentages paying additional contributions to personal schemes (variables with no explanatory power removed)
Table 5.1: Scheme contribution by pension type
Table 5.2: Scheme contribution by income level and pension type Table 5.3: Median pension contribution by scheme type and sex
Table 5.4: Contributions to occupational pensions by scheme type and employment status
Table 5.5: Personal pension contribution by occupational status Table 5.6: Scheme contribution by pension type and age
Table 5.8: Scheme contribution by pension type and marital status
Table 5.9: Contributions to occupational pensions by scheme type, marital status and sex
Table 5.10: Scheme contribution by pension type and housing status
Table 5.11: Scheme contributions by the number o f children in household and scheme type
Table 5.12: Contributions to occupational schemes for households with children Table 5.13: Coding of variables for OLS regressions
Table 5.14: Regression of absolute scheme contributions to occupational schemes Table 5.15: Regression of scheme contributions to occupational schemes, as a percentage o f gross income
Table 5.16: Regression of absolute scheme contributions to personal schemes
Table 5.17: Regression o f scheme contributions to personal schemes, as a percentage of gross income
Table 6.1: Overall additional contribution payment to occupational schemes
Table 6.2: Amount of additional contributions by income level (occupational schemes) Table 6.3: Amount of additional contributions by sex (occupational schemes)
Table 6.4: Amount of additional contributions by age group (occupational schemes) Table 6.5: Overall additional contribution payment to personal schemes
Table 6.6: Amount of additional contributions by income level (personal schemes) Table 6.7: Amount of additional contributions by sex (personal schemes)
Table 6.8: Amount of additional contributions by employment status (personal schemes) Table 6.9: Amount of additional contributions by age group (personal schemes)
Table 6.10: Amount of additional contributions by marital status (personal pensions) Table 6.11: Amount of additional contributions by housing status (personal pensions) Table 6.12: Amount of additional contributions by housing status (breakdown)
Table 6.13: Amount o f additional contributions by number o f children in household Table 6.14: Amount of additional contributions paid by households with children Table 6.15: Variable coding for OLS regressions
Table 6.16: Regression of the amount of additional contribution paid to occupational schemes
Table 6.17: Regression of additional contributions to occupational schemes, as a percentage of gross income
Table 6.19: Regression of additional contributions to personal schemes, as a percentage o f gross income
Table 7.1: Whether deposit or share-based investments held, by age group Table 7.2: Financial asset accumulation by housing status
Table 7.3: Share-based investments by income level Table 7.4: Financial asset accumulation by household type Table 7.5: Total savings by deposit and share-based investment Table 7.6: Total savings by gross income level
Table 7.7: Total savings by age group Table 7.8: Total savings by housing status Table 7.9: Total savings by household type
Table 7.10: Financial asset accumulation by council tax band
Table 7.11: Financial asset accumulation by housing status (council tax band D) Table 7.12: Total savings by housing status (council tax band D)
Table 7.13: Financial asset accumulation by age group and pension status Table 7.14: Total savings by age and pension status
Table 7.15: Financial asset accumulation by housing and current pension status Table 7.16: Total savings by housing and pension status
Table 7.17: Share-based asset accumulation by age group, pension and additional contribution status
Table 7.18: Total savings by age group, pension and additional contribution status Table 7.19: Share-based asset accumulation by housing, pension and additional contribution status
Table 7.20: Total savings by housing, pension and additional contribution status Table 7.21: Variable coding for logistic regressions
Table 7.22: Determinants o f high savings level
Table 7.23: Determinants of high savings level (different pension variables) Table 8.1: Annuity rates per £100 000 of pension fund (2/6/00)
Table 8.2: Base case outcomes- DB pension holders (£ per week)
Table 8.3: Mean length o f DB scheme membership by age group and sex Table 8.4: Base case outcomes- DC pensions (£ per week)
Table 8.5: Effect o f inflation on level annuities
Table 8.6: Replacement ratios- DC pensions (base scenario) Table 8.7: Pension outcomes for DB pension holders
Table 8.9: Replacement ratios (assuming a 2% or 6% real rate of return) Table 8.10: Pension outcomes (£ per week) with 30 years’ membership Table 8.11: Replacement ratios (assuming 30 years’ membership) Table 8.12: Pension outcomes (£ per week) with early retirement Table 8.13: Replacement ratios for early retirees
Table 8.14: Pension outcomes (£ per week and replacement ratio) by income level Table 8.15: Pension outcomes (£ per week and replacement ratio) by sex
Table 8.16: Pension outcomes (£ per week and replacement ratio) by employment status Table 8.17: Pension outcomes (£ per week and replacement ratio) by marital status Table 8.18: Pension outcomes (£ per week and replacement ratio) by housing status Table 8.19: Pension outcomes (£ per week and replacement ratio) by number of children in household
List of Figures
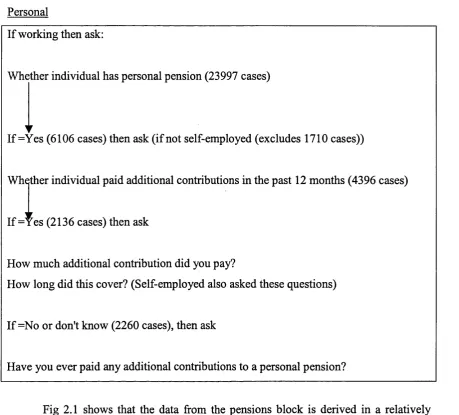
Figure 1.1: UK Pension system pre-1997 Figure 1.2: UK Pension system after reform Figure 2.1: Derivation of sample in pension block
Acknowledgements
No man is an island, and certainly no Ph.D. student can claim to be. Many people have helped me during the course o f this thesis; without their aid my research would have been less effective, and also less enjoyable.
The first person to thank is my supervisor, Professor David Piachaud. David has displayed a willingness to discuss pensions in general and my research in particular, that goes above and beyond the call o f duty. He has proved to be an extremely good supervisor, returning all written material quickly, and being entirely fair with both criticism and praise.
There are many other people to thank amongst staff members at the LSE. Essential support has been provided by successive Ph.D. course administrators, Barbara Wesley and Alison Johnston. During my thesis, the Departmental Research tutors, Professor Howard Glennerster and Professor Julian Le Grand, have ensured that the department is a welcoming environment for research students. Many thanks must also go to Professor John Hills whose classes persuaded me to transfer from Economics to Social Policy in the first instance. The trustees o f the Titmuss Fund must be thanked for awarding me two Titmuss Memorial Scholarships.
It is also important to acknowledge the contribution of the ESRC, who allowed me access to the Family Resources Survey through the on-line data archive at the University of Manchester. Special thanks go to Nina Bullen and Jo Lampard o f Midas for dealing with my confused enquiries, and helping me to download my data in the correct format.
I doubt that I would have survived the past four years without the support and encouragement provided by fellow Ph.D. students in the LSE Social Policy department. They have carried me through the highs and lows that are an inevitable part of writing a Ph.D. thesis. Special thanks go to Lee Hatfield, Carine Clert, Monique Mrazek, Andreas Hoff, Salma Shawa, Yuki Kobayashi and Ruth Kattumuri for their encouragement through the years.
Introduction
There are potentially many ways for individuals to maintain their way o f life in their later years. They can keep working, or seek support from other family members in an extended family arrangement. However, in the Western world, and increasingly in developing countries, financial means, and especially pensions, form the basis of support in old age. Pension provision affects all o f us, whether through taxes or contributions in the build-up phase, or payments that we receive in later life. The decisions we take now, whether personally as individuals or collectively through government or employers will not only affect our living standards, but those o f others in the decades to come.
Pensions are an important issue now but it can be expected that they will become even more important in the future. This is due in part to demography, where there are two major factors at work. The first is increased life expectancy which in turn means an increase in the expected time that will be spent in retirement if the retirement age remains at the present level. The second factor is the declining birth rate which when coupled with the increase in life expectancy means that the population is ageing. There is a third, non-demographic factor at work. The current trend towards early retirement also means that workers have a shorter time in which to accrue pension rights, though this trend may be reversed in future as a response to the two demographic effects.
The consequences of these factors are that there will be proportionately less workers to pensioners in the future. This has led to the notions o f a “demographic timebomb” and a “pensions crisis” in which the working population will be overwhelmed by the claims emanating from the pensioner population. This view has been championed by the World Bank in the influential book “Averting the Old Age Crisis”(James 1994). It makes the broad assertion that: "Today, as the world's population ages, old age security systems are in trouble worldwide.... And formal programs are beset by escalating costs that require high tax rates and deter private sector growth- while failing to protect the old" (pi). It puts forward a generic blueprint of pension provision that envisages a cutback in pay-as-you-go state programmes and an increased role for the private sector, citing Chile as its model. This generic blueprint takes little account of local circumstances.
in the UK we have not followed the European route of a high-level eamings-related state-run pay-as-you-go pension system. Instead we face a policy environment where although total spending is rising, state provision to each individual has been decreasing for the past twenty years. The basic state pension, the bedrock o f retirement income, has been indexed to prices since 1980, while the State Eamings-Related Pension Scheme (SERPS) was cut back in 1986 and 1995. This means that state provision in the UK is not as vulnerable as other countries to changes in demography. However, the gradual decrease in the level of state provision means that the importance o f private provision is rising.
Pension policy in the United Kingdom is based on the Beveridge (1942) principle that it is the role o f the state to provide a national minimum, and that anything beyond this is to be provided by individual action. As a result, the private provision that people make is extremely important in avoiding a meagre old-age. The UK pension environment is more complicated than in most comparable countries in that there are different forms o f private provision, which tend to attract different levels of contribution. Occupational pensions are the major form o f private provision, but these have been supplemented by personal pensions since the 1986 Social Security Act. If this were not complex enough, a new form o f private pension- “stakeholder pensions” will be launched from April 2001.
In this complex environment, with many ideas for reform being put forward, it is very important to examine current behaviour in all forms o f private pensions. This entails examining current pension coverage, but also analysing the contributions that are being made. Private pension coverage has been looked at in a very broad sense, with a concentration on overall coverage, or a comparison between coverage levels for men and women. However this does not provide a real understanding of the area. In order to do this, it is necessary to delve deeper by analysing coverage with respect to a number of parameters, and to compare patterns between occupational and personal pension coverage.
The issue of pension contributions is an under-researched, though vital area for analysis in pension policy given the UK pension environment. Pension contributions can be paid automatically as a result o f scheme membership, as is usually the case with occupational pension schemes. They can also be made on a voluntary basis. There has been little analysis o f these voluntary contributions in terms o f which groups in society are most likely to make them, and how much is being paid. If policy is to be based on the Beveridge model, voluntary contributions will become a more important area in the future as people seek an income above a basic minimum.
As we shall see, there is no clear consensus on whether and to what extent, people should be forced to make compulsory pension provision.
The data source to be used in this thesis is the Family Resources Survey 1994/5. This is a relatively new dataset designed to complement and extend the Family Expenditure Survey. The Family Resources Survey is used because it provides much new information on the disparate elements o f pension accumulation. This includes the percentage paying, and the amount of additional contributions, as well as private pension coverage. Its major strength is the large sample size, which facilitates statistical analysis. The statistical analysis uses cross-tables as well as more specialised regression-based tools to provide a more in-depth analysis of pension accumulation behaviour.
Chapter One: Pension Policy and Behaviour in the UK
Introduction
As a foundation for one’s own research in pensions, it is important to analyse current and past material. There has been a vast amount written on the subject of pensions. In pulling the most important o f this research together, we can begin to understand the current policy environment, its underlying assumptions and from this begin to see the areas which need further exploration.
The plan o f this chapter is as follows. Section A summarises perspectives on the function, economic rationale and macroeconomic effects o f pensions. Section B shifts the focus to the UK pension system. It examines the underlying assumptions, the institutional framework both private and public, and its distributional consequences. Section C details the current material position o f UK pensioners, both in terms of income and assets. Section D focuses on private pension behaviour in the UK over recent years, summarising trends, contribution levels and questions the quality o f some decisions made. Section E highlights this by focusing on information and attitudes; it examines the adequacy o f information that people have about the UK pension system. It also analyses attitudinal data on the adequacy o f expected pension levels and willingness to pay extra contributions. Section F reviews the many recent pension proposals, searching for their underlying assumptions and examining how they tackle the issues raised in earlier sections.
Section A: Function, Economic Rationale and Effects of Pensions
Introduction
scheme, pension contributions are invested in a variety o f capital assets. When the individual retires, the accumulated fund is usually converted into a stream o f income. Funded pensions are therefore paid from the return on capital (Disney 1996). Pay-as- you-go (PAYG) schemes are contractarian in nature, with those at work transferring goods produced to retirees. PAYG schemes are paid via a tax on labour. PAYG and funding are different methods o f achieving the same end; in both cases pensions are paid out of future output.
PAYG schemes are usually run by the state, based on the fact that the state has no need to build up a fund in anticipation of future claims, but can tax the working population. Most private schemes operate on a funded basis. Two particular forms of funded scheme should be distinguished. In Defined Benefit (DB) schemes, benefits are determined by some formula based on salary (often final salary), and length o f service. Others operate on a Defined Contribution (DC) basis, with the accrued pension being determined by the amount of contributions paid into a fund and the investment return that it earns.
Role of Pensions
Ghilarducci (1992) sets out three major paradigms for the development of private pensions. Firstly there is the neo-classical perspective. This places individuals at centre stage; neo-classicists look to individual workers, and their desires as the initiators of pension contracts. Firms provide pensions rather than fire superannuated workers to maintain a good reputation; they also provide pensions for technical reasons. As workers learn on the job they gather firm-specific skills and become more valuable over time. Firms therefore have an incentive to provide DB pensions that increase with a worker’s length o f service. There is also the “shirking effect”; the possibility o f losing one’s pension as well as one’s job increases the disincentive to shirk (Lazear 1980).
It is clear that the neo-classical perspective can explain DB pensions but at first sight it struggles with DC pensions which do not increase with length o f service. However, both DC occupational and personal pensions can be seen as fitting in with workers’ desires for greater individual control over lifetime consumption. Personal pensions in particular, “free” workers from control by the firm. That firms gain little from personal pensions is illustrated by the fact that employees’ personal pensions are less likely to gain a contribution from the employer, as shall be seen later.
The Marxist perspective states that employer objectives in industrial relations are to lower labour costs and maintain control over production. Pensions can serve in this process by fostering paternalism. They also serve to divide the workforce by pitting older workers against younger workers. These workers may resent their contributions to another group. The existence of private pensions also blunts support for expanding social security and creates a habitual way o f dividing the two classes (Stevens 1988). This approach does seem to struggle with DC pensions as they imply less control over production. However DC pensions are compatible if they reduce labour costs through lower employer contribution rates.
The institutionalist perspective situates pensions within an evolutionary process. Some institutionalists follow a “feudalist” model (Ross 1958). A feudalistic system describes a combination o f relationships and motives among employers, workers and the community. Employers have an entrenched relationship with the community and have many responsibilities, one of which is to maintain productivity and profitability over a long time. As we shall see later, there is a drift towards DC pensions, both occupational and personal. This could perhaps be incorporated in an institutionalist framework, as employees are less tied to a single employer or community. The other view is that employers are less entrenched within a community and feel less responsibility towards their workforce.
Economic Efficiency
relate this to pensions, in a perfectly competitive marketplace with no market failures, the decision of a perfectly informed individual as to how much pension provision to make is optimal. Any government intervention serves to decrease personal welfare. Given that this is the case, it is important to analyse why governments do interfere in the individual’s pension decision.
The first argument in favour o f government intervention is that individuals are not perfectly informed. To choose an appropriate pension scheme, a worker would have to evaluate such issues as lifetime consumption needs, inflation probabilities facing the economy as a whole and the expected returns from alternate plans, including the likelihood that the scheme would be financially viable in the future (James 1996). Barr notes that the efficiency advantages o f perfect competition are contingent on perfect information but believes that information could be acquired through a broker. We shall see later, that this is not a trouble-free solution. James (1996) suggests that governments can improve the flow o f information by imposing disclosure requirements and running education campaigns. Paternalistic involvement to mandate certain actions and limit choice can be justified if one believes that many people will be unable to digest and utilise the information available.
Intervention can also be justified if people are myopic, having a short-term preference structure and thus not giving adequate consideration to future needs. Le Grand (1995) uses Parfit’s (1984) argument that a future self is a “separate” person who is affected directly by present decisions in the market. A government could justify over riding present individuals’ preferences on the democratic grounds that future selves have as much right to be represented as present selves.
Another argument for intervention is the need to overcome market failure based on the free-rider problem. If individuals know that society will not allow them to die of starvation due to failure to make provision for their old age, they may not be inclined to save voluntarily, which in turn imposes costs on others. It is important to note that state intervention to overcome free-riding does not automatically mean a compulsory state scheme, individuals could be forced to invest in private schemes.
It might be good for someone for someone earning £50,000 per year to have a pension of £33,000 because it allows them to maintain a similar lifestyle, but this individual would not be a
burden to the rest o f us if they only managed a pension o f £20,000. (p6)
In other words, there is a difference between compelling the individual to achieve a minimum level of pension which prevents them from being a burden to others, and compelling them to achieve a level o f pension directly linked to their working income. The former can be justified directly by economic theory, the latter requires a knowledge o f individual preferences that is impossible to achieve. Paternalistic intervention mandating individuals to save for a level o f pension above a minimum can lead to inefficient outcomes where individuals are “over-annuitised”, forced to transfer more consumption over time than they would wish. On the other hand, it could provide the level o f pension which Parfit’s “future selves” would wish if they were given a choice.
Macroeconomic Effects
Two major issues predominate when looking at the macroeconomic effects o f pensions: the effect of PAYG on savings and output growth, and the effects o f pensions on labour supply.
It is often regarded as self-evident that savings and therefore economic growth will be higher with funding than under PAYG; to quote Taveme (1995), “Further advantages of privately funded schemes are their effect on labour costs, savings and investment and the liquidity of capital markets”(pl7). It is important to qualify this; savings could only be higher in the build-up phase since in the long-run steady-state there would be no difference between the two methods o f funding. Even if the savings rate is higher in the build-up phase under funding, there is no guarantee that this will automatically boost economic growth (Barr 1993).
reduce savings. He demonstrated that if the lifecycle model is extended with altruistic bequests, savings might not be affected at all.
Analysis of the empirical evidence does not clarify the position. Feldstein’s original empirical work was criticised; additional variables tended to destroy the significance of the savings result (Barr 1993) and it was later discovered that his data contained a programming error which affected the result (Leimer and Lesnoy 1982). When Leimer and Lemoy used Feldstein’s data but with more accurate definition of social security wealth they found that his results were very sensitive to even small changes in the starting year (MacKenzie et al 1997). A later survey (Leimer and Richardson 1992) suggests that over half o f savings reductions attributable to social security are actually efficiency gains, as pensions satisfy a need that imperfect annuity markets cannot.
Magnussen (1994) has carried out a survey of the many completed studies. Time series analyses o f the type originally carried out by Feldstein are increasingly not proving a link between PAYG pensions and a drop in the level o f saving. Magnussen finds that results are dependant on econometric specification, the estimation period and how data are constructed. Cross-country analyses usually analyse data from several countries over a period o f at least five years. Studies carried out by Feldstein (1977,1980) find a link, while all the other studies do not. Cross-sectional analyses usually investigate the association between accumulated assets and measures o f social security wealth, income from work and other variables for an appropriate group. These studies have proved more likely to find an association, but their concentration on specific age groups reveal less evidence o f aggregate behaviour. Aaron (1982) has concluded that a person determined to find a respected theoretical argument to support a preconception will find one, and that the open mind faces a bewildering diversity of answers. This is perhaps the only sensible conclusion to draw from analysis o f this area.
The impact o f future pension benefits is harder to analyse as they can be affected by legislation and individual decision-making about the probability of receiving these benefits. As a result, modelling the effect of pensions on labour supply is complex. Some studies conclude that pensions reduce labour supply (Diamond and Hausmann 1984) while others argue that pensions have little or no effect (Hamermesh 1984). Much o f the confusion can be explained by differences in model specification (Barr1993). Thompson (1998) states that it is difficult to know what to make o f the debate over the impact o f pensions on labour supply because o f the failure to address the issue of what the effect is supposed to be. To criticise pension programmes on the grounds that they may cause people to retire earlier than they would have done otherwise is pointless, as that is why they were created. Barr (1998) points out that if pensions, whether public or private, induce retirement at too early an age the solution is simply to raise the retirement age.
Section B: The UK Pension System: Structure and Effects
The Pension system in the UK - pre 1997
In order to understand the structure o f the UK pension system, it is necessary to recognise the value system behind it. Beveridge (1942) set out the role o f the state as providing a minimum living standard in retirement through compulsory social insurance, (the basic pension). He envisaged second-pension provision as being completely voluntary, but:
direct encouragement of voluntary insurance or saving to meet abnormal needs or to maintain standards of comfort above subsistence level is an essential part of the plan for Social Security proposed in this report. (paragraph 239)
automatically a member of SERPS. At any point in time the individual (in theory at least) has a choice of second pension provision (see Figure 1).
Figure 1.1: UK pension system pre-1997
STATE OCCUPATIONAL PERSONAL
BASIC PENSION
Source: Atkinson 1994
As we can see, the first tier of the UK system is the contributory basic pension. To receive full benefit, pensioners should have paid National Insurance Contributions (NICs) for around nine-tenths o f their working life. The severity of this test is reduced by a number of provisions, most notably for those out of the labour market to care for children or sick relatives. The basic pension is thus constructed on paternalist lines, with the state ensuring that all qualifying individuals have at least this income level for their retirement years whether or not they would have chosen to allocate consumption in this way.
A large number of pensioners also receive some form of means-tested benefit. 1.8 million were in receipt of income support in August 1996, reflecting the relative levels of the basic pension and the state’s means-tested minimum income, (for a single person aged under 75, the latter is worth 12% more than the former) (Pension Provision Group 1998). In addition to this, 1.9 million pensioner households are receiving housing benefit (Pension Provision Group 1998). Since 1980 the basic pension has been indexed to prices. As the rate of average earnings growth has exceeded the growth o f prices the value of the basic pension has fallen. If average earnings grow by 2% per year, the value o f the basic pension will fall to 7.5% of average male earnings by 2030 (Hills 1993).
[image:27.595.127.485.168.263.2]assumptions, the number o f pensioners receiving means-tested assistance would have been reduced substantially.
The 1986 Social Security Act scaled down the SERPS accrual formula to 20% of earnings averaged over a lifetime, not the twenty best years. SERPS was reduced further in the 1995 Pensions Act through a complex formula change. This formula change had retrospective application and so damages currently held expectations. Johnson and Falkingham (1993) note that the constantly changing state scheme has made it difficult to formulate coherent expectations.
To avoid duplication of provision, DB occupational schemes have always been permitted to contract-out o f SERPS. To do this pre-1995, it was necessary to show that the minimum pension to be paid out, the Guaranteed Minimum Pension (GMP) would at least equal the amount that the same earnings would have produced in SERPS (Brown 1990). This requirement was scrapped in the 1995 Pensions Act; schemes now only have to demonstrate broad equivalence to a “reference scheme” (LRD 1996)
The 1986 Social Security Act allowed DC occupational and personal pension schemes to opt out o f SERPS on the basis o f a guaranteed minimum level of contributions. This guaranteed minimum contribution was the rebate o f NICs from SERPS, called the contracted-out rebate (COR). A reason for the difference in treatment between DB and DC private pensions is that DC pensions are perceived as "riskier”. DC pensions have two sources o f uncertainty. One source is that capital market risk is borne by the plan holder, the second risk relates to the uncertain state of the annuity market at the time o f retirement. As a result there is no guarantee of a specified pension at retirement. However it must be pointed out that there is no guarantee o f a specified pension at retirement with DB plans due to risks concerning length o f service. As Johnson and Falkingham (1993) correctly state, both routes are lotteries.
The 1995 Pensions Act replaced the flat-rate COR (formerly 4.8%) with age- related rebates. The flat-rate COR was worth more to younger cohorts as their contributions have more time to compound. Age-related rebates were designed to make contracting-out of SERPS attractive throughout the age range. A 9% cap was introduced for personal pensions, but was not expected to affect many people as the SERPS reforms meant that the age-related rebates would not need to be as high. Lower rebates are payable for DC occupational schemes due to their lower administration costs. Roll (1995) notes concern that the government is subsidising higher cost personal pensions.
pension contributions above this level, available in occupational and personal schemes (not SERPS), were seen a matter for the individual and the firm concerned.
Partnership in Pensions
In December 1998, the government published its Green Paper on Pensions entitled: "A new contract for welfare: partnership in pensions". It is important to analyse this in some detail because it provides the assumptions that will be analysed in the research that follows.
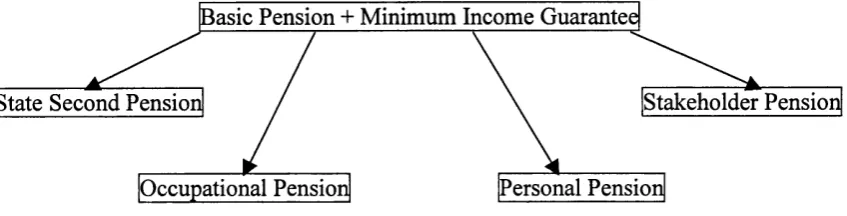
The Green Paper identified problems with the current system and outlined the proposed reforms, which significantly change the structure of the UK pension system. The new system aims to create a "New Insurance Contract"(DSS 1998b p i) with the public whereby those who can save for their retirement have the responsibility to do so, while the state will provide for those who cannot. The aim appears to be for the state to establish a national minimum, but for the state to only provide this minimum itself to low earners and carers. Those earning above £9000 will reach this minimum through other means. This translates into practice through the following structure.
Figure 1.2: UK Pension system after reform
Personal Pension
Stakeholder Pension
Occupational Pension State Second Pension
Basic Pension + Minimum Income Guarantee
The first-tier still consists of the basic pension, but is supplemented by a minimum income guarantee at greater than income support levels. The second tier consists of a new "State Second Pension" which replaces SERPS, occupational and personal pensions as before, plus the new choice of a "stakeholder pension".
The next step is to analyse the new structure in more detail, starting with the first tier. The basic pension is to be retained and will remain indexed to prices. This is insufficient to provide an adequate minimum income in retirement and would lead,
[image:29.595.75.499.498.606.2]pension is to be supplemented by a Minimum Income Guarantee (MIG). Rake, Falkingham and Evans (1999) point out that the MIG is in effect a new name for income support, and that to call it a guarantee is misleading, as it requires people to take it up.
There are four potential problems with the MIG: the level o f the guarantee, its indexation, making sure that all those eligible claim it, and its effect on incentives. The MIG will be set at £75 for a single person and £116.60 for a couple from April 1999, with increases for older pensioners. It is questionable whether this is sufficient as a minimum income for retirement. As to indexation, the Green Paper states that the MIG: “will be increased year by year as resources allow. Over the long term it is our aim that it should rise in line with earnings so that all pensioners can share in the rising prosperity o f the nation”(p34). This does not seem to be a cast iron commitment to yearly earnings indexation. The third difficulty is making sure that all those entitled to claim the MIG do so. The immediate approach being advocated in the Green Paper is to stress that it is an entitlement and also to streamline the claiming process. In the long term the plan is to make receipt o f the MIG “more automatic”(p36). It is not made clear how this is to be done. Schemes that have proposed a MIG like Atkinson’s (1994) idea have suggested that this can only be done through compulsory assessment by the Inland Revenue at 65. This would not be popular. The final potential problem with the MIG is the fact that it is means-tested and thus would tend to penalise those with savings and provide a moral hazard to people making pension provision for their retirement. This problem is exacerbated by the fact that the basic pension is indexed to prices, while the MIG is indexed to earnings. This means that year by year, the amount of second pension income needed to bridge the gap between the basic pension and MIG will rise.
However, it is not the government's aim that the poorest will attain the minimum income in retirement through the MIG. Instead, it is intended that the minimum is to be obtained through the State Second Pension (SSP), which is to replace SERPS. SERPS is to be abolished because, as it is eamings-related, it gives least help to those in need. Agulnik (1999) indicates that this criticism misses the point o f SERPS, which was to protect individuals' accustomed living standards, not to meet a minimum income objective. The SSP proposals are laid out as follows:
• SSP will accrue at double the value of SERPS on earnings up to £9000 per year (40% over a full working life).
• The rate on the earnings band £9000 to £18500 would be 10 per cent. • The rate on the band £18500 to the UEL would be 20 per cent.
• Disabled people and carers (of children up to primary school age or the elderly) will be credited into the SSP as if they had earnings of £9000 per year.
The important question to ask is whether the combination of the basic pension and the SSP will exceed the level of the MIG in retirement. The Green Paper insists that it will. The estimated impact in 2050 is that for someone earning up to £9000 per year, the SSP and basic pension will provide a maximum state pension income o f £82 in eamings-equivalent terms, compared to £75 for the MPG (DSS 1998b). An important point to note is that the SSP is calculated on an individual basis, while the MPG is worked out on a household basis. Couples who both earn under £9000 during their whole working life will receive £164 in state pensions compared to £116.60 in the MPG.
These statistics are hotly disputed by Rake et al (1999) who estimate that the combination o f SSP and basic pension in 2050 will produce a maximum income equivalent o f £76, only £1 above the level of the MIG. Rake et al (ibid) offer the opinion that the SSP is "nothing more than a targeted flat-rate top-up to an inadequate basic pension (p5)". They go on to argue that this is perhaps an over-generous assessment o f the new system because, due to the indexation o f the basic pension and SSP by prices, the value o f these contributory benefits would fall below that o f the eamings-linked MIG within five years. Rake et al note that low earners who are in couples are relatively protected against claiming MIG, but argue that for a government to rely on this is a high-risk strategy when faced with rising divorce rates.
A more fundamental problem with the new system is that as a way o f avoiding means-testing, it only works for the cohort o f pensioners retiring in 2050. For the cohort o f pensioners retiring in 2060, the level o f the basic pension plus the SSP will already be below that o f the MIG (Rake et al 1999). Cohorts of pensioners retiring before 2050 will face the problem that SSP accrual rates will not apply retrospectively (Disney et al 1999a). This means that people retiring until the middle o f the 21st century will have part o f their secondary state pension accrued at SERPS rates (which offers less to low earners). As a result, the efficacy of the government’s proposals for low earners seems extremely questionable.
this refers to most people in the band, or all. It is clear at first that middle-income earners will have the choice as to whether to stay in the SSP or not. It is important to note that the SSP will be far more generous than at present. For a worker earning £12000 per year, SSP will accrue at the rate of 3900/12000= 33% o f lifetime earnings. Agulnik (1999) points out that the point at which people would start losing from the reduction in rebates on earnings above £9000 a year is £20000 not £18500, so all individuals gain from the new rebate structure.
Occupational and personal pensions are to remain, and are to be supplemented by “stakeholder” pensions. These are intended to allow middle income earners to save for retirement through a secure, flexible and value for money vehicle which promises with a clear and low charging structure, transferability between schemes, and variation o f contribution levels without penalty. Stakeholder pensions are especially to be targeted on those middle-income earners without access to an occupational scheme.
The Green Paper does state that when “stakeholder” pensions have established themselves: “we expect the new State Second Pension to become a flat-rate scheme for those on lower earnings, with those on moderate and higher earnings joining a funded pension” (DSS 1998b p40). Disney et al (1999a) consider the transition to this second stage will prove politically difficult, as it creates a large group o f people (earning between £9000 and £18500) who will be worse off under SSP Mark Two than SSP Mark One. They also question whether there is a suitable constituency for the Stakeholder pension. Their analysis o f British Household Panel Survey data over a four- year period reveals middle-income earners without a private pension tend to have fluctuating earnings. This group may be better off under the SSP than a stakeholder pension unless the government contributes to their pension fund as an alternative to credits for the SSP.
Distributional Effects of the UK Pension System
A number o f studies have analysed the distributional effects o f the UK pension system. A degree o f progressivity is built into the state apparatus, via the two-tier formula of a flat-rate pension plus an eamings-related component (Creedy 1982; Creedy and Disney 1985). However most o f the distributional effect of the state system is within the lifecycle. Falkingham and Johnson (1995) found that on average, individuals effectively pay for 61% of their pension benefit received.
Distributional effects vary for men and women. When Creedy (1982) analysed the effects o f a two-tier system analogous to the UK at that time, he found that the pension-contribution ratio for men was insignificantly progressive. Only the combination o f a pure eamings-related contribution and a flat-rate pension unambiguously reduces the inequality o f the male income distribution.
SERPS does have a redistributive capacity, from men to women. Hemmings and Kay (1982) found that under the initial formula, women would receive about six times as much benefit per pound of contribution as men. The 1986 and 1995 changes to SERPS lessen this redistribution. Falkingham and Rake (1999) also make the important point that the earnings requirement (the LEL), which operates for the basic pension and SERPS/ SSP, operates against the interests o f women. No SSP coverage is offered to those who earn less than the LEL, the vast majority of whom would be women.
There are also intergenerational effects. Disney and Whitehouse (1993) showed that real rates o f return from the system were generally negative for younger cohorts (bom in 1955 and 1960) and barely positive for older cohorts. As Disney (1996) points out, PAYG schemes tend to redistribute to older generations, swamping any intragenerational redistribution.
DB occupational pensions also tend to negate the progressivity o f the state scheme through the use of “integrated formulas”. These deduct the workers’ expected basic pension income from the firm’s pension promise. As the basic pension replaces a higher percentage o f income for lower income than higher income workers, the occupational pension in an integrated formula will do precisely the opposite. DB plans integrate state pension benefits into the calculation o f benefits in over half o f the private-sector plans in the UK (Government Actuary 1991).
DC plans also have distributional effects. As with DB schemes, some DC plans are based on integrated formulas. In addition to this, Ghilarducci (1992) notes the phenomenon of matching employers and employees contributions. To the extent that higher income workers save more, employers contribute more on their behalf. Employers may also tend to contribute more to the pensions o f valued employees (who would tend to earn more). Casey (1993) states that where employers were prepared to pay into employees’ personal pensions, it was generally to retain valued employees. As we shall see, personal pension members receiving an extra employer contribution are a minority. The structure of personal pension administration charges also works against low-income members, who would also tend to be women. Providers typically levy a mixture of flat-rate and contribution-related, one-off and recurring charges. Thus smaller contributions will attract a higher level o f fees due to the greater proportionate impact o f flat-rate and one-off charges.
Section C: Incomes and Assets of Pensioners
Income
Distribution
The levels o f pensioner incomes, their distribution and composition are all vital determinants o f the future policy mix towards pensioners and are a reflection o f past policies.
and 20 per cent in 1995/6 (DSS 1997). However pensioners have not pushed far up the income distribution, 53 per cent of pensioners are in the lowest two-fifths o f the income distribution for the total population (DSS 1997). This state of affairs is mitigated by the fact that pensioners may need less income to attain a given standard o f living due to the absence o f children or mortgage payments.
One feature of pensioner incomes is a high degree o f inequality. In 1995 the mean net weekly income of pensioner units was £150.30 (in July 1995 prices) after housing costs, an increase o f 70% since 1979. The median was just £108.90, an increase o f 58% (DSS 1997). These statistics indicate that the pensioner income distribution has become more unequal, as Table 1.1 illustrates.
Table 1.1: The Pensioner Income Distribution 1995/6 at 1995 prices
Quintile Before Housing Costs After Housing Costs Median Income
(£ per week)
Growth since 1979 (%)
Median Income (£ per week)
Growth since 1979 (%)
1 75.40 38 59.30 29
2 103.70 51 75.80 41
3 131.30 59 108.90 58
4 176.80 61 157.80 69
5 302.40 71 289.60 87
Source: Department of Social Security Pensioners’ Income Series ;L 995/6 (1997)
Since 1979 the top fifth of pensioners have seen their incomes grow by 87 per cent after housing costs, while the income o f the bottom fifth has grown by just 29%. This increase in inequality is likely to continue as the distribution o f earnings for those in work has become more unequal over time. In 1979, mean income after housing costs was 28% above median income. By 1995/6, this gap had increased to 38%(DSS ibid). Incomes o f older pensioners remain lower than the incomes of younger pensioners. Johnson and Stears (1996) find that this can be explained by cohort differences, such as differential access to private pensions. The average income o f 75 year olds today is actually higher than the average income of 65 year olds ten years ago, due to differential mortality amongst pensioners.
As well as examining the level of pensioners' incomes, it is also useful to look at its composition to analyse changes over time. The composition of pensioners'1 incomes in 1981 and 1996/7 are shown in Table 1.2 (in July 1996 prices).
• • • 9
Table 1.2: Composition of Pensioner Incomes
1981 1996/7
Recently3 retired
Not recently retired
Recently retired
Not recently retired Mean Gross Income
(of which)
£165 £119 £284 £177
Benefit Income £84 £79 £111 £104
Occupational Pension £28 £19 £80 £44
Investment Income £23 £15 £40 £25
Earnings £28 £6 £51 £4
Other - - £3
-Source: DSS Pensioners' Incomes Series (1998a)
Table 1.2 shows both that the composition of pensioners' incomes has changed radically over the years, and that there are large differences in the income sources o f newly retired and long-retired pensioners. Benefit income has risen between 1981 and 1996/7 despite the freezing in real terms o f the basic pension due to receipts o f SERPS and an increased number o f women claiming the basic pension in their own right. However state pensions have fallen as a share of total income. Investment income has remained fairly constant as a percentage o f pensioner incomes over the period, though this belies a sharp spike in the 1990/1 statistics caused by high interest rates (Dilnot et al 1994). The earnings statistics show that earnings are o f similar importance to the newly retired, perhaps due to the importance of partners still in work. However for the long- retired group, earnings are a shrinking element of total income.
Occupational pensions have become much more important as an income source for pensioners. For recently retired pensioners in 1996/7, the data shows that occupational pensions make up 28 per cent o f mean income. There is wide variation in occupational pension receipt. Pensioners' Incomes Series data for 1995/6 shows that for all pensioner units, the median receipt of occupational pension income is £44 per week, but that the mean is £80 (Pension Provision Group 1998). Thus a good deal o f the increase in the average value of occupational pensions is a result o f rapid growth in the value o f the highest occupational pensions.
1 Pensioner units
2 Sub-totals may not equal due to rounding
Occupational pension receipt is increasingly the signal of a more prosperous old age. In 1979 those pensioners with an occupational pension accounted for much the same proportion o f pensioners in the upper income range as those without, with both groups concentrated around similar income levels. By 1989 occupational pensioners’ incomes were higher and more widely dispersed (JRF Vol 1 1995). It is clear from the DSS Pensioners' Incomes Series data that occupational pensions have continued to grow in importance as a source of income for pensioners. This trend will continue; the Green Paper’s proposals indicate that low earners will receive a minimum income through the state, while middle and higher earners will draw the majority o f their retirement income through a private pension. This means that more than ever, it is important to analyse the private pension arrangements that people are making. Titmuss’s (1955) “two nation” theory o f retirement described a world where those with private pension income had a comfortable retirement, while those without relied on the state-provided minimum. We may be moving towards a more complex position, where quality o f life in retirement depends not only on possession o f a private pension, but possession of the right type of private pension.
Assets
Data on wealth have not been collected to the same extent as information on incomes. This reflects the greater conceptual problems and more sensitive nature of the issues involved. It is useful to draw a distinction between marketable and non- marketable wealth. The category of marketable wealth includes cash, bank accounts, shares, land and houses. Non-marketable wealth includes more borderline items such as private and state pension rights. The distinguishing feature o f non-marketable wealth is that it only conveys the right to income (Royal Commission on the Distribution of Income and Wealth 1977).
response rate. It has also been found that the richest sections of society are less likely to answer questions on wealth (Atkinson and Micklewright 1983).
Taking these reservations into account, the available data do lead to interesting conclusions. The level of marketable wealth as derived from estate-based data is shown in Table 1.3. Bosanquet and Propper (1991) noted the remarkably similar wealth
Table 1.3: Distribution of Estimated Wealth in the UK 1986/7 (Estate data) Marketable Wealth
(Including housing)
Age Group
18-34 35-44 45-54 55-64 65-74 75-84 All
Under £10000 39 16 23 21 20 20 24
£10000-£25000 26 24 20 24 24 24 23
£25001-£40000 18 26 23 21 21 20 20
£40001+ 17 34 34 32 36 36 31
Source: Inland Revenue (cited in Bosanquet and Propper 1991)
distribution after thirty-five with no break in the pattern after retirement. This is surprising even in the absence of dissaving in retirement, as rises in real incomes over time suggest that older pensioners would have lower average assets. The outcome may be an artefact o f the data. Estate data only covers cases where probate is required, so for a couple this would be when the second partner dies. There may also be longer life expectancies for the wealthiest. OPCS survey data indicates that dissaving is more common than saving for older age groups with inequality tending to be reinforced. The poor with few assets tend to run-down their assets while some of the better-off are able to add to theirs (McKay1992).
The more recent approach has involved the use of sample surveys due to the larger sample sizes that can be obtained for younger groups, though it must be noted that Disney et al (1997) have used retirement survey data to analyse financial asset accumulation by the 55+ age group. Banks and Tanner (1999) find through analysis of Financial Resources Survey data that median financial wealth (excluding housing) tends to rise with age, reaching a plateau from the 50-59 age group onwards (see Table 1.4). Mean wealth rises to a peak in the 60-69 age group and then falls off, however even the oldest age groups have wealth above all younger groups up to 50 years old.
Table 1.4: Wealth by Age Band
Age Band Median Financial Wealth (£) Mean Financial Wealth (£)
22-29 100 1746
40-49 850 6202
50-59 1750 10657
60-69 1750 13222
70+ 1750 8505
All 750 7136
Source: Banks and Tanner (1999)
Even though the richest parts of society are under-represented in the Financial Resources Survey, one important finding from Table 1.4 is the low level o f financial wealth, with the median being just £750. The level o f inequality is even more striking, with the mean being almost ten times as high as the median.
Pensions have a significant impact on the overall distribution of wealth. We would expect the basic pension to have a significant equalising effect but Banks and Tanner (1999) show that even occupational pensions reduce wealth inequality despite their less than universal coverage. The wealthiest 50 per cent own 93 per cent of all marketable wealth. However when state and occupational pensions are added this falls to 83 per cent (Inland Revenue Statistics 1998).
Analysis o f marketable wealth in the UK leads to the obvious question, how does the accumulation of pension assets interact with that o f other financial assets? It might be believed that those people without private pension coverage would be more likely to accumulate other forms o f financial assets, although the possession o f other assets may harm entitlement to means-tested benefits. Banks and Tanner (ibid) have analysed the link between pension status, housing position and levels o f financial wealth. They conclude that owner-occupiers and private pension holders have a higher median and mean level of financial wealth. This is an important study, but it must be noted that Banks and Tanner do not differentiate between occupational and personal pension holders. It would be useful to analyse whether holders o f all forms o f private pension are more likely to accumulate financial assets than non-private pension holders.
Section D: Private Pension Coverage and Contributions: Existing Evidence
Overview
schemes (Government Actuary 1986). Many people suffered from the opposite problem, lack o f access to occupational provision. It was common practice for employers to exclude women or specify tighter conditions for their entry (only outlawed in 1978) (Hannah 1986). It remains legal for firms to exclude young workers or insist on a minimum period of service. Prior to the introduction o f SERPS in 1978, excluded groups had no access to second-tier provision; since 1988 they have had the further option o f joining a personal pension scheme.
The widening of the choices available increases the opportunity for individuals to allocate their consumption over time, whether myopically or optimally. Those formerly in occupational schemes can opt for a personal scheme where they can reduce (or increase) their contributions. Disney and Stears (1996) cite anecdotal evidence that people opting-out o f company pension schemes are doing so to avoid paying any positive contribution towards their own retirement. It is not inevitable that an increase in choice leads to individuals being unwilling to undertake pension provision. According to Hannah (1986), the general legal advice earlier this century was that employers could not compel workers to join a pension scheme. Take-up rates varied considerably but were typically around 80% of eligible workers.
Trends in Occupational Pension Coverage and Type
Occupational pension coverage peaked in 1967 at 53% o f employees and has tended to fall slightly since then, currently standing at just 46% of employees (Government Actuary 1999). Data from the General Household Survey between 1988 and 1995 shows that occupational pension scheme membership fell from 64% to 58% o f the workforce amongst men working full-time. There has been little change amongst women working full-time (up from 54% to 55%), but membership amongst women working part-time has doubled from 12% to 24% (Pension Provision Group 1998). Occupational pension coverage is correlated positively to income and peaks for men and women in the 45-54 age category.