Regulation, Employment and Wages
Ghazala Yasmeen A zm at
London School of Economics and Political Science
D issertation subm itted for th e degree D O C T O R O F PH ILO SO PH Y
in th e Field of Economics
UMI Number: U222B59
All rights reserved
INFORMATION TO ALL USERS
The quality of this reproduction is dependent upon the quality of the copy submitted.
In the unlikely event that the author did not send a complete manuscript and there are missing pages, these will be noted. Also, if material had to be removed,
a note will indicate the deletion.
Dissertation Publishing
UMI U222B59
Published by ProQuest LLC 2014. Copyright in the Dissertation held by the Author. Microform Edition © ProQuest LLC.
All rights reserved. This work is protected against unauthorized copying under Title 17, United States Code.
ProQuest LLC
789 East Eisenhower Parkway P.O. Box 1346
< )4£StS
f
UoO.
A b stract
Over the last two decades the institutional structures across the OECD countries have changed dramatically, having a significant impact on labour market performance. This thesis seeks to make four contributions to our understanding of the implications and applications of regulations. This is done in two distinct ways: firstly, to focus on a specific policy change in Chapter 1 and Chapter 2, and secondly, to analyse (more generally) the disparities in policies across the OECD countries, in Chapter 3 and Chapter 4.
Chapter 1 seeks to contribute to the literature on tax credit policies, which have been a popular way to alleviate in-work poverty. The assumption is typically that the incidence is on the claimant workers. However, economic theory suggests no particular reason to believe th at this should be the case. This chapter investigates the incidence of the Working Families’ Tax Credit (WFTC) in the UK introduced in 1999, which unlike similar tax credit policies was paid through the wage packet, increasing the connection between the employer and worker with regard to the tax credit. Using two stage parametric and non- parametric censored regression methods I find compelling evidence to suggest th a t the firm discriminates by cutting the wage of claimant workers relative to similarly skilled non-claimant workers when looking at men and th at there is a spill-over effect onto the wage for both men and women.
Chapter 2 then goes on to look more closely at the acclaimed relationship between tax credits and labour supply. One of the principle aims of the WFTC was to increase the participation of those with low labour market attachment. The literature to date con cludes th at for lone mothers there was approximately a 5% point increase in employment. The differences-in-differences methodology th a t is typically used compare lone mother with single women without children. However, the characteristics of these groups are both observably and unobservably different, such th at the identifying assumption may not be satisfied. I find th at when I control for differential trends between people with and without children, the employment effect of WFTC falls significantly. Moreover, by looking at movements in the hour’s distribution, it is clear that any WFTC effect is solely
Abstract 3
borne on those working full-time (30 hours or more). Another concern is th at I find that the policy did not induce people into the labour market from inactivity.
Chapter 3 seeks to explain why it is th at in some OECD countries the male and female unemployment rates are very similar but in others (notably the ‘Mediterranean’ countries) the female unemployment rate is much higher than the male. The analysis shows that, in countries where there is a large gender gap in unemployment rates, there is a gender gap in both flows from employment into unemployment and from unemployment into employment. Overall it seems that differences in human capital accumulation between men and women interacted with labour market institutions is an important part of the explanation.
Declaration & Statement of Conjoint Work
1. No part o f this thesis has been presented to any other University for any degree, 2. The work presented in the thesis is my own and some parts of the thesis draw on
joint work with my colleagues at the Centre for Economic Performance. 3. The contribution to each chapter is stated below:
% Contributed by Candidate
Introduction 100%
Chapter 1: The Incidence o f an Earned Income Tax Credit: Evaluating the Impact on
Wages in the UK 100%
Chapter 2: Before Leaving the Working Families’ Tax Credit to Lie, Another Look at
Labour Supply 100%
Chapter 3: Gender Gaps in Unemployment Rates in OECD Countries 33%
(With M. Guell & A. Manning)
Chapter 4: Is Privatisation behind the Rise in the Profit Share: A Cross Country Industry
Panel Data Analysis 33%
(With A. Manning & J. Van Reenen)
Conclusion 100%
I certify that this is an accurate statement of the candidate’s (GhazaJa Yasmeen Azmat) contribution to the research described above.
Supervisor’s S i g n a t u r e / 4 / ^ x . Date....i ^ / . . ^
A cknow ledgem ents
I would like to begin by thanking my supervisor Alan Manning for his consistent guidance, support and encouragement. Special thanks also to Richard Blundell, Andrea Ichino and Steve Pischke for many helpful discussions.
I am also grateful to Emmanuel Frot, Maia Guell, Lisa Lynch, Michelle Pellizzari, Barbara Petrongolo, Marcia Schafgans and John Van Reenen for valuable comments. In addition, thanks go to the Economic and Social Research Council for financial support and to the Centre for Economic Performance for providing a stimulating work environment.
Finally, I would like to dedicate my thesis to my Abbu, Mum, Saima, Uzma and Zeeshan. Thanks for always being there for me.
C ontents
A bstract 2
D eclaration 4
A cknow ledgem ents 5
Introduction 13
Part I 18
1 T he Incidence o f an Earned Incom e Tax Credit: Evaluating th e Im pact
on W ages in th e U K 19
1.1 Introduction... 19
1.2 Related L i te r a tu r e ... 23
1.3 Tax Credit Incidence: Theoretical A pproach... 25
1.4 The Working Families’ Tax C r e d i t ... 28
1.5 Empirical Framework ... 29
1.5.1 The role of the National Minimum W a g e :... 32
1.5.2 The "WFTC (LFS)" In d ic a to r:... 32
CONTENTS
1.5.4 Spillover E f f e c t...
1.5.5 Two-Stage Empirical Strategy ...
1.5.6 Standard Error Correction of the Predicted R e g re s s o r...
1.6 D ata & Results ...
1.6.1 Results ...
1.7 Extensions...
1.7.1 Firm S i z e ...
1.7.2 Endogeneity of the W FTC V a r ia b le ...
1.8 Discussion & Policy Im p lica tio n s...
1.9 Conclusion ...
1.10 B ib lio g ra p h y ... ...
1.11 Tables and Figure ...
1.12 Appendix l.A: Proofs for Section 1 .1 .3 ... 1.12.1 Proof 1 ...
1.12.2 Proof 2: P ro p o sitio n ...
1.13 Appendix l.B: Additional Tables & F ig u r e s ...
2 B efore Leaving th e W orking Fam ilies’ Tax Credit To Lie, A nother Look at Labour Supply
2.1 Introduction...
2.2 The Structure of the WFTC R e f o rm ...
2.3 Difference-in-difference E s tim a tio n ...
2.3.1 The Treatment Group: Lone M o th e r s ... 7
35
35
42
42
44
46
46
47
50
51
51
55
69
69
70
75
77
77
80
81
CONTENTS 8
2.3.2 The Control Group: Single Women without C hildren... 83
2.4 D a t a ... 84
2.5 Evaluation I ... 85
2.5.1 Basic A n a ly s is ... 85
2.5.2 Controlling for Differential T r e n d s ... 87
2.5.3 Hours Distribution E f f e c t ... 88
2.6 Evaluation I I ... 89
2.6.1 Changes in Coefficients over t im e ... 89
2.6.2 Hours of W o r k ... 90
2.6.3 Labour Market S t a t e s ... 91
2.7 Why did the Child Coefficient In c re a s e ? ... 92
2.8 Conclusion ... 95
2.9 Bibliography ... 95
2.10 Tables and Figure ... 98
2.11 Appendix 2.A: Additional Tables & F ig u r e s ... 119
Part II 131 3 G ender Gaps In U nem ploym ent R ates in OECD C ountries. 132 3.1 Introduction... 132
3.2 Explanations of the Gender Gap in Unemployment R a t e s ... 134
3.3 Variations in the Gender Gap in Unemployment R a t e s ... 136
‘ 3.4 Gender Gaps in Labour Market D ynam ics... 139
CONTENTS 9
3.6 Flows from Unemployment to Employment: The Behaviour of Workers . . 145
3.7 Flows from Unemployment to Employment: The Behaviour of Employers 147 3.8 M ism a tc h ... 150
3.9 Conclusion ... 150
3.10 Bibliography ... 151
3.11 Tables and F ig u r e s ... 154
4 Is Privatisation B ehind th e R ise in th e Profit Share? A Cross Country Industry Panel D ata A nalysis. 173 4.1 Introduction... 173
4.2 Basic M o d el... 176
4.3 Econometric M o d e ls ... 182
4.4 D a t a ... 183
4.4.1 General T re n d s ... 183
4.4.2 Data Sources... 184
4.5 R esults... 186
4.5.1 Main R e s u lts ... 186
4.5.2 Instrumental Variable R esu lts... 188
4.5.3 R o b u stn e s s ... 189
4.5.4 Quantification ... 189
4.6 Conclusion ... 190
4.7 Bibliography ... 191
4.8 Tables and Figure ... 195
CONTENTS 10
4.9.1 OECD Regulation D atabase... 209
4.9.2 Sociopolitical A t t i t u d e s ... 210
4.9.3 Labour Market R eg u latio n s... 211
4.9.4 Other D a t a ...211
4.10 Appendix 4.B: Additional Tables & F ig u r e s ...213
List of Figures
Figure 1.1: FC/WFTC recipients by family type 64
Figure 1.2: Average FC/WFTC awarded by family type 64
Figure 1.3: Distortion between actual and predicted wages (after NMW) 65
Figure 1.4: Spillover effect 65
Figure 1.5: Fraction claiming WFTC by predicted wage 66
Figure 1.6: Average WFTC rate by hourly predicted wage 66
Figure 1.7: Fraction eligible for WFTC by predicted hourly wage 67
Figure 1.8: Fraction o f recipients earning brackets (all cases) 67
Figure 1.9: Fraction o f recipients earning brackets (lone parents) 68
Figure 2.1: Average income by family type 108
Figure 2.2: Cross-country lone parent employment rates 108
Figure 2.3: Employment rates o f single childless women and lone mothers 109
Figure 2.4: Basic tax rates 109
Figure 2.5a: Hours distribution (lone mothers) 110
Figure 2.5b: Hours distribution (single childless women) 111
Figure 2.6a: Proportion working 0-15 hours 111
Figure 2.6b: Proportion working 16-29 hours 112
Figure 2.6c: Proportion working 30+ hours 112
Figure 2.7: Generosity change from FC to WFTC 113
Figure 2.8: Budget constraint for lone parents 113
Figure 2.9: Employment rates for lone mothers 114
Figure 2.10: Child marginal effect (employment) 114
Figure 2.11: Age o f youngest child marginal effect (employment) 115
Figure 2.12: Number o f children marginal effect (employment) 115
Figure 2.13: Highest qualification marginal effect (employment) 116
Figure 2.14a: Child marginal effect (working 0-15 hours) 116
Figure 2.14b: Child marginal effect (working 16-29 hours) 117
Figure 2 .14c: Child marginal effect (working 30+ hours) 117
Figure 2.15a: Child marginal effect (unemployment) 118
Figure 2.15b: Child marginal effect (inactivity) 118
Figure 3.1: Unemployment rates by gender 169
Figure 3.2: Gender gaps in unemployment rates and reservation wage/wage ratios 170
Figure 3.3: Gender gaps in unemployment rates and in wages 171
Figure 3.4: Prejudice and the gender gaps in unemployment rates 172
Figure 4.1: Changes in wage bill share 204
List of Tables
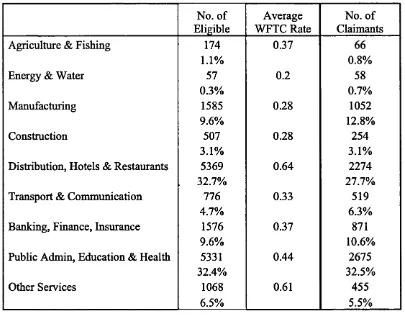
Table 1.1a: Claimants by Industry 55
Table 1.1b: Claimants by Education Group 55
Table 1.1c: Descriptive Statistics 5 6
Table 1.2a: Stage Two Regression Results (Men) 57
Table 1.2b: Stage Two Regression Results (Women) 58
Table 1.3a: NMW Identification Results (WFTC (LFS)) 59
Table 1.3b: NMW Identification Results (WFTC Rate) 60
Table 1.4a: Stage Two Regression Results - Firm Size (Men) 61
Table 1.4b: Stage Two Regression Results - Firm Size (Women) 62
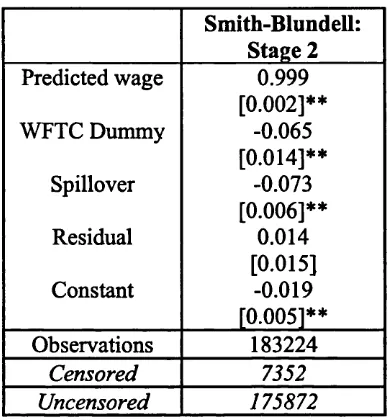
Table 1.5: Test o f Endogeneity 63
Table 2.1: Descriptive Statistics 98
Table 2.2: Employment - Basic Regression Results 100
Table 2.3: Employment - Differential Trend Control 101
Table 2.4: Hours Distribution - Regression Results 102
Table 2.5: Employment - Child Dummy Marginal Effect 103
Table 2.6: Employment - Age o f Youngest Child Marginal Effect 104
Table 2.7: Employment - Number o f Children Marginal Effect 105
Table 2.8: Employment - Differential Qualifications Marginal Effect 106
Table 2.9: Other Labour Market Outcomes - Regression Results 107
Table 3.1: Gender Gaps in Unemployment Rates Among OECD Countries 154
Table 3.2: Marginal Effects o f Characteristics o f Gender Gaps in U-Rate 155 Table 3.3a: Flows between Labour Market States and Implied SS U-Rates (Men) 157 Table 3.3b: Flows between Labour Market States and Implied SS U-Rates (Wn) 158
Table 3.4: Gender Gaps in Labour Market Transition Rates 159
Table 3.5: Gender Differences in Flows from Employment to Unemployment 160
Table 3.6: Reasons for Leaving Previous Job 161
Table 3.7: Are the Unemployed More Likely than Inactive to Get a Job? 162
Table 3.8: Methods o f Job Search Among the Unemployed 163
Table 3.9: Benefit Receipt Among the Unemployed 164
Table 3.10: Gender differences in Flows from Unemployment to Employment 165
Table 3.11: Maternity Leave Legislation 166
Table 3.12: The Impact of Attitudes on the Gender Gaps in U-Rates 167
Table 3.13: Part-time Employment 168
Table 4.1: Changes in the Wage Bill Share 195
Table 4.2: Descriptive Statistics 196
Table 4.3: Pooling Over Industries 197
Table 4.4: Results Separately by Industry 199
Table 4.5: Instrumental Variable Estimates (Wage Bill Share) 200
Table 4.6: Role o f Labour Market Institutions? 202
In trod u ction
Over the last two decades the institutional structures across the OECD countries have changed dramatically. In turn, these changes have had a significant impact on labour market performance. Some of the most striking changes can be seen when looking at union power, employment protection, public sector employment, minimum wages, the social security system, welfare related policies and legislation concerning sex discrimination. Not only have these changes altered employment incentives, composition and structure but they have also impacted on the way in which wages are set and the distribution of wage.
This thesis seeks to make four contributions to our understanding of the implications and applications of regulations. This is done in two distinct ways: firstly, to focus on the impacts of a specific policy change in the UK and secondly, to analyse (more generally) the disparities in policies and outcomes across the OECD countries.
In particular, Part 1 (comprising of Chapter 1 and Chapter 2) illustrates the impact of changes in generosity and methods of payments of Earned Income Tax Credit policies. In general, these "tax subsidy" policies are motivated by the desire to encourage participation and hours of work of certain groups in the economy, for example, lone parents and low income couples. In particular, by analysing the direct and indirect effects of policies of this kind, we increase our insight into a policy th at has become increasingly popular across the OECD countries (Earned Income Tax Credits in the USA, Self Sufficiency Program in Canada and Working Families’ Tax Credit in the UK). In particular, we go beyond the existing literature to show that the impacts of such policies are not without externalities. Our empirical investigation is carried out using the changes in the UK in October 1999 when the government replaced the Family Credit (minimum hours based income supplement for families with children) with the Working Families’ Tax Credit (WFTC).
In Chapter 1 we examine who are the beneficiaries W FTC. In particular, we investigate
Introduction 14
whether there is evidence to suggest that tax credits are not fully incident on the employee who is eligible and claiming the tax credit. We use a simple general equilibrium model with perfect competition to show th at under the assumption th at the employer has formal knowledge, or at least awareness, of which of her employees are claiming the tax credit, she can share in the incidence of the tax credit by cutting the gross equilibrium wage of the claimant worker. This can be done without reducing the worker’s net equilibrium wage such th at the worker is no worse off and, more likely, still better off from receiving the tax credit. Moreover, given the degree of substitution between the claimant and other workers, the model predicts th at there will be a spillover effect which reduces the wage of both eligible and similarly skilled ineligible workers.
We highlight two very important factors, which may be specific to the country where the change in policy occurs and which will determine the strength of the effect in question. Firstly, the method by which the tax credit is paid will play a vital role, as it can alter the amount of information th a t the employer has about her employees’ eligibility circum stances. Secondly, institutional factors such as minimum wages impose a lower bound below which the employer cannot cut the wage. The empirical investigation using WFTC is interesting in its own right, but we regard it as particularly useful as it incorporates and exploits these two factors: the payment of WFTC through the wage packet and the introduction of the National Minimum Wage.
We then proceed to show th a t by using both a parametric and non-parametric two-stage censored regression based technique, this chapter finds strong evidence to suggest that, firstly, the firm discriminates by cutting the wage of the claimant worker relative to a similarly skilled non-claimant for men, such that the employer extracts a significant amount. Secondly, there is a "spillover" effect for both men and women such th a t as the average amount of W FTC and the fraction of employees claiming WFTC increases by industry (or by education group), the wages of similarly skilled claimants and non claimants fall.
These results have important academic and policy implications. In particular, they imply th at there is a significant shift in the burden of tax credits, in line with the theory presented. This is of critical policy importance as we can no longer assume that it is the case that the person eligible for such tax credits is the sole beneficiary. These results are critical to our understanding of the consequences of the expansion, application and generosity of tax credits. Moreover, the way in which they are distributed may have unexpected consequences.
Introduction 15
induced a number of studies on the labour supply impact (Blundell et al (2005), Brewer et al (2005), Leigh (2005), Francesconi et al (2004), Gregg et al (2003)). Although the methodology and data varied, they all concluded th at W FTC had a positive impact on the labour market employment of lone mothers. According to Brewer and Browne (2006), who composed an overview of the literature, the overall conclusion was that the generosity of the in-work credit system induced lone mothers to increase their participation in the labour market by 5 percentage points.
Most of the studies on W FTC use a methodology th at evaluates the effect of WFTC by comparing the employment changes of lone mothers with single women without children, before and after the policy introduction. Since W FTC targets lone mothers but single women without children are unaffected by the policy, it is assumed th at the effect of W FTC can be quantified by the relative increase in employment. However, it is not entirely convincing th at the two groups satisfy the necessary assumption of having the same pre-policy trend in employment rates. Not only are the two groups observably and unobservably different but we also see th at there is an increasing trend in the employment rate of lone mothers since the mid-1990s, while the level for single childless women has been high and has remained fairly flat over the same period. These concerns are reinforced when we look at the movements in the hours distribution and observe continuous increases in lone mothers working part-time and full-time. Moreover, there is no noticeable spike with the introduction of W FTC and then after 2000 the increases in employment flatten even though there were increases in the basic tax credit each year from 2000 to 2003.
In particular, this chapter addresses the concern of the suitability of the control group and to see how the results change when we control for group specific differential trends. Moreover, we look to see where, along the hours distribution, the change occurs. Overall, we find three key results: First, when we allow for differential trends, the effect of W FTC on employment falls to levels th at are considerably lower than the literature’s estimate of 5% points. Second, we find th at this effect is borne solely on those working full time (30 hours or more). Finally, the policy change had no effect on those who were inactive.
These results offer valuable insight into two key issues: Firstly, the effectiveness of policy and secondly, the design of the policy. In particular, they imply th at the increase in participation was greatly exaggerated when we do not account for the differential trends between treatment and control groups. Moreover, the policy was not as well targeted as initially considered, given th at any increase to employment was solely borne on those who work 30 or more hours, while those who were inactive were unaffected by the policy.
Introduction 16
unemployment rates across the OECD countries and Chapter 4 reflects on the cross country differences in the fall in labour’s share of GDP. These issues have not been addressed in the previous literature but with the help of disaggregated data, we provide potential explanations for why we observe cross-country disparities in gender gaps in unemployment rates and in the rise in the profit share, respectively.
Chapter 3 starts from the stand point th at although there is an enormous literature on gender gaps in pay and a vast literature on gender gaps in labour force participation rates (see Altonji and Blank (1999) for an overall survey and Blau and Kahn (2003) for a recent international comparison), there is very little recent literature on gender gaps in unemployment rates. There was a literature on the subject in the US in the 1970s and early 1980s (see, for example, Barrett and Morgenstern (1974); Niemi (1974); Johnson (1983)) but few recent papers perhaps because the female and male unemployment rates in the US have converged. But this convergence has not happened in all OECD countries. We highlight th at the highest gender gaps in unemployment rates are to be found in the Mediterranean countries (Spain, Greece, Italy and France). Next come the Benelux coun tries (Belgium, Netherlands and Luxembourg), then the ‘Germanic’ countries (Germany, Austria and Switzerland), then the ‘Nordic’ countries (Sweden, Finland and Norway) and, finally the ‘Anglo-Saxon’ countries (US, UK, Ireland, Australia, Canada and New Zealand). In particular, in a number of the Mediterranean countries the ‘unemployment problem’ is largely a problem of female unemployment.
The aim of the chapter is to understand the cross-country variation in the gender gap in the unemployment rate. One should emphasize th at the question we are interested in answering is not ‘why are women less likely to be in employment than men?’ (either measured as the employment-population ratio or the labour force participation rate) for which there are fairly obvious answers in terms of the allocation of domestic responsibilities and a large literature on the subject but the question ‘why, once they have decided they want a job, are women in some countries much less likely to be in employment than men?’.
We find that although human capital theory and institutions can explain a large part of the observed differences in the gender gaps in unemployment rates, they probably do not account for all of the disparity. In addition there is some evidence th at attitudes towards male and female unemployment may be important in explaining the gap in countries where unemployment is high.
Introduction 17
others have attributed the fall in the labour share to deregulation in both labour and product markets. However, despite this interest in deregulation, the empirical work in the area is rather disappointing. Most authors work with aggregate data of one sort or another using cross-country panel regressions (Nicoletti and Scarpetta (2003a,b), Nickell (2003)). However, the results tend to be rather fragile (see Baker et al (2003)). This fragility is mainly a consequence of there being many events occurring simultaneously at the macro-level and disentangling the impact of product market deregulation from these other events is a formidable task. A second problem with the existing literature on the macro-effects of regulatory change is th at product market deregulation tend to be focused in particular sectors so a sector specific approach is more attractive. Although enlightening, the disadvantage of this very micro approach is that it is hard to generalise to other sectors or across the economy as a whole.
In this chapter we take an intermediate approach to looking at the relationship between deregulation and rising profit shares by using panel data from sectors across several OECD countries. These are the “network industries” th at have seen the greatest degree of reg ulatory reform - telecoms, post, gas, electricity, airlines, railways and roads. The timing of the reforms and the extent of reform vary significantly between countries. We exploit this differences as quantified in some new OECD data on public ownership and barriers to entry to explicitly test some key economic mechanisms.
P art I
C hapter 1
T he Incidence o f an Earned
Incom e Tax Credit: E valuating
th e Im pact on W ages in th e U K
1.1 Introduction
Over the last two decades there has been a huge expansion across many OECD countries in welfare to work programmes. Different approaches have been carried out to enhance the labour market attachment and earnings of the low skilled. The three (often conflicting) goals are to raise the standard of living, encourage work and self sufficiency and to keep government costs low.
A popular policy has been to use tax credits, for example, the Earned Income Tax Credit in the USA, the Self-Sufficiency Program in Canada and the Working Families’ Tax Credit (WFTC) in the UK. In general, these "tax subsidy" policies are motivated by the desire to encourage participation and hours of work of certain groups in the economy, for ex ample, lone parents and low income couples. These so-called "in-work benefits" aim to alleviate poverty at the lower end of the wage distribution, reduce income inequality and redistribute income by reducing the dispersion of earnings.
Given the prior aims and motivations of such policies, most of the literature to date focuses on estimating the labour supply response to changes in and/or introductions of tax credit policies (Eissa & Leibman (1996), Meyer and Rosenbaum (1999), Blundell et al (2005), Brewer et al (2005)). In particular, with regard to the WFTC, once the income
CHAPTER 1. The Incidence of an Earned Income Tax Credit 20
and substitution effect are accounted for, the policy was said to have had a "more than average" impact on lone parents and women with unemployed partners1. It is however, typically assumed th at the incidence of the tax credit is solely on the claimant worker (and therefore the claimant household).
This chapter will investigate whether there is evidence to suggest that tax credits are not fully incident on the employee who is eligible2 and claiming the tax credit. This can be with or without a boost to the economy’s overall labour supply. We use a simple general equilibrium model with perfect competition to show th at under the assumption th at the employer has formal knowledge, or at least awareness, of which of her employees are claiming a tax credit, she can share in the incidence of the tax credit by cutting the gross equilibrium wage of the claimant worker. This can be done without reducing the worker’s net equilibrium wage such th at the worker is no worse off and, more likely, still better off from receiving the tax credit. Moreover, given the degree of substitution between the claimant and other workers, the model predicts th at there will be a spillover effect which reduces the wage of both eligible and similarly skilled ineligible workers. The information assumption is still important in the spillover case because by knowing the fraction of eligible workers and the average amount claimed in the work-place, the employer can extract some of the tax credit by "averaging" out the effect.
In this chapter we highlight two very important factors, which may be specific to the country where the change in policy occurs. These factors will determine the strength of the effect in question. Firstly, the method by which the tax credit is paid will play a vital role, as it can alter the amount of information th at the employer has about her employees’ eligibility circumstances. For example, the Working Families’ Tax Credit in the UK differed from its predecessor, Family Credit, in that WFTC was paid via the wage packet. The motivation for this change was to reduce the stigma attached to receiving tax credits in the form of a welfare benefit. However, using this method gave employers complete information on which employees were claiming and also how much W FTC they were receiving. Secondly, institutional factors such as minimum wages impose a lower bound below which the employer cannot cut the wage. This was the case in the UK with the introduction of the National Minimum Wage (NMW) in April 1999. This is also important because it implies that those at the lower end of the wage distribution are more likely to be protected by the national minimum from a cut in gross wage. Additionally (and perhaps more obviously), those at the top end of the wage distribution are unlikely to be affected because tax credits are less relevant to their household income, as they probably receive too little or they earn too much to be eligible. It is therefore those in
1See Blundell & Walker (2001).
CHAPTER 1. The Incidence of an Earned Income Tax Credit 21
the middle of the wage distribution who are most likely to be affected.
The empirical investigation is carried out using the change in the UK in October 1999 when the government replaced the Family Credit (a minimum working hours based credit for families with children) with the Working Families’ Tax Credit. The change in policy altered the eligibility criteria and it became more generous 3. Although focusing on this policy change is important in its own right because of this increase in generosity, it is made even more interesting by the fact th at we incorporate and exploit two crucial changes in the UK: firstly, the National Minimum Wage (NMW) was introduced six months prior to the W FTC and secondly, the WFTC was paid via the wage packet. The introduction of the NMW plays a fundamental role in this analysis as it offers an interesting identification strategy by acting as an exogenous barrier below which the employer cannot cut the gross wage. In the analysis it is also used as a point of censoring when comparing the change in wages before 1999 to after the introduction of the tax credit.
The payment of the tax credit though the wage packet also plays a central role in the analysis. In the UK employers became responsible in April 2000 for paying the WFTC through the employees’ wage or salary. The eligible claimant would claim the approximate tax credit from the Inland Revenue, who would work out the amount of tax credit payable. The Inland Revenue would then notify the relevant employer of the amount of tax credit to be paid and when the tax credit is to start and finish4. Employers would pay the tax credit out of the tax and National Insurance contribution that they would otherwise have forwarded to the Inland Revenue5. Recent work in the USA by Leigh (2004) and Rothstein (2005) investigates the impact of increased labour supply resulting from changes in the Earned Income Tax Credit (EITC), on the equilibrium wage. In the US however, the employer is not responsible for income tax filing on behalf of employees and so the EITC is not visible in the wage packet. In the UK, payment of WFTC through the wage packet made the employer responsible for the payment of the tax credit and so increased the connection between the wage paying firm and the claimant employee. This chapter exploits these differences to get a good measure of the effect of tax credits on wages.
We use two measures of WFTC: the first is the reported number of claimants and the second is the amount of WFTC, which is calculated using the eligibility criteria. This second measure is particularly useful as it allows us to distinguish between the effect of the change in generosity from Family Credit and the change in visibility (i.e. payment through the wage packet) on the wage. Using both a parametric and non-parametric
two-3 A more in-depth description will be given in a later section
4 It is important to note that this notification would not break down the various components of the credit or distinguish between the WFTC and disabled person’s tax.
CHAPTER 1. The Incidence o f an Earned Income Tax Credit 22
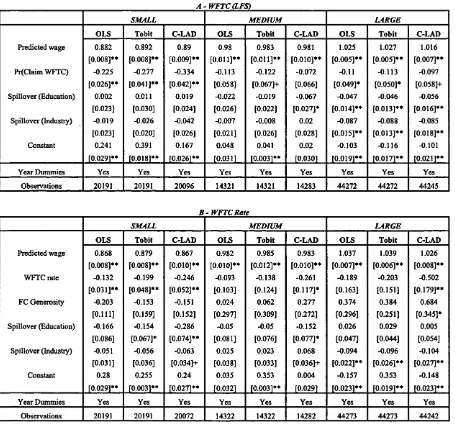
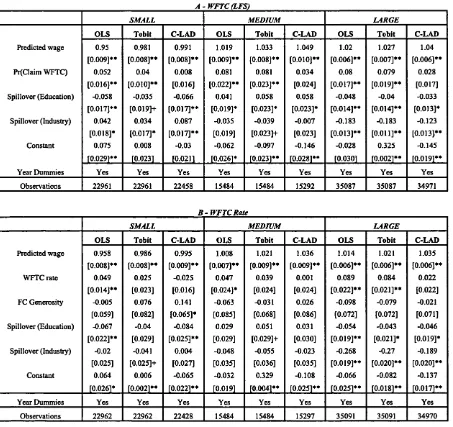
stage censored regression based technique, this chapter finds strong evidence to suggest that, firstly, the firm discriminates by cutting the wage of the claimant worker relative to a similarly skilled non-claimant for men, such th at the employer extracts 35%6. Secondly, there is a "spillover" effect for both men and women such that as the average amount of W FTC and the fraction of employees claiming W FTC increases by industry (or by education group), the wages of similarly skilled claimants and non-claimants fall. We find th at the "spillover" effect by industry for men is approximately -0.2% and -0.3% for women and when looking by education group, the spillover effect for men is -0.1% and -0.7% for women7. Finally, as a robustness check we identify the workers for who the NMW binds and find th at the tax credit does not have the same effect on their wages, indicating th a t the NMW protects them from a wage cut.
The analysis is extended to show that the size of the firm plays an important role in the size of the incidence transfer and as the size of the firm increases, the spillover effect is the principle effect. This is not particularly unusual when one considers th a t as the size of the firm increases, there is a higher chance th a t there are workers doing identical jobs, such th at the employer would find it difficult to cut the gross wage of one worker and not the other on grounds of eligibility. She therefore shares the burden across all workers. Finally, we address the concern of selectivity in the "take-up" rates and the problem of previously ineligible workers altering their behaviour to become eligible. We tests the exogeneity of the W FTC variables using the Smith-Blundell (1986) procedure and find no evidence of endogeneity .
These results have important academic and policy implications. In particular, they imply th at there is a significant shift in the burden of tax credits, in line with the theory presented. This is of critical policy importance as we can no longer assume th at it is the case th at the person eligible for such tax credits is the sole beneficiary. These results are critical to our understanding of the consequences of the expansion, application and generosity of tax credits. Moreover, the way in which they are distributed may have unexpected consequences.
The rest of the chapter is structured as follows: Section 1.2 gives a brief overview of the past literature on tax credits. Section 1.3 introduces a general equilibrium model which explains how a tax credit can reduce the gross equilibrium wage. In Section 1.4 a short history and the main descriptive statistics are given for tax credit policy changes in the UK. Section 1.5 describes the empirical framework used to test the hypothesis proposed in Section 1.3. Section 1.6 describes the data and explains the main results. Section 1.7 extends the analysis from Section 1.6 and highlights and deals with potential problems.
CHAPTER 1. The Incidence o f an Earned Income Tax Credit 23
Section 1.8 discusses the implications of these results and suggests policy implications. Finally, Section 1.9 concludes.
1.2
R elated Literature
As mentioned in the introduction, much of the literature to date focuses on evaluating the participation effect of tax credit changes/introduction. One of the most well known papers is that of Eissa Sz Leibman (1996) where the authors examine the impact of the Tax Reform Act of 1986 in the USA, which included the expansion of the Earned Income Tax Credit (EITC). They focus on the labour market participation and hours of work of single women with children and identify the change by comparing the change in the labour supply of single women with children and single women without children. They find that labour supply increases by 2.8%. Another prominent paper which focuses on the changes in labour supply of single women in the USA is that of Meyer and Rosenbaum (1999). They however, take a more general approach to looking at various policy changes in the US in the 1980s and 1990s that affect this group of women. They found th at although benefit cuts, welfare time limit alterations, changes in training programs and childcare expansions had some impact on making women with children work, the largest share of the increase could be attributed to reforms in EITC. Blundell Sz Hoynes (2001) examine the labour market impact of in-work benefit reform in the UK and then compare it with the USA policy reform (i.e. EITC). They look at why the impact of similar reforms in the UK seem to be small relative to the USA (in terms of increasing employment rates). They conclude th at it is attributed to the interactions with other means tested benefits in the UK, the importance of workless couples with kids, the level of income support given to non-working parents and the strength of the USA upturn in the 1990s.
In the UK work has been done to look at the labour supply impact of the Working Families’ Tax Credit (WFTC), which was introduced in October 1999 and then replaced by a new tax credit in April 2003 (Child Tax Credit and Working Tax Credit). Using a structural model of labour supply, Brewer et al (2005) find th at although labour supply increased for lone mothers, the effect on other groups in the economy was minimal. Blundell et al (2005) and Leigh (2005) also look at the labour supply impact but instead using the difference-in-difference methodology and find similar results. These papers find a 3-5% increase in participation of lone mothers, no significant effect on married mothers and -0.5 to 0.75% change in father’s employment.
CHAPTER 1. The Incidence of an Earned Income Tax Credit 24
on skill formation resulting from increased participation (Card, Michalopoulos h Robins (2001), Heckman, Lochner & Cossa (2002)). The main question posed in these papers is whether tax credits create an incentive to invest in skills th at are useful for the work place, and/or if skills are acquired as a by-product of being in the workplace. The effects on human capital are rather ambiguous and depend on the view taken as to whether learning is rivalrous to work or not. Heckman et al find that the entry effect of EITC is small, but the reduction in the average earnings amongst uneducated women can be as large as 18%. In the UK, Lydon & Walker (2004) also question whether the introduction of the WFTC promoted incentives to increase investment in on-the-job search and training in general skills. They look to see if factors such as these promoted wage growth and found th at for people who were previously claiming Family Credit, W FTC’s predecessor, incentives are unchanged, but for those who became eligible for the tax credit and had not been previously eligible, there was a 2.7% wage progression.
CHAPTER 1. The Incidence of an Earned Income Tax Credit
1.3
Tax Credit Incidence: T heoretical A pproach
25
The aim of this section is to show how, in a theoretical setting, it is possible for a tax credit to influence the equilibrium wage in a general equilibrium framework. The Proposition adapts the Harberger (1962) model of tax incidence8 to show that a change in the tax credit can lead to a shift in the burden of the tax credit from employee to employer. Moreover, the model shows that when allowing for heterogeneity between workers, there is an indirect effect which affects both eligible and non-eligible. The impact of this effect will depend on the elasticity of substitution between the eligible worker and ineligible worker and the fraction of eligible workers in the work place.
Before introducing the main proposition, let us consider a very simple economy in which workers are perfect substitutes and the law of one wage applies. We can show th at it is only in "special'1 circumstances th at the imposition of the tax credit does not alter the wage of the claimant. Moreover, it implies th at it is not only the claimant (or claimant’s household) who is affected by the policy, but also other groups in the economy are affected.
Let workers comprise of either being eligible for a tax credit (group 1), N{, or ineligible for a tax credit (group 2), iV| > s is the subsidy rate. In equilibrium, at wage w, labour demand, N d, will equal labour supply:
N d(w(s)) = N ((w (s)( 1 + s) + N }(w (s)) (1.1)
The effect of the subsidy on the gross wage is characterised by:
d i n
w
= _________
Orjl
_______________
^
91n(l + s) 0„! + (1_ e)i _ _ ! £ .
Where r)\ and 7)2 are the labour supply elasticities for the eligible and ineligible group, respectively, and r f is the labour demand elasticity. The fraction of each group is repre sented by 6. See Appendix for the proof.
We can interpret this simple calculation, given that the expression lies between 0 and 1, as the fraction of the subsidy th at shifts from worker to employer. The larger the supply
CHAPTER 1. The Incidence of an Earned Income Tax Credit 26
elasticity of group 1, the more elastic the labour demand and/or the larger the fraction, then the bigger the shift. Only in special circumstances will the tax credit have no effect on the gross wage, for example, if labour demand elasticity is infinite or if labour supply was perfectly elastic.
The path breaking general equilibrium analysis of Harberger (1962) derives the burden of a tax on capital in one sector. Here, the procedure is adapted to show the general equilibrium effect of a tax credit on input compensation in a one sector model which uses two different types of labour (JVi, JV2) to produce one good (X). The heterogeneity of workers comes from the difference in being able to satisfy the eligibility criteria9. In the simple economy example, the incidence effect is the same for all workers, but here by differentiating workers, we can look to see how the effect differs for the eligible and ineligible groups.
P ro p o sitio n 1.1 A change or an introduction of a tax credit under a general equilibrium setting, given that workers are not perfect substitutes, will result in a direct change in the
gross wage of the eligible claimant group and an indirect effect on both groups.
Let it be the case th at workers who are eligible for the tax credit, N\ , are paid the gross wage w\ and workers who are not eligible for the tax credit, N2, are paid the gross wage W2- The subsidy rate is given by s and 9 is the fraction of eligible group. Another important feature here is the elasticity of substitution between the two groups, crx . The effect of the subsidy on the gross wage is given by:
d ln w i _ (1 6)ri1 ^ eligible claimant {group I) (1.3) d ln (l + s) (1 - 6)r)\ + 9rf2 + o x
d\n.W2 _ 9r}1 ^ ineligible {group 2) (1.4)
d ln (l + s) (1 - 9)7]\ -f 0r)% + o x
The proof is given in the Appendix.
9We do not specify a particular functional form since by assuming the production function X —
CHAPTER 1. The Incidence of an Earned Income Tax Credit 27
This proposition suggests th at when one accounts for heterogeneity amongst workers, based on the eligibility criteria, it causes the wage of claimant workers to be different from the ineligible workers and the subsidy affects the gross wage of both groups of workers. The strength of this impact will depend on: (1) The fraction of each group, 0 and (2) the level of substitutability between the two groups, o x. The substitution effect is captured in the labour demand elasticity and the effect on the non-eligible group becomes smaller as the proportion of claimants falls10.
Since 6 is defined as the cost share, it is endogenous in terms of the population share. It is interesting to look at the cross-derivatives with respect to s and 0. This tells us what happens to wages when the share changes:
d2 In w\ V iiv x + ril)
d ln (l + s)d9 ((1 - 0)r]l + 0J7J + crx)2
d2 In W2 l i i v x + 'n i )
(1.5)
d ln (l + s)d0 ((1 - 0)775 + 0*12 + ax ) 2 (1.6)
The visibility of the tax credit may play an important role for the shift in incidence, such th at the employer has some knowledge/information about which of her workers are eligible for the tax credit. The most simple and straightforward way in which this would be the case is when the tax credit is paid via the wage packet. Here the employer can see clearly if the worker is a claimant (and how much she is receiving). However, one can still maintain this assumption even in the event th at the employer does not have full information. For example, if there exists some kind of "internal knowledge" of whether or not the employee is claiming tax credit (e.g. the employer may know if his employee has children), or it may be th at there is statistical discrimination.
Finally, we may be interested to know how the results change when we consider a non competitive framework, for example a monopsony or a wage posting model. In his paper, Harberger (1962) addresses this issue when looking at the corporate sector. He adjusts his analysis to accommodate for potential monopoly power and concludes th at the tax bites into monopoly profit as well as into the returns in capital (in the context of our model, this would be the wage). Overall, although it would be interesting to lay out a model and to see how in equilibrium the distributions of the two different types of labour
CHAPTER 1. The Incidence of an Earned Income Tax Credit 28
and the relative prices of the labour will change, in the end the tax burden that is not directly borne by monopsony profits will be "determined by a mechanism th at differs only in minute details from that which determines the incidence of the [corporation income tax] in the competitive case"11.
1.4
T he W orking Fam ilies’ Tax Credit
In the UK, since the 1980s, there has been a dramatic shift in the composition of the lowest decile of the income distribution from pensioners, to families of working age and lone parents in particular (Goodman (2001)). The Working Families’ Tax Credit (WFTC), introduced in October 1999, was designed to target low income families with an income supplement that was contingent on working. However, systems of support for families with dependent children in the UK have been around since 1971, when Family Income Support (FIS) was introduced. FIS entitled families with children and working more than 24 hours per week, to an income supplement.
In 1988, FIS was renamed Family Credit (FC) with some structural reform and an increase in generosity. Namely, the hours requirement fell to 16 hours and a childcare disregard was introduced to encourage higher participation especially amongst mothers of young children. In October 1999, FC became WFTC and the government estimated twice as many families to be in receipt of W FTC as received by FC. Figure 1.1 shows how the number of claimants changed from 1988 to 200212. There were 1.1 million claims for W FTC in August 2000, which increased to 1.3 million claims in August 2001. This is almost 430,000 more than claimed under Family Credit in August 1999 .
Eligibility for WFTC was based on the family income being less then £92.90 per week, the presence of children, a minimum of 16 hours of work in the family per week and low household savings. Although not innovative, it was more generous and extended further up the income distribution. In particular, the marginal deduction rate fell from 70% to 55% and there was a larger childcare subsidy. The maximum weekly rate of WFTC was made up of an adult credit for each child and a bonus if the claimant or their partner worked for 30 hours or more each week. An important aspect of the policy was that income from most other benefits, like housing benefit, child benefit and council tax benefit were not included in the calculation for the entitlement of WFTC. This, as argued in Blundell Sz Walker (2001), could potentially offset the work incentive effects of WFTC.
11 See Harberger (1962).
CHAPTER 1. The Incidence o f an Earned Income Tax Credit 29
In terms of government spending on the program, by 2000 the government had spent £5 billion per year (which accounts for 1.5% of the government budget and 0.6% of the GDP). This was almost £2 billion more than that expected under FC. The huge increase in expenditure came from increased credit per child from £19.85 to £26; the threshold support increase from £80.65 to £92.90, and of course, the reduced taper. In addition, the childcare cost accounted for 70% of actual childcare cost (accounting for weekly childcare costs up to a maximum of £135 for one child and £200 for two or more children). The effect of these changes meant th at those who were currently receiving the maximum payment would see a small increase in the level of their payment if they had children under the age of 11 years old. Those with net income between £80.65 and £92.90 would move from being on the taper to receiving full support. The others on the taper would see the taper rate fall from 70% to 55% and the largest cash gain would go to those who were previously just at the end of the taper. Figure 1.2 shows how the average claim changed over time. In addition, an encouraging sign of WFTC effectiveness was th a t its take-up rate by 2002 was estimated to be 72-76% compared to 66-70% under FC. The take-up rate was highest for those entitled to the biggest awards. Also, the greater generosity of W FTC relative to FC meant that the take-up of W FTC was higher than would have been expected had FC simply continued unchanged.
As mentioned in the introduction, one key difference between FC and W FTC was th at the payment was made through the wage packet. This was an attractive move because it became more convenient to distribute and it reduced the stigma attached to the tax credit for being a welfare benefit. In April 2000, the eligible claimant would claim the approximate tax credit from the Inland Revenue, who would work out the amount of tax credit payable. The Inland Revenue would then notify the relevant employer of the amount of tax credit to be paid and the employer would pay the tax credit out of the tax and National Insurance contribution th at they would otherwise have forwarded to the Inland Revenue.
1.5
Em pirical Framework
CHAPTER 1. The Incidence o f an Earned Income Tax Credit 30
average tax credit amount increases within an industry (or within an education group)13. Finally, we use the empirical model to distinguish between the effect of the change in generosity of the WFTC and the change of its visibility on the wage. We propose both a parametric and non-parametric two stage censored regression model to estimate these effects. In addition, as a robustness check we extend the two stage analysis to identify those workers for who the NMW binds to see how W FTC affects their wages. Before explaining the methodology, let us begin by discussing the identification of some key variables.
We want to identify the effect of W FTC on the wages of "similar" people, where some are eligible for W FTC and some are not eligible. We define "similar" people as those who have the same predicted wage in the absence of W FTC. The idea is th at we want to estimate the (log) wage, W*:
W* = /30 + fa W f + fa W F T C i + j3sFCG em + /34(W F T C *0) + Ui (1.7)
Where W f is the counterfactual (log) wage we would have if there was no WFTC; W F TC i is the tax credit variable14 and FCGerii represents the change in the generosity of WFTC from Family Credit (FC). The spillover effect, (W F T C *9), is captured using the average W FTC in an industry (or education group), weighted by the fraction of claimants in that industry (education group) and u* is the error term. The main problems for identification are th at we do not know the counterfactual wage and secondly, we may be concerned that U{ is correlated with W F T C i. Our task is therefore to construct some sort of predicted measure of the counterfactual wage, Wi, and to find an appropriate WFTC measure, W F TC i. In other words, we want to ensure that: correl(wi,Ui) = correl(W FTCi,Ui) = 0. This section is devoted to explaining how this is done.
One of the key tasks is to construct a measure for WFTC. We identify the WFTC variable in two ways: (1) Using a simple indicator which identifies those who report claiming WFTC, we work out the probability of claiming W FTC and (2) using the eligibility criteria, we identify those who are eligible for WFTC and the amount for which they are entitled. In addition, this second measure enables us to distinguish between the change in generosity from Family Credit (FC) to W FTC and the change of visibility from payment as a welfare benefit to payment through the wage packet. We do this by calculating the
13 We use two measures of spillover: Industry and education groups. We discuss these later in this section.
CHAPTER 1. The Incidence of an Earned Income Tax Credit 31
amount of FC a person would be eligible for, given th a t it was still in operation and then by taking the difference from the amount of W FTC, we work out the increase in generosity. However, since eligibility does not imply take-up, it is good to estimate using both methods.
The receipt of WFTC differs across households for four main reasons: (1) hourly wages, (2) hours worked, (3) household income and (4) presence of children. These four factors not only determine eligibility, but will also determine the amount received. The outcome variable under investigation is the hourly wage variable and so the variation in the latter three factors (hours worked, household income and presence of children) can be used to evaluate the change in hourly wage th at is due to the change in tax credit policy. Typically, the literature on tax credits ignores the different sources of variation and the analysis is conducted by comparing people with children to those without (Eissa & Leibman (1996), Blundell et al (2005)). We use the variation from all three factors to conduct the analysis, but we are assuming th a t people do not alter their behaviour (significantly enough) in hours of work, for example, to make the criteria endogenous. We discuss this in more detail later in this section15.
By comparing eligible with non-eligible workers who have the same pre-WFTC wage, we do not have the standard treatm ent and control group because of the potential spillover effects discussed in Section 1.3. Instead, as it will become clear later in this section, we use a cross-sectional wage structure before WFTC (as the predicted wage variable) and then add in the wage growth and policy change to see what happens to the eligible and non-eligible with the same predicted wage. Essentially, we use a predicted wage measure which is some function of characteristics, a W FTC variable which is also some function of characteristics and then we identify the effect through a particular functional form. For example, suppose th at two people have the same predicted wage before WFTC is introduced. They both have children and a low household income, but one person (or one household) works too few hours to be eligible for W FTC. Here we compare their relative before and after wage changes.
Typically the literature on tax credit analysis only focuses on women since, as noted in Eissa (1995), they axe usually the largest group of taxpayers eligible for WFTC and they are the group most relevant for studying whether W FTC reduces welfare dependency. However, for the purpose of our analysis, it seems reasonable to look at both women and men. The institutional structure of WFTC specifies th at either parent can claim the tax credit in their wage packet. Given th at in a coupled household it is more likely th a t the
CHAPTER 1. The Incidence o f an Earned Income Tax Credit 32
male member of the household will be in work, it is therefore more likely that he will be the tax credit claimant. It therefore not justified to drop men from our analysis.
1.5 .1 T h e role o f th e N a tio n a l M in im u m W age:
In the same year as the W FTC was introduced, the UK had another important introduc tion: National Minimum Wage (NMW). For the first time, the government introduced a national minimum in April 1999 of £3.60 for adults (aged 22 years and above) and £3.00 for those aged 18 - 21 years16. Since this policy was introduced only six months before the introduction of the W FTC, we may pose the question: Is this a nuisance or an aid for the following analysis?
We argue that the NMW plays a fundamental role in the evaluation method and is something that should not be ignored in any analysis on WFTC. In the following analysis it is used for both identification and as a censoring point. It offers an unusual source of variation because it is a floor below which the employer cannot cut the wage. Although it has the strongest effect on those at the lower end of the wage distribution, as WFTC does, the NMW will protect those with the lowest wages from a wage cut (i.e. the part of the wage distribution where the employer is set to gain the most in incidence). This has a very interesting implication th at it is those in the middle of the wage distribution who lose the most, since those at the upper end of the wage distribution will either not be eligible to claim or will receive so little th at either they don’t claim or it is not in the employer’s interest to cut their wage.
1 .5 .2 T h e " W F T C (L F S )" In d icator:
The UK’s Quarterly Labour Force Survey (LFS), which is discussed in more detail in the next section, contains information on the types of family related benefits that are claimed. From Spring 2000, information on W FTC claim is reported17. This is a useful variable as it helps to identify reported claimants, however take-up of the tax credit is likely to be correlated with the amount of W FTC to be claimed and other individual, household and job characteristics. For this reason we use the probability of claiming WFTC instead of actual claim in a probit model, such that:
16 Although there were Wage councils abolished in 1993
CHAPTER 1. The Incidence of an Earned Income Tax Credit 33
P r(C laim W F T C = 1\X, W F TC am ount) = $(i9'Xi + 7W F TC am ounti) (1.8)
Where $ (.) denotes the standard cumulative distribution function of the standard normal, X i is a 1x K vector of conditioning variables18 and we use the predicted WFTC amount. In addition, to make the analysis more rigorous and to account for the individual level of importance of WFTC (relative to household income), a "WFTC Rate" is calculated using the policy eligibility criteria. The nature of this variable allows us to distinguish between the two important changes with regard to the W FTC, namely the change in generosity and change in visibility.
1 .5 .3 C a lc u la tio n o f t h e " W F T C R ate" variable:
W F T C R a te The wage change analysis becomes complicated when measuring the amount of WFTC as W FTC is computed using household income rather than the indi vidual wage. One possible way of tackling this is to use the data to match earners in the household and then to estimate the amount of W FTC the household is entitled to claim using the eligibility criteria. This variable is then used in the regression framework. The (per week) W FTC has 3 main parts19: (1) A basic credit of £59.00 (one for each family), (2) A 30 hour tax credit bonus of £11.45 (where the worker works at least 30 hours per week) and (3) A tax credit for each child in the eligible household of £26.00. In addition, the criteria also specified th at the household should have low savings. The LFS does not report data on savings and so we cannot use it in constructing the W FTC variable. However, here this is not a big problem since only 3.6% of couples and 2.7% of lone parents reports having savings over £5,000 and for those on maximum awards, no one reports having savings over £5,0002°.
The payable WFTC is based on each component added together to make a maximum credit. If net household income (H H In c) is above £92.90 per week, the maximum WFTC is reduced. There will be a reduction of £0.55 for each pound over £92.90. If the net income is below £92.90, the maximum WFTC is payable.
In general, the "WFTC" variable is calculated as follows:
18The controls include: Age, Education, Region, Ethnicity, Experience (plus higher orders), Tenure (plus higher orders), Marital Status, Number of Children, Firm Size, Public Ownership, Occupation Type, Industry Type, Full-time Status.
19 Figures are given for April 2001.
CHAPTER 1. The Incidence of an Earned Income Tax Credit 34
o Gross WFTC
= £
59.00(if hours=> 16) + £ 11.45
(if hours=>30)+
£26.00 per child (given hours=> 16)_ f (HHInc-£92.90(per week))*55% if HH inc=>£92.90
o Reduced WFTC = < [ [
I 0 otherwise
o WFTC = Gross W FTC - Reduced WFTC
It is important to note th at when we calculate household weekly income, we use the predicted wage (and not actual wage) of the earner in the sample21 using wage data from before 1999. The weekly wage of the earner in the sample is calculated by multiplying the predicted hourly wage with hours worked and then the total household weekly income will include the weekly wage of other members of the household. Since W FTC affects the wage through the household income, we cannot put actual weekly wages into calculating
the
W FTC
variable as it would be endogenous and this is why we use the predictedhousehold income.
In addition to this, instead of using this
W FTC
variable in the wage analysis th at follows, we use the rate of WFTC(WFTC
Rate). Since wages are used to calculate theWFTC
variable, they are endogenous when used as a regressor in any analysis where wage is the dependent variable. It is the case that
W FTC
will increase as wages (or household income) decreases. TheW FTC
Rate, on the other hand, is a non-linear variable which weights householdW FTC
by (predicted) weekly wages.o
WFTC
Rate =F C G en ero sity The change in tax credit criteria in 1999 meant th at WFTC was more generous compared with FC for three main reason: (1) The threshold increased from £86.65 (per week), (2) Credit for each child increased from £19.85, (3) The taper fell from 70%22. By constructing a counterfactual FC variable using this criteria when W FTC was in operation, we can calculate the change in generosity of the policy, such that:
o
FC
Generosity=
This will allow us to distinguish between the two effects on wages: change in generosity and change in visibility.
21 The earner referred to here is the female worker when we restrict the analysis to just women and likewise, it is the male workers when we restrict the analysis to men.
CHAPTER 1. The Incidence of an Earned Income Tax Credit 35
1.5.4 S p