Maximum Power Point Tracking (MPPT) Solar Charge Controller
Hamidullah Kandahari
1Rakesh Kumar
21,2
Department of Electrical Engineering
1,2
NIU (Noida International University) Greater Noida, UP, India
Abstract— Maximum Power Point Tracking is electronic tracking - usually digital. The charge controller looks at the output of the panels, and compares it to the battery voltage then figures out what is the best power that the panel can put out to charge the battery. This is just the opposite of the seasonal variation for MPPT controllers. Since panel temperatures are much lower in winter, they put out more power. And winter is usually when you need the most power from your solar panels due to shorter days. But nevertheless, this optimize output by following the sun across the sky for maximum sunlight. These typically give you about a 15% increase in winter and up to a 35% increase in summer. It takes this and converts it to best voltage to get maximum AMPS into the battery. (Remember, it is Amps into the battery that counts). Most modern MPPT's are around 93-97% efficient in the conversion. You typically get a 20 to 45% power gain in winter and 10-15% in summer. Actual gain can vary widely depending weather, temperature, battery state of charge, and other factors.
Keywords: Solar Energy, Charge Controller, Arduino,
Servomotor and LDR
I. INTRODUCTION
solar energy is one of the most popular type of renewable energy which has zero pollutions and it is economically and environmentally friendly and efficient. In the 1800s, Edmond Becquerel discovered the photovoltaic effect, which led to further research and eventual invention of the first Photovoltaic Solar Cell in 1883 by Charles Fritts. Since then many researches have been done on it to make the advance type of solar cells with new technologies and increase the efficiency of the solar cells. These days all of the world countries trying to cut carbon pollution, by reducing the use of fossil fuel and developing renewable energy production or clean energy productions. Because due to using of fossil fuel for producing of energy specially electricity which cause emission of more carbon to the environment and cause serious pollution and increasing the world temperature, wildfire, melting of the pole ice, rising of the sea water level, tsunami and increasing some serious disease, so for riding of these evils the only option is using of renewable energy source for producing clean energy free of pollutions. Also, the limitation of fossil fuel is another major case, the fossil fuel is limit, if we using it in this way this resource will be finish after few decades. due to that the world want to increase the use of renewable energies. There are five types renewable energies sources such as solar, water(hydroelectric), bioenergy, geothermal and wind. Solar is one of the most popular renewable energies source which produce by using of sunlight. So, for better output and increasing the efficiency of solar cell many researches have been done. Due to that in early of 2016, the average solar panels are 15% efficient and the further quarter of 2016, the efficiency of solar panels recorded at 22.1%. this means that there is still over 80% of untouched energy that could be used. Till now the efficiency
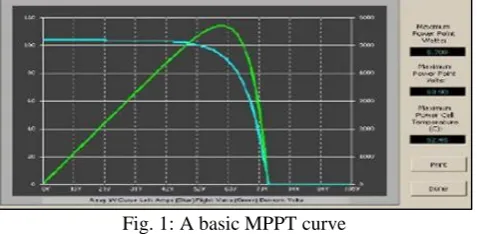
[image:1.595.311.550.613.730.2]of solar panels are very low as compare to wind turbine which its 79-85%. So, the scientists are trying to increase the efficiency of solar panels. It is not possible to harvest 100% the sunlight and make panels with 100% efficiency. The efficiency of solar cells is depending on the capturing of the sunlight. according to physics, the maximum sunlight that could be captured by solar panel is only 33.7%. The efficiency factor of a solar panel can be because of the silicon that is used to make the solar cell, which is part of a monocrystalline cell. The current commercial monocrystalline cells are only about 24% efficient. This is one of the constraints of making solar panels more than 24% efficient, as it is impossible to make it more efficient than its materials. Most solar panels are set at the optimum angle based on the angle the sun hits the panels where it installed. As the sun moves throughout the course of the day, the amount of sun the solar panels will get varies on the angle to which they are set. If the sun is blocked by clouds, the amount of sun hitting the solar panels would decrease, thus decreasing the power converted. So, in order to get the best performance of the solar panels, it would be best to make sure that the solar panels get the maximum hours of sunlight during the day, to do that it would need to be clear of shades and the right orientation depending on the time of the day. All these factors can be determined by looking at a solar panel’s characteristic curves, which are the output current and voltage graphs. The maximum power in an ideal situation for a solar panel can be found using the IV curve. This is the graph of the current vs. the voltage. The peak point of the curve would be the optimum point of power for the panel. For improving the efficiency of solar panels, the maximum power point tracking is one of the best methods. MPPT is measuring the power of the solar panel at given intervals and making sure it is always at its maximum power. MPPT is not a new technology some companies are designed it many years ago. Most of the MPPT is operate according to the angle of the sun, and do not constantly calculate the power. The solar panels can either move 180 degrees (single axis) or can tilt in all different angles using dual access. The amount of power generated by a solar panel depends on the operating voltage of the it. A solar panel maximum power point (MPP) varies with solar insulation and temperature.
Fig. 1: A basic MPPT curve
very cold conditions a 120-watt panel is actually capable of putting over 130+ watts because the power output goes up when the panel temperature goes down - but if you don't have THE MPPT for tracking that power point, you are going to lose it. On the other hand, under very hot conditions, the power drops - you lose power as the temperature goes up. That is why you get less gain in summer. The MPPT system is more efficient under these conditions:
1) Winter days, cloudy or hazy days and when extra power is needed the most.
There are a few points which the MPPT is more suitable for producing power with more efficiencies.
2) Cold weather - solar panels are work better at cold temperatures, by rising the temperature the efficiency of solar panel will reduce. but without a MPPT we are losing most of that. Generally, in winter the weather is cold and the time of sunny hours are low and we need the power to recharge batteries the most.
3) Low battery charge – when the charge of the battery is in lower level, - another time when the extra power is needed the most. You can have both of these conditions at the same time.
4) Long wire runs -when the panel is away from load and you need a large wire system to connect panels to the load i.e. If you are charging a 12-volt battery, and your panels are 100 feet away, the voltage drop and power loss can be considerable. But if you have four 12-volt panels wired in series for 48 volts, the power loss is much less, and the controller will convert that high voltage to 12 volts at the battery. Also, it means that if you have a high voltage panel, setup feeding the controller, you can use much smaller wire. Nowadays the most advance types of solar charge controllers are available in the market is Maximum Power Point Tracking (MPPT). The maximum tracker is more sophisticated and more expensive. It has several advantages over the previous charge controller. It is more efficient at low temperature i.e. 30 to 40% efficient at low temperature. But making a MPPT charge controller is little bit complex in compare to PWM charge controller and It require the advance knowledge of power electronics.
II. PRINCIPLE OF OPERATION
Photovoltaic cells have a complex relationship between their operating environment and the maximum power they can produce. The fill factor, abbreviated FF, is a parameter which characterizes the non-linear electrical behavior of the solar cell. Fill factor is defined as the ratio of the maximum power from the solar cell to the product of Open Circuit Voltage Voc and Short-Circuit Current Isc. In tabulated data it is often used to estimate the maximum power that a cell can provide with an optimal load under given conditions, P=FF*Voc*Isc. For most purposes, FF, Voc, and Isc are enough information to give a useful approximate model of the electrical behavior of a photovoltaic cell under typical conditions. For any given set of operational conditions, cells have a single operating point where the values of the current (I) and Voltage (V) of the cell result in a maximum power output. These values correspond to a particular load resistance, which is equal to V / I as specified by Ohm's Law. The power P is given by P=V*I. A
photovoltaic cell, for the majority of its useful curve, acts as a constant current source. However, at a photovoltaic cell's MPP region, its curve has an approximately inverse exponential relationship between current and voltage. From basic circuit theory, the power delivered from or to a device is optimized where the derivative (graphically, the slope) dI/dV of the I-V curve is equal and opposite the I/V ratio (where dP/dV=0). This is known as the maximum power point (MPP) and corresponds to the "knee" of the curve.
A load with resistance R=V/I equals to the reciprocal of this value draws the maximum power from the device. This is sometimes called the 'characteristic resistance' of the cell. This is a dynamic quantity which changes depending on the level of illumination, as well as other factors such as temperature and the age of the cell. If the resistance is lower or higher than this value, the power drawn will be less than the maximum available, and thus the cell will not be used as efficiently as it could be. Maximum power point trackers utilize different types of control circuit or logic to search for this point and thus to allow the converter circuit to extract the maximum power available from a cell
III. ESSENTIAL COMPONENTS
A. Solar Panel
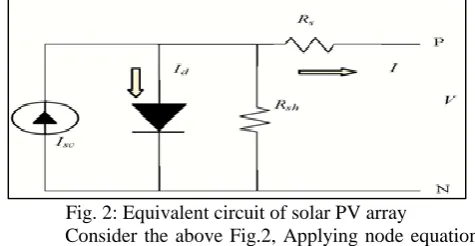
[image:2.595.310.548.527.650.2]Solar panel is a photovoltaic device that converts the sunlight energy into electric energy or to direct current (DC). The generated current change linearly with the solar irradiance. The solar panel is form by connecting many solar cells in series and parallel. The first generation of solar cells are made of crystalline silicon (mono-Si, multi-Si), the second generation of solar cells based on thin film technology these includes CdTe, CIGS and amorphous silicon and the third generation of solar cells are made of organic and organometallic compound. The solar cell is not active due to darkness so it can produce energy only during day and when their sunlight be available. During the night or at dark place it neither produce current nor voltage. While designing the panel on Proteus a solar cell is considered in its equivalent circuit.
Fig. 2: Equivalent circuit of solar PV array
Consider the above Fig.2, Applying node equation in where, Isc, Rs and Rsh and diodes are meeting together. The current equation is given as:
ID = IS [exp (q (V + I RS)/KT)) –1] ………. (1.1) While the solar cell output current is:
I=IL-IPV-ISH ……… (1.2)
I=IL-Is[exp(q(V+IRS)/KT)-1]-(V+IRS)/RS ……. (1.3) Where:
q: Electron charge (1.6×10⁻¹⁹ C) K: Boltzmann constant (1.38×10⁻²³ J/K) T: Cell temperature in Kelvin (K) V: solar cell output voltage (V) Rs: Solar cell series resistance (Ω) RSH: Solar cell shunt resistance (Ω)
B. Arduino Uno:
[image:3.595.315.541.65.239.2]Arduino/Genuine Uno is a microcontroller board based on the ATmega328P. It has 14 digital input/output pins (of which 6 can be used as PWM outputs), 6 analog inputs, A16 MHz ceramic resonator, a USB connection, a power jack, an ICSP header and a reset button. It contains everything needed to support the microcontroller; simply connect it to a computer with a USB cable or power it with an AC-to-DC adapter or with an external power supply it could be a battery to get started. The power source is select automatically when it uses external power supply it does not need the USB; it can come from an AC-to-DC adapter (wall-wart) or a battery.
Fig. 3: ATMega328
The adapter can be connected by plugging a 2.1mm centre-positive plug into the board's power jack. Leads from a battery can be inserted in the Gnd and Vin pin headers of the POWER connector. The board can operate on an external supply of 6 to 20 volts. If supplied with less than 7V, however, the 5V pin may supply less than five volts and the board may be unstable. If using more than 12V, the voltage regulator may overheat and damage the board. The recommended range is 7 to 12 volts. The power pins of Arduino Uno are VIN, 5V, 3V3, GND.
1) Connection
[image:3.595.45.291.285.468.2]In this the centre pin of the LDR1 is connected to the port A0 and the LDR2 is connected to the port A1 of the arduino Uno board the other pins of the LDR1 and LDR2 are connected to the ground and the 5v dc supply. It is connected in such way One end of LDR 1 is connected to the 5 volts and other end is connected to the resistor of 1k ohm to the ground. The data pin is taken from the between connection of the LDR and resistor to the A0 pin of the arduino Uno board as same LDR1 one end of LDR 2 is connected to the 5 volts and other end is connected to the resistor of 1k ohm to the ground. The data pin is taken from the between connection of the LDR and resistor to the A1 pin of the arduino Uno board the window has COM 5 as its port and also, we have here servo motor which connected to the arduino Uno the servo motor data pin is connected to the pin 9 of the arduino Uno board.
Fig. 4: connection of Arduino Uno
Other two pins of the servo motor are connected to the ground and 5-volt dc. For making the connection we used and need these electronic materials
CARDBOARD
GLUE GUN
DUCK TAPE
BAMBOO STICKS
METAL WIRE
CAN HOOKS
SPRAY PAINTS
C. Servomotor
Servo motors or servos are self-contained electric devices that rotate or push parts of a machine with great precision. Servos are found in many places: from toys to home electronics to cars and airplanes. The servo motor interfacing with to the arduino Uno board as the servomotor is tend move only up to 180 degrees so we will move it from 0 to180 degrees with the input of 0 to 5 volts by the LDR’s. As the LDR’s are moves the servomotor also has to move accordingly and in the same ratio of the movement or the angle given in the LDR’s.
D. LDR (LightDependent Resistor)
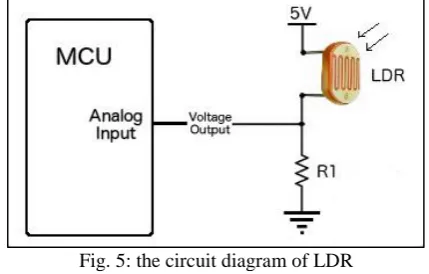
A Light Dependent Resistor (LDR) is also called a photoresistor or a cadmium sulphide (CdS) cell. It is also called a photoconductor. It is basically a photocell that works on the principle of photoconductivity. The passive component is basically a resistor whose resistance value decreases when the intensity of light decreases. This optoelectronic device is mostly used in light varying sensor circuit, and light and dark activated switching circuits.
Fig. 5: the circuit diagram of LDR
[image:3.595.320.535.602.739.2]efficiency of our system will increase and the output of our solar cells will be sufficient for our use.
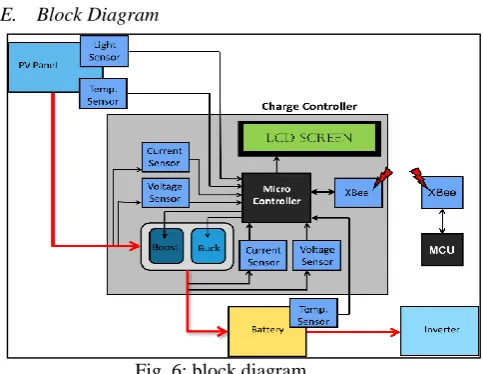
E. Block Diagram
Fig. 6: block diagram
This is our block diagram and in this block diagram we can see the microcontroller is the heart of our system. The solar panel is along with two sensors, temp sensor which is used to measure the temperature of the panel and light sensor or LDR which is used to track the sun light and these sensors are connected to the microcontroller, the solar panel provide the input to the current sensor and voltage sensor. the microcontroller measures the output of panel and display it on the LCD screen. Then according to the power level, it gives PWM input to buck converter which decides whether the solar panel is to be connected to battery or not for charging if the battery is empty or has low level of charge then it will start charging if it has high level of charge then it will not charging and directly support the load or use as load. Here the battery is connected to the load, the load MOSFET is given through the output of microcontroller whether it to connect the load to the battery or disconnect it from battery, according the level of the battery which is sensed by the voltage sensor and its output is provided to the microcontroller.
IV. PERTURB AND OBSERVE METHOD
Perturb and observe method of MPPT algorithm is generally used for it is easy implementation. In the P&O method the power is measured by change in the voltage by a small amount from the solar panel by the controller. If in case, the power increases and the adjustments are tried to be done in that particular direction until the power stop to increase. This method we call the Perturb and Observe(P&O) method. The perturb and observe method can case increase in the oscillations of power output, but still it is one of the most commonly used method. this method depends upon the rise in the power curve against voltage below it is maximum power point and the fall which is above that particular point, this method is referred to as the Hill Climbing Method. This algorithm of Perturb and Observe increases or decreases the output terminal voltage of the solar Cell periodically and then it simultaneously compares the power obtained from the current cycle with the power obtained in the previous cycle. If the value of power is comparatively more than the previous value of it, then it indicates that it has moved the operating point closer to the maximum power point (MPP). Thus,
further voltage perturbations if in the same direction, should move the operating point, even closer to the MPP. If the power decreases, the operating point moves away from the Maximum Power Point (MPP), and the direction of the perturbation has to be changed and reversed to move back towards the MPP. The P&O has two main disadvantages. First, in this algorithm the amplitude of the perturbations applied to the system is the main factor determining the amplitude of oscillations as well as the convergence rate of the output power to the MPP. The larger the perturbations the faster the algorithm will find the MPP. Nevertheless, a larger perturbation will lead to a higher value of oscillation amplitude. If the applied perturbations are too small, on the other hand, the oscillations around the MPP will be reduced, but the rate of convergence will decrease as well. In other words, in this algorithm there is a trade-off between the rate of response and the amount of oscillations under steady state conditions.
[image:4.595.45.287.95.282.2]V. METHODOLOGY
Fig. 7: the algorithm of P&O
Fig. 8: the complete diagram of MPPT
(voltage sensor, current sensor and temperature sensor) and also, we have a fan for testing the output of our system.
VI. CHARGE CONTROLLER
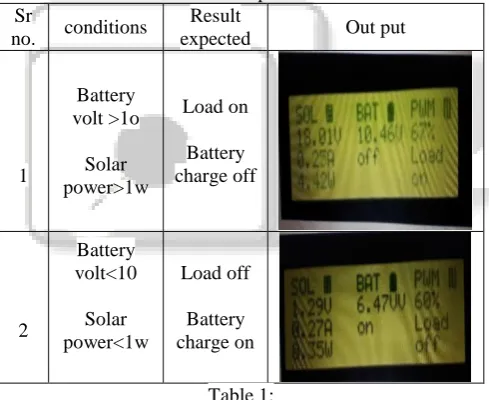
In a nowadays we have different kind of solar charge controller in the market with different technologies, rage and different shapes, according to technology there is two types of solar charge controllers PWM and MPPT the performance of them is very different from each other. the main job of the charge controller is managing the power of the solar system, as it is manages the power going into the battery bank from the solar panel or solar array and It ensures that the deep cycle batteries are not overcharged during the day, and that the power doesn’t run backwards to the solar panels overnight and drain the batteries or the batteries not discharging completely which reduce the life of the batteries. Also, we have some charge controller with additional capabilities like lighting, controlling the loads which is available in the market due to over the years we will have the different types of charge controller with best features which increase the efficiency of our systems. Here we can show the status of charge controller through the LCD. Through the LCD we show the status of the battery and the load which come into the action either the battery or the load. Here we have two columns which discuss about or procedure.
Sr
no. conditions
Result
expected Out put
1
Battery volt >1o
Solar power>1w
Load on
Battery charge off
2
Battery volt<10
Solar power<1w
Load off
[image:5.595.307.548.69.261.2]Battery charge on
Table 1:
Here in the table.1 the first Row shows that when the Voltage of the battery is greater than 10v (B-V>10V) and the Power of the system is greater than 1W (S-P>10W), then the entire supply goes to the load so Load is turned ON and the battery charging remains OFF. The second-row states that when the battery voltage is less than 10v (B-V<10V) and the power of the system is less than 1w (S-P<1W) then the load is turn off and the battery charging get starts.
VII. RESULT
After doing that all procedure and connecting that all equipment’s to each other the MPPT curve was achieve at different time of the day. The PV curve was plotted against of the resistive load characteristics and due to that the maximum power point was tracked. The observation of this project is achieved as below.
V-I characteristics of PV cells
Group-1(at 8:00 AM) VIN1=17.05V IIN1=0.39 Group-2(at 10:00 AM) VIN2=18.40 IIN2=0.45 Group-3(at 01:00 AM) VIN3=20.02 IIN3=0.50 Load
Fig. 9: I-V and load characteristics of PV
Here we recorded the amount of voltage and current due to various intervals of time during a day
Group-1(at 8:00 AM) Group-2(at 10:00 AM) Group-3(at 01:00 AM)
Fig. 10: PV characteristic
VIII. CONCLUSION
After all difficulties finally I got the MPP and the curve of it, this was a low cost project and with limiting laboratory equipment’s but it can effect the solar power generation for a small photovoltic systems to produce a small amount of DC load’s. This type of MPPT system can be used for charging of computer and mobile batteries. The prototype model is designed in Proteus software and implement it on hardware, develop this technology for more energy efficiency in the future. All effects are base in current sensors are so efficient, the connection of this project is so simple and it can be simply used, but this project a little costly for under development countries such as Afghanistan, India, Pakistan, Nepal and other Asian countries. For better efficiency you always require to use a complete microcontroller circuit with a complete development kit for microcontroller otherwise you will get less energy and your system will be less efficient.
REFERENCES
[image:5.595.46.291.358.558.2]Abubakar Siddik1, Sabbir Ahamed1,” Design and Implementation of a Microcontroller Based 12V-7A/10A Smart Solar Battery Charge Controller”. [2] “Adjusting PWM Frequencies” Arduino Playground –
Timer PWM Cheat sheet. (n.d.).
[3] Alberti, H. E., & Ghani, M. A. (2014, March 26). “Custom Maximum Power Point Tracker
[4] “Advantages and disadvantages of a solar tracker system” (2015, January). Retrieved
[5] Alberti, H. E., & Ghani, M. A. (2014, March 26). “Custom Maximum Power Point Tracker Major Qualifying Project” Retrieved October 17, 2016, from https://web.wpi.edu/Pubs/Eproject/Available/E-project-
032114-223145/unrestricted/Maximum_Power_Point_Tracker.p df
[6] “Arduino – Read Analog Voltage” (n.d.). Retrieved
January 10, 2017, from
https://www.arduino.cc/en/Tutorial/ReadAnalogVoltage [7] Richard J. Comp, "Practical Photovoltaics: Electricity
from Solar Cells", 2nd edition (pp.15-17), 2011. [8] D. K. Sharma, Purohit G, “Advanced Perturbation and
Observation (P&O) based Maximum Power Point Tracking (MPPT) of a Solar Photo-Voltaic System”, 5th International Conference on Power Electronics, India, 6- 8 December, 2012.