A Novel Technique of Steganalysis in
Uncompressed Image through Zipf’s Law
Laimeche Lakhdar
Department of Computer ScienceUniversity Cheik Laarbi Tbessi Tebessa, Algeria
Hayet Farida Merouani
Computer Research LaboratoryUniversity Badji Mokhtar Annaba, Algeria
ABSTRACT
In this paper, we present a Novel method to detect the existence of hidden message in LSB steganography. The key element of the proposed method is the power Law: Zipf’s law.The detection theory is based on statistical analysis of pixel patterns using a Zipfness measure between successive bit planes. The basic idea is that, the correlation between bit planes as well as the binary texture characteristics within the bit planes will differ between a stego image and a cover image. The seventh and eighth bit planes, and possibly others, are used to calculate the Zipf Quality (ZQ) measure. The proposed technique does not need a reference image and it works with spatial transform-domain embedding. The method is similar to steganalysis in [12]; it exploits Binary Similarity measures of images to reveal the presence of steganographic content.
General Terms
Security, Verification.
Keywords
Information hiding, Steganography, LSB insertion, Steganalysis, Zipf’s Law, Zipf Quality.
1.
INTRODUCTION
Information hiding seeks to hide information, of what so ever kind, in another support, which can be a text, image, audio or video medium. Applications of information hiding are characterized by their aims, in steganography; the goal is to hide a message in a numerical support to make it possible to two partners to communicate in a secret way. The support does not have any relation with the message to send. Watermarking consists of insertion a mark which is related to a numerical support. It is used for protection of copyright, protection of copies, indexing and integrity checking of the document. If the inserted mark in a numerical support is different for all copies from the basic support, we speak, then, about the fingerprinting, the principal goal is to trace back the source of illegal copy.
Although the objectives are distinct, these three approaches share common points. A support for the dissimulation (its importance is related to the application), information (to insert message, mark or a print) and a key (for insertion, extraction or detection).
The difference between steganography and watermarking is that in the latter, we insert a mark in the support to protect the copyright or to checking the integrity of the document. Another important difference is at the level of the attacks, for steganography, the pirate seeks to detect the presence of message dissimulated in the support, while in watermarking; it will seek to clean the support of any possible mark.
Steganography and cryptography are often very close; however, they do not have the same aim, but we can say that these two disciplines are complementary. In the case of steganography, the communication is not encrypted. It cannot be detected by a third person; this last does not suspect that the communicating parts are exchanging messages. Cryptography makes it possible to establish a safe Connection between two communicating parts by encrypting the communication the fact that makes it incomprehensible for a third person.
Steganalysis is the art of discovering hidden data in cover objects; it consists to attacking the steganographic methods by detection, destruction, retrieval or modification of the encapsulated data [1].
In this paper, methods of steganalysis are briefly presented in section 2, then, we describe in section 3, Zipf’s law and how it is used in image processing. In section 4, we present our method of steganalysis. Section 5 is reserved to the experimental work, where 250 images are used. Finally this paper ends up, in a conclusion and the used references.
2.
METHODS OF STEGANALYSIS
Various methods exist to detect the stego images. The first of these methods called attacks of χ2
Steganalysis development generated new schemes of insertion. These schemes concern primarily JPEG format. OutGuess [4] is a universal steganographic scheme that embeds hidden information into the redundant bits of data sources. For JPEG images, it embeds messages in DCT domain by first identifying the redundant block DCT coefficients to be modified. To resist the steganalysis attacks, OutGuess correct the distortions introduced during insertion to preserve the original global histogram of the DCT coefficients after embeddings. The F5 algorithm for JPEG images was proposed by Westfeld [5] in 2001. F5 works on JPEG by modifying the block DCT coefficients to embed messages. Instead of flipping the LSBs of the DCT coefficients, it always reduces the absolute value of non-zero DCT AC coefficient by one. These two schemes were put in failure by Fridrich ([6], [7], [8]), these attacks lie on the modification of a certain macroscopic data of the image in the process of insertion. The details of these attacks are described in the case of OutGuess in [6] and in the case of F5 in [9].
Farid and al.[10] developed a universal blind detection scheme that can be applied to any steganographic scheme after proper training on database of cover images and stego images. He uses an optimal linear predictor for wavelet coefficients and calculates the first four moments of the distribution of the predictor error.
Avcibas and Memon [11] present a method of steganalysis on LSB schemes based quality’s metrics of the image by exploiting the idea that the distance from the stego-image with the noised image is more important than the distance from the cover image to the same noised image. An extension of this analysis is given in [12], which proposes to study the variations of certain correlations between existing statistical variables and between the various planes of bits.
Kobsi and al. [13], Present a method of steganalysis based on a set of statistical features of first order and the binary entropy. They used a multi-classifier, Artificial Neuron Network (ANN) and a Fisher Linear Discriminate (FLD).
In [14], we present a method of steganalysis on LSB schemes based Zipf’s Law which can be applied to any type of image. We have define a vector of characteristics, based on the statistical changes of the patterns present in the image (patterns of the pixels) to detect the presence of a possible hidden message. Fisher linear discriminant (FLD) is then used to find a threshold that separates stego-images from cover-images.
3.
ZIPF’S LAW
Zipf’s law is an empirical law, described by G.K Zipf (1949) [15]. It can be stated as follows: In a set of topologically structured symbols, the n_tuples of symbols are not organized in a random way. We can note that the frequencies F1,…, FR
of appearance of the n_tuples present M1,…, MR are in
relation to these patterns. More precisely, if we classify these symbols according to the decreasing orders of the frequencies,
Fσ (1)… Fσ(R) with i=1 to R, checks the fundamental formula:
𝐹𝜎 𝑅 = 𝐾 × 𝑅−∝ (1)
Where Fσ (R) is the frequency of the symbols numbered i and σ
(R) is the rank of the symbols characterizes the power law. This distribution in power law can be represented graphically in double logarithmic scale, with in abscissa the rank R of the patterns and in ordinate their frequency of appearance. Zipf’s law is totally new method in image analysis. Applications of Zipf’s law in this domain are for detecting artificial objects in natural environments (Y.Caron and al., 2002) [16] and measuring compressed image quality (N.Vincent and al., 2000) [17].
3.1
Adaptation to Images
The symbols for the checking of Zipf’s law are, thus, here the grayscales used to code the pixels. The n_tuples are selected us the continuation of the grayscales of the pixels belonging to patterns likely to take varied forms, for example of square patterns 3 × 3 or linear vertical 3 × 1, 7 × 1 or horizontal patterns 1 × 3, 1 × 7. This choice is determined by the type of pattern which we wish to seek: linear pattern or surface pattern.
Other sizes of patterns are possible; however, a larger size of the patterns would have as a consequence than each pattern would have only one weak probability of being found several times in the image, and the distribution of the frequencies of the patterns would not be truly significant. Moreover, a too large size of patterns would result in to increase the time of calculates. This is why the size of the patterns patterns for 3 × 3 seems to us to be a good choice for our proposal.
A first idea of coding would be to directly use the levels of gray of the image. However, the number of possible patterns in this case is 2569. With such a number of possible motifs, the probability of appearance of the same pattern several times, in an image is negligible. In front of this a large number of possible patterns, we opt for the use of other coding to reduce the number of different patterns from the image.
The type of coding used is that of the general rank method, used by Bi et al. [18]. The principle of coding consists, inside block 3 × 3, to number the pixels according to the grayscales classified in the order ascending of their value by affecting the same rank when the grayscales are of the same value. We assign value the 0 to the lowest grayscales, and we increment the value of a unit whatever the variation relative between two consecutive grayscales. Figure 1 shows the representation of a pattern coding by the general rank method. Right margins should be justified, not ragged.
(a) (b)
Fig 1 : Motif original (a), coded by general row method
255 107 20 40 25 39 25 12 8
7 6 2
5 3 4
4.
ZIPF’S LAW ANALYSIS TO DETECT
LSB INSERTION
Application of Zipf's Law have proven extremely useful in distribution of patterns histogram in image [19], measuring compressed image quality [17] and detecting artificial objects in natural environments [16].
The proposed method to detect LSB steganography is based on statistical distribution of image's patterns (patterns of pixels) using Zipf's Law.
One reason is that such distribution of image's patterns can be exploited to compute the Zipf Quality (ZQ), determined by Caron in [20], which can distinguish between cover images and stego images. We have chosen to use Zip’s law in our method of steganalysis for several reasons.
Avcibas & all [12] propose a method of steganalysis based on correlation between patterns in the different bit planes (7th bit planes and the 8th bit planes of binary
images). They proposed a pattern of four pixels. RS steganalysis [3] is based on portioning an image into a
set of horizontal patterns. Then a discrimination function f used to evaluate the homogeneity of each pattern. Methods proposed in [21], [22] and [23] are based on
statistical equability of sets of pixels. Each set of pixel includes patterns formed of two pixels separated by a distance d (d>1) in a particular direction θ (θ = 0).
Initially, we work on images in grayscale, but this will spread, quite naturally, component by component, with the colour image.
Analysing an image using Zipf's Law is defined as follows:
1. Scanning the image by a mask 3×3, then coding the patterns by the general rank method and assigning to each pattern distinct its frequency from appearance in the image.
2. These patterns are then classified in the decreasing order of their frequency of appearance.
3. Representation in a log-log plot of reference vs. rank, this later is called the Zipf curve. The result is a set of points aligned on a line whose slope is equal to - α according to the formula (1).
Figure 3 presents an example of Zipf curve obtained from a cover image (image Musada, figure 2 (a)) using the general rank method for coding the patterns. The insertion of a message in the LSBs plane is interpreted by different repartition of image patterns. The fact that results in a modification of the Zipf curve, as shown in figure 4, where the image was stegoed with Invisible Secret v4 (figure 2(b)).
We observe that the curves of two figures 3 and 4 are different, especially in their left part.
In the curve obtained with the stego image, the ordinate in the origin is decreased, which means that the frequency of appearance of the most present patterns in the stego image have decreased compared to the cover image; the size of the two images being identical.
[image:3.595.330.535.74.351.2](a) (b) Fig 2 : Original image (a), stegoed image (b)
Fig 3: Zipf Curve associated to image (a) Fig 4: Zipf Curve associated to image (b)
We can clarify the modification of repartition of image patterns by an example in figure 5, if a pattern which present
[image:3.595.328.534.412.593.2]List of patterns occurrence before embedding message
[image:4.595.58.295.83.414.2]……..
Fig 5: Repartition of image patterns before and after embedding message.
4.1
Zipf’s Quality (ZQ)
Application of Zipf’s law is based on statistical distribution of image's patterns (patterns of pixels). This law makes it possible to extract certain number of parameters (number of patterns present in image, the rank of each pattern, the slope of the straight lines, the ordinate at the origin of Zipf curve, the area under the Zipf curve) which can characterize the structure of image.
These parameters which translates to some degree the specific mark to each image represents a tool of a great interest to carry out discrimination between images.
In this direction, we calculate a measurement called ZQ (Zipf Quality) to determine the difference between two Zipf curves of two binary images of 7th and 8th bit plane. This formula was determined by Caron in the following way [19]:
𝑍𝑄 =𝑀1× 𝑀𝑖=1 log 𝐹𝑖 −log 𝐹′𝑖 log 𝐹𝑀 ×
𝑇 𝐿
𝑇′𝐿′× 𝑃 − 𝑃′ × 𝐵 (2)
In this formula
M: represent the number of patterns considered for calculating ZQ.
Fi: represent the number of patterns for rank i in the binary image of 7th bit plan.
F’i: represent the number of patterns for rank i in the binary image of 8th bit plan.
T and T’ represent the number of patterns which appear more than once in both images of 7th bit plan and 8th bit plan.
L and L’ are the full number of the patterns in images of 7th bit plan and 8th bit plan, including those which appear only once.
P and P' are the slopes of the straight lines approximating, within the least-squares regression method, the couples [ln R, ln Nσ (R)] of Zipf curves associated to binary images of7th bit plan and 8th bit plan. This value depends generally of the alignment quality of the Zipf curve, i.e., adequacy of Zipf's law to the image.
In [19], authors present a statistic study of present patterns in images. They proved that always a dominant pattern is present in natural images.
This later change the form of Zipf's curve, which implicate that the first point doesn't used to evaluate the global linearity of points curve and to compute the slope of the straight line.
B is the relationship between the ordinate at the origin of the Zipf curves associated to the binary images of 7th bit
plan and 8th bit plan.
After a large test with images of different nature, we observed that, if any test image is already stegoed with a message, the ordinate at the origin of Zipf curve decrease or increase compared to ordinate at origin of the cover image.
We present an example of Zipf curves in figure 6 of image "Lina" when different length of message bits is embedded by LSB insertion.
Fig 6: Zipf curves of image Lina with different length of message bits embedded by LSB
We observe that the ordinate at the origin of the curves associated to the stego images have increased compared to the cover image (decreased in some case).
The ordinate at the origin of Zipf curve associated to cover image is 2.3424 and to stego image are respectively, 2.4314, 2.6542, 2.6902 and 2.7716 with 5%, 10% , 25% and 50%
embedding, which means that the frequency of appearance of P1=345 P2=268 P3=199 ... Pn=1
P21 P22 P23 ... P2268
P1=345 P2=267 P3=200 ... Pn=1
P1=345 P2=267 P3=199 ... Pn=1 Pn+1=1
1
Possibility 2: List of patterns occurrence after embedding message
Pattern exist Novel pattern
Possibility 1: List of patterns occurrence after embedding message
0
P23 Pattern x
Bit Embedded
[image:4.595.319.535.458.642.2]the most present patterns in the stego image have decreased compared to the cover image.
We note that, the insertion of message in image is interpreted by a different repartition of image patterns which lead to a modificationof Zipf curve as shown in figure 6.
Parameter ZQ is higher if the distortion of binary images of stego image is more important and it is null if the two binary images are identical.
As an example, we have taken two 24 bit BMP images, figure 6, having wide variation in color composition and have experimented with stego images when different message bits are embedded by LSB insertion. The variation of ZQ value for both cover and stego images are compared in Table 1.
[image:5.595.325.547.107.319.2]
Fig. 6: image 0058-portrait and Bench-alex-34
Table 1. Experimental data to show the variation of the relative values of Zipf quality
It observed that, the value of Zipf Quality (ZQ) associated to stego image is always superior to the value of Zipf Quality (ZQ) associated to cover image (depend of the message length embedding) as shown in Table 1.
We can clarify the increase of ZQ (Zipf Quality) value of stego images by, the insertion of message in image is interpreted by different repartition of image patterns which lead to the modification of number of patterns present in image, the rank of each pattern, the slope of the straight lines, the ordinate at the origin of Zipf curve as shown in Table 2 and Table 3 and to the modification of Zipf curve as shown in figures 7, 8, 9 and 10.
However, the value of Zipf Quality (ZQ) associated to cover images is always approximately 0, which means that the number of patterns distinct having a same frequency of appearance of cover binary image of 7th bit planes is approximately equal to the number of patterns distinct having a same frequency of appearance associated to the binary image of 8th bit planes.
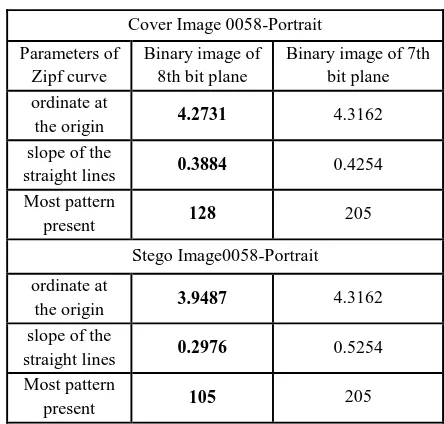
Table 2. Experimental data to show the modification of parameters Zipf’s curve of cover and stego binary image
[image:5.595.65.273.268.335.2]0058-portrait
Table 3. Experimental data to show the modification of parameters Zipf’s curve of binary and stego image
bench-alex-34
We observe, in figure 7, respectively in figure 8, that the difference between Zipf curves of binary images of 7th bit planes and 8th bit planes (value of ZQ) of cover image
0058-portrait, respectively Bench-alex-34, is small, which means that exist a bigger correlation between the two binary images.
However, in figure 9, respectively in figure 10, we observe that, the difference between Zipf curves of binary images of 7th bit planes and 8th bit planes (value of ZQ) of stego image 0058-portrait with 10%, respectively Bench-alex-34, increase as shown in Table 1 (depend of message length embedding), which means that the correlation between bit planes is a smaller than the correlation between bit planes of cover images.
Values of ZQ % of
embedding
Cover
image 5% 10% 15% 20%
Bench-alex-34 0.00096 0.0084 0.019 0.038 0.078
0058-portrait 0.00058 0.0021 0.012 0.023 0.059
Cover Image 0058-Portrait Parameters of
Zipf curve
Binary image of 8th bit plane
Binary image of 7th bit plane ordinate at
the origin 4.2731 4.3162
slope of the
straight lines 0.3884 0.4254
Most pattern
present 128 205
Stego Image0058-Portrait ordinate at
the origin 3.9487 4.3162
slope of the
straight lines 0.2976 0.5254
Most pattern
present 105 205
Cover image Bench-Alex-34 Parameters of
Zipf curve
Binary image of 8th bit plane
Binary image of 7th bit plane ordinate at
the origin 4.0813 4.2413
slope of the
straight lines 0.5018 0.5632
Most pattern
present 196 216
Stego image Bench-Alex-34 ordinate at
the origin 3.8977
4.2413
slope of the
straight lines 0.3536 0.5631
Most pattern
[image:5.595.325.548.367.579.2]In figures 7, 8, 9 and 10, the blue Zipf curves represent binary images of 7th bit planes of cover and stego images; it is observed that, there is no change of Zipf curves of 7th bit planes of cover images and stego images, respectively, parameters of Zipf curve of 7th bit planes as shown in table 2 and table 3, which mean that, insertion of message using LSB technique modify only the 8th bit planes as shown in figures 7, 8, 9, and 10 (red Zipf curve).
[image:6.595.61.259.180.330.2]Fig 7: Difference between Zipf curves of binary images of 7th and 8th bit planes of original image (0058-portrait)
Fig 8: Difference between Zipf curves of binary images of 7th and 8th bit planes of original image (Bench-alex-34)
[image:6.595.58.264.382.531.2]Fig 9: Difference between Zipf curves of binary images of 7th and 8th bit planes of original image (0058-portrait)
Fig 10: Difference between Zipf curves of binary images of 7th and 8th bit planes of original image (0058-portrait)
The value of Zipf Quality (ZQ) can now be properly threshold to distinguish a cover image from a stego one.
5.
EXPRIMENTS
To evaluate the usefulness of Zipf Quality (ZQ) to distinguish between cover images from stego images, an image database of 250 color images in 24-bit BMP format having (128*128) pixels including images with textures and fine details like lines and edges, and well-known images like Lina, Boat… A new database of 250 number of stego images when different length of message bits are embedded by LSB insertion. The ZQ (Zipf's Quality) value defined above is computed both for cover and stego database. The variation of ZQ is shown in figure 11.
Fig 11: ZQ values both cover and stego images.
In figure 11, we show how LSB steganography modifies LSB and 7-8 bit plane correlation. It observed that, the value of ZQ associated to cover images (red curve) is between 0% and 2%.
The increase of ZQ values of cover images happens as a random noise behaves as an embedded message.
[image:6.595.322.544.453.606.2] [image:6.595.56.263.582.734.2]Now, if we select the value of ZQ = 2% to differentiate between cover and stego images, this later declares a cover image as stego image (false alarm) and a stego image as cover image (false detection) as shown in figure 12.
Fig 12: ZQ values both cover and stego images with 5% embedding.
After prolonged testing with different kinds of cover and stego images, when different length of message bits are embedded by LSB insertion, is observed that, it's possible to find a threshold for ZQ which enables us reliably distinguish a cover image from an stego one. When no data is embedded, the most ZQ values are 0%; the highest is 2%. When a maximal length hidden message is embedded, the value of ZQ of stego images is always greater in comparison with the ZQ value of cover images as shown in figure 13. The value of ZQ remains perfect to differentiate between cover and stego images when the hidden message is only 10% of the maximum and this leads to only 9% false detection as shown in Table 4.
Even when a message only 5% of the maximum, the ZQ value still efficacy to differentiate between cover and stego images
[image:7.595.60.267.132.285.2]Fig 13: ZQ values both cover and stego images with different length of message bits embedding
Table 4. Experimental results showing the variation of False Detection Rate in case of ZQ = 2%
% of message bit insertion False Detection Rate
5% 14%
10% 9%
15% 3%
20% 0%
6.
CONCLUSION
In this paper, we have proposed a new technique of steganalysis for uncompressed images, which based on statistical distribution of image's patterns (patterns of pixels) using Zipfs’ Law. Our approach is based on statistical features extracted from the lower-order bit planes of images and benefits from the statistical deviation of distribution of image's patterns. This deviation can be exploited to compute a measure called Zipf Quality (ZQ), which can discriminate between cover images and stego images.
The experimental results suggest that it is possible to reliably detect the presence of secret message embedded in uncompressed images using LSB insertion technique. The reliability of detection depends on selection of threshold of ZQ. In this paper, we have selected the threshold heuristically based on difference between two binary images of 7th bit
planes and 8th bit planes of cover images. The work in this direction is in progress in our laboratory.
7.
REFERENCES
[1] Xuan, Z., HweeHwa, P., and Kian, L. 2004. Hiding Data Accesses in Steganographic File System. ICDE, 572-583.
[2] Andreas, W., Andreas, P. 1999. Attacks on steganographic systems. In 3rd Info. Hiding Workshop, Dresden, Germany, vol. 1768, vol. 1768.
[3] Fridrich, J., Goljan, M. and Du, R. 2001. Reliable Detection of LSB Steganography in Color and Grayscale Images. In ACM Workshop on Multimedia and Security, 27–30.
[4] Niels, P. 2001. Defending Against Statistical Steganalysis. In 10th USENIX Security Symposium, 323–336.
[5] Andreas, W. 2001. High Capacity Depsite Better Steganalysis: F5- a Steganographic Algorithm. In Fourth Information Hiding Workshop, 301–315.
[6] Fridrich, J., Miroslav, G. and Dorin, H. 2002. Attacking the Outguess. In ACM Workshop on Multimedia and Security.
[7] Goljan, M., Fridrich, J. and Dorin, H. 2003. New Methodology for Breaking Steganographic Methods for Jpegs. In EI SPIE, Santa Clara, CA.
False detection
[image:7.595.50.279.511.729.2][8] Fridrich, J., Goljan, M. and Soukal, D. 2003. Higher-order Statistical Steganalysis of Palette Images. In EI SPIE, Santa Clara, CA.
[9] Goljan, M., Fridrich, J. and Dorin, H. 2002. Steganalysis of Jpeg Images: Breaking the f5 Algorithm. In 5th Information Hiding Workshop.
[10] Farid, H. and Siwei, L. 2002. Detecting Hidden Messages using Higher-Order Statistics and Support Vector Machines. In Pre-proceedings 5th Information Hiding Workshop.
[11] Avcibas, I., Memon, N., and Sankur, B. 2001. Steganalysis using Image Quality Metrics. In Security and Watermarking of Multimedia Contents, SPIE. San Jose, CA.
[12] Avcibas, I., Memon, N., and Sankur, B. 2002. Image Steganalysis with Binary Similarity Measures. In IEEE International Conference on Image Processing, Rochester, New York.
[13] Kobsi N., Merouani, F.H. 2007. Neural Network Based Image Steganalysis: A Comparative study. In JIG’2007. Constantine, Algeria,
[14] Laimeche, L., Merouani, F.H. 2010. Detection Hidden Messages using Zipf's Law. 3rd International Conference on Software, Knowledge, Information Management and Applications (SKIMA’09) Fes, Morocco.
[15] ZIPF, G.K. 1949. Human Behavior and the Principle of "Least Effort". Addison-Wesley, New York.
[16] Caron, Y. , Makris, P., and Vincent, N. 2002. A Method for Detecting Artificial Objects in Natural
Environmements. International Conference on Pattern recognition (ICPR - IAPR), Québec (Canada). 600-603. [17] Vincent, N., Makris, P., and Brodier, J. 2000.
Compressed Image Quality and Zipf’s Law. Proceedings of International Conference on Signal Processing (ICSP – IFIC-IAPRWCC2000), Pékin (Chine). 1077-1084. [18] Bi, D., Asselin, J.P., and Mraghni, M. 1996. Spatial Gray
Levels Distribution based Unsupervised Texture Segmentation. Proceedings of 3rd International Conference of Signal Processing (ICSP96), Pékin (Chine).
[19] Makris, P., Vincent, N. 2000. Zipf’s law: a Tool for Image Characterization. Vision Interface'2000, Montreal (Canada). 262-268.
[20] Caron, Y., Vincent, N., and Makris, P. 2003. Measuring Compressed Image Quality using Zipf's Law. RFAI, CORESA’03, Lyon (France). 239-242.
[21] Memon, N., Chandramouli, R. 2001. Analysis of LSB Based Image Steganography techniques. In Proceedings of the International Conference on Image Processing, Thessaloniki Greece.
[22] Dumitrescu, S., Wu, X., and Wang, Z. 2003. Detection of LSB Steganography via Sample Pair Analysis. In IEEE transactions on Signal Processing. 1995-2007.