Human Identification based on Iris Recognition for
Distant Images
Shweta Arora
Mtech Student KIIT University, Patia Bhubaneswar, Odisha, India.
Narendra D. Londhe
Assistant Professor NIT Raipur,GE Road
Chhattisgarh, India.
Anuja Kumar Acharya
Assistant Professor KIIT University, Patia Bhubaneswar, Odisha ,India
ABSTRACT
Iris Recognition is one of the most powerful biometrically based technologies for human identification and verification that utilizes the iris patterns which exhibits uniqueness for every individual. In this manuscript, a new algorithm is proposed for iris recognition on distant images. The novelty of this algorithm includes recognition through iris patterns based on both the left and right eye of an individual so as to improve the recognition accuracy and computational efficiency. Experimental tests were performed using CASIA Iris Distance Database which a subset of CASIA V4 Database. The methodology found encouraging development in the field of Iris Recognition.
General Terms
Iris, Recognition, Security, Distance, CASIA.
Keywords
Iris Recognition System, Hough Transform, Hamming Distance
1.
INTRODUCTION
Human identification based on iris is becoming a famous tool rapidly as compared to other biometric recognition techniques due to its unique epigenetic pattern remains stable [1]. The rapid development in the field of digital image processing makes it very affordable and automated for digitized iris images. Evenly, the characterization and classification spatial iris patterns help to recognize the individual comfortably. The cornea and the eyelid act as a shield for the iris and protect it from adverse environmental effects. These in all inherent properties makes iris recognition as the most suitably security solution [2]. The very first automated iris recognition concept was given by Flom and Safir [3] in the year 1987 based on the fact that varying the illumination to force pupil to a predetermined size to overcome with the problem of contraction and expansion of pupil. But the imaging conditions they addressed were not that practical. Then the most widely used methodology was developed by Daugman [4], has used multi-scale quadrature wavelets to extract texture phase features of the iris to generate iris templates and compared the difference between a pair of those by computing their Hamming distance (HD). Another popular iris recognition system developed in the same year was Wildes' system[5] which also provides high accuracy. Wildes et al. have represented the iris pattern with a Laplacian pyramid constructed with four different resolution levels and has used
the normalized correlation to determine whether the input image and the test image are from the same class. Later, Boles and Boashash [6] have used 1-D wavelet transform for calculating zero-crossing representation at various resolution levels of a virtual circle on an iris image to characterize the texture of the iris. The current iris recognition techniques basically comprise four main stages: segmentation, normalization, feature extraction and matching.
2.
PROPOSED MODEL
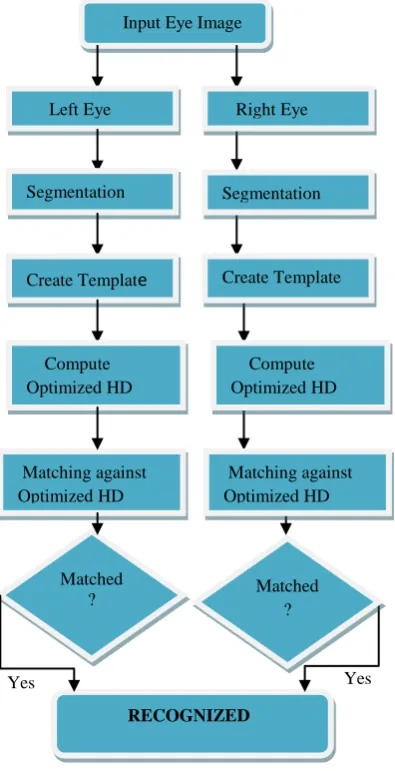
[image:2.595.63.261.211.597.2]The proposed model described below introduces a dual recognition technique where the iris patterns of both left and right eye are used for better recognition performance, since both the eyes carries distinguishable features which signifies its uniqueness. The most distinctive feature of this model which makes it different from the existing model is that recognition doesn’t rely purely on one eye. Therefore, if a person’s one eye fails to match, there is another opportunity through which person can be recognized.
Fig 1: Proposed Model
An individual is recognized even if any of the two eyes matches. Since, recognition is performed for both the eyes, the verification becomes undisputable. Both the eyes undergoes with the basic steps of an IRS(Iris Recognition System) which is implemented using John Daugman’s and Libor masek’s iris recognition method [10] and extends the study of eyes pattern for distance images. Matching is performed against the optimized HD value computed. Optimized HD value is decided on the basis of various parameters that monitors recognition rate.
3.
METHODOLOGY
An Iris Recognition System for distant images comprises mainly five stages- (1) Pre-Processing (2) Segmentation (3) Normalization (4) Encoding (5) Matching. The processing for both left and right eye is similar which undergoes through stages 2 to 5. These stages are discussed in detail below:
3.1
Pre-processing
[image:2.595.326.532.290.434.2]In this stage, an input eye image of an individual is taken. The image should provide an explicit view of left and right eye. The underlying motive behind is to extract the left and right eye from the input image. This is done through automatic cropping based on the manual distances calculated from localized pupil. Figure 1 shows input distance image obtained from CASIA IV database. Figure 3 shows the separated right and left eye from the input image.
Fig 2: Sample input image from CASIA Iris Distance Database which a subset of CASIA V4 Database
(a) (b)
Fig 3: Cropped right (a) and left (b) eye images from the sample input distance image.
3.2 Segmentation
The segmentation stage detects the pupillary and limbus boundaries to isolate the iris region from an input eye image. It also identifies regions where the eyelids and eyelashes interrupt the limbus boundary’s contour. It is implemented using circular Hough Transform. Hough transform for limbus boundary was performed first then for pupillary boundary to reduce the search area.
Step 1: Apply Canny edge detection to the input image resulting in an edge map.
Step 2: Vertical gradient is taken for iris/sclera boundary. Input Eye Image
Matching against Optimized HD Optimized HD
Matched ?
? Left Eye
Segmentation
Create Template
Compute Optimized HD
Right Eye
Segmentation
Create Template
Compute Optimized HD
RECOGNIZED
Matching against Optimized HD Optimized HD
Matched ?
?
[image:2.595.321.534.477.556.2]Step 3: Compute horizontal as well as vertical gradient for iris/pupil boundary.
Step 4: Choose in the Hough space using the resultant edge map, the radius and centre coordinates of the circle which is the corresponding to the maximum point in the Hough space. Circle parameters define the circle as follows:
(1)
Steps taken For Eyelid Isolation:
1. A line is fitted to the upper and lower eye lid using linear Hough transform.
2. The second horizontal line is drawn in such a way that intersects the first line at the iris edges which is closest to the pupil.
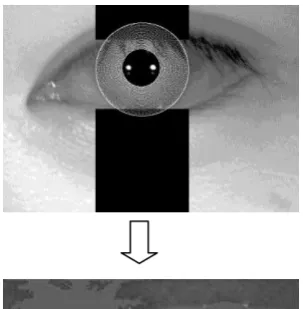
[image:3.595.308.533.70.281.2]For eyelashes isolation, thresholding technique was adopted from the perception that the eye lashes are the darkest region of an eye. Different thresholding values were chosen for left and right eye.
Fig 4: Stage of segmentation with eyelid isolation.
[image:3.595.56.280.325.441.2](a) (b)
Fig 5: Segmented right (a) and left (b) eye images from the sample input distance image. Black region denotes isolation of top and bottom eye lid.
3.3 Normalization
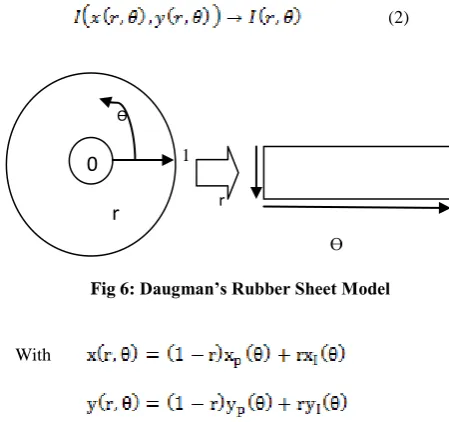
Normalization is implemented using Daugman’s rubber sheet model to transform iris texture from Cartesian to polar coordinates this process is also referred as iris unwrapping. It remaps every point within the iris region to polar coordinates (r, θ) where r is on the interval [0, 1] and θ is angle [0, 2π]. The remapping can be defined as
(2)
1
r
Ɵ Fig 6: Daugman’s Rubber Sheet Model
With
where I(x, y) is the iris region image, (x, y) are the original Cartesian coordinates, (r,θ) corresponding normalized polar coordinates, and xp, yp and x1, y1are the coordinates of the pupil and iris boundaries along the θ direction.
Pupil dilation and rotational inconsistencies are also taken into consideration by this model to produce a normalised representation with constant dimensions .For reference point centre of pupil was chosen and radial vectors pass through the iris region. A number of data points are selected along each radial line. It is not necessary that pupil is always concentric to the iris to deal with such cases remapping depending on the angle around the circle is required which can be defined as:
(3) With
where displacement of the centre of the pupil relative to the centre of the iris is given by Ox and Oy is the distance between the edge of the pupil and edge of the iris at an angle ,Ɵ around the region, and r1 is the radius of the iris. A constant number of points are chosen along each radial line. Backtracking is done for creating template to determine the Cartesian coordinates of data points from the radial and angular position in the normalized pattern. For the prevention of normalized pattern through the non-iris region, data points which occur along the pupil border or the iris border are discarded.
3.4. Feature Encoding and Matching
Every iris has distinctive feature that makes it distinguishable from others. Distinguishing features ranges from the overall shape of the iris to the distribution of tiny crypts and detailed texture. Only the significant features of the iris must be encoded so that comparisons between templates can be made. The template generated in the feature encoding process is required to be compared against a matching metric, which gives a measure of resemblance between two iris templates. Two kinds of comparisons are to be performed-inter-class
Ɵ
[image:3.595.66.270.477.559.2]
comparison and intra-class comparison .Intra-class comparison corresponds to comparing templates belonging to same eye whereas inter-class comparison corresponds to comparing templates generated from different eye. Intra-class comparison should lead to same ranges of values so that the two irises can be classified easily.
Fig 6: Normalization of the left eye
3.4.1 Feature Encoding
Our algorithm has performed the feature encoding by convolving the normalized iris pattern with 1D Log-Gabor wavelets. The rows of 2D normalized pattern are taken as 1D signal which is then convolved with 1D Gabor wavelet, where each row represents circular ring on iris region .The frequency response of the Log Gabor filter is given as:
(4)
where represents the centre frequency .and gives the bandwidth of the filter. The output of the encoding stage is a bitwise template containing a number of bits of information, and a corresponding noise mask which corresponds to corrupt areas within the iris pattern, and marks bits in the template as corrupt. The total number of bits in the template will be two times the number of filters used.
3.4.2 Matching
Hamming Distance was used as a matching metric for comparing two iris templates .For matching the bit patterns X and Y, the Hamming distance, HD, is defined as the sum of disagreeing bits (sum of the exclusive-OR between X and Y) over N, the total number of bits in the bit pattern. For computing HD with only significant bits, noise masking is merged with the Hamming Distance algorithm. Hamming Distance technique used for this system can be described mathematically as:
(5)
[image:4.595.321.548.236.456.2]Where and are two bit-wise templates to compare, and are the corresponding noise masks for and and N is the number of bits represented by each template. To deal with rotational consistencies, when the HD of two templates is calculated, one template is shifted left and right bit-wise and a number of HD values are calculated from successive shifts. From the calculated Hamming distance values ,only the lowest is taken, since this corresponds to the best match between two templates .The number of bits moved during each shift is given by two times the number of filters used, since each filter will generate two bits of information from one pixel of normalized region .Shifting process is described below:
Fig 7: Bit shifting process
4.
EXPERIMENTAL RESULTS
In order to evaluate the performance of the proposed algorithm, CASIA iris images V4.0 database is used. CASIA-IrisV4 is an extension of CASIA-IrisV3 containing six subsets which includes three new subsets and three subsets of CASIA-Iris V3.The experiments are performed using 10 subjects from CASIA Iris Distance subset. The iris images of CASIA-Iris-Distance were captured by a high resolution camera so both dual-eye iris and face patterns are included in the image region of interest. For each user, 5 images are processed for left eye and five images for right eye .Considering left and right eye as different classes, total number of classes are 20 and number of images processed are 100 .For eyelashes isolation, different threshold values were taken for both the eye. The corresponding thresholding value for left and right eye taken is 68 and 72 respectively. Iris Recognition System’s performance can be affected by number of parameters. So, it is a pre-requisite to choose the optimum value for these parameters to improve the efficiency of the system. These are mainly radial resolution(r),angular resolution(Ɵ) that yields number of data points for encoding each template and number of shifts used for dealing with rotational inconsistencies. Filter parameters used for feature
10 00 11 00 10 01 Template 1
Template 2
Template 1
Template 2
Template 1
Template 2
00 11 00 10 01 10
00 11 00 10 01 10
00 11 00 10 01 10
01 10 00 11 00 10
00 11 00 10 01 10
HD=0.83
HD=0.00
HD=0.00 Shifts 2 bits left
encoding comprises of number of filters used (N), base wavelength (λn), filter bandwidths (σ/f) and the multiplicative factor between centre wavelengths of successive filters (α). Optimum values chosen for these parameters are listed in the table below:
Table 1: Optimum parameters’ value
Parameters Optimum Value
Radian Resolution(r) 20 Angular Resolution( ) 240
Number of Filters(N) 1
Filter Bandwidth( ) 0.5
Base Wavelength( 18
Multiplicative Factor( ) 1
Template Size( ) 20 #480
The first test was conducted to ensure the uniqueness of the proposed system .It was ascertained by measuring the number of degree of freedom represented by the templates. Degree of Freedom, commonly termed as DOF depicts the complexity of iris patterns .It can be computed by approximating the collection of inter-class Hamming distance values as a binomial distribution. DOF can be defined as:
(6)
where p is the mean, and σ is the standard deviation of the distribution .The main motive of Iris Recognition System is to achieve a clear separation between Inter-class and Intra-class Hamming Distance Distribution. A separation HD value is selected defining the separation so that veracious decision can be made while comparing templates. There are basically two possibilities for decision making. Either HD value is less than separation value or HD value is greater than separation value. If HD value comes to be lesser than separation value, then the two templates are belonging to same iris. But, if HD value comes to be greater than separation value, it is concluded that both the templates are generated from the different irises. For measurement of separation, a new parameter known as decidability (d’) is used which gives the measure of the distance in standard deviations. It is a function of the magnitude of difference between the mean of the intra-class distribution μ
s, and the mean of the inter-class distribution μs
, and the standard deviation of the intra-class and inter-class distributions, σs and σd respectively. Decidability can be defined mathematically as:
(7)
Decidability is directly proportional to the separation value. The higher the decidability, the greater the separation value will be for inter-class and intra-class distribution. Even so, there may be some overlap between inter-class and intra-class distribution which results in false accept and false reject rates. The false reject rate (FRR), also known as Type I error measures the probability of an enrolled individual not being identified by the system. The false accept rate (FAR), also
known as Type II error measures the probability of an individual being wrongly identified as another individual. The false accept and false reject rates can be calculated by the amount of overlap between the inter-class and intra-class distributions. The false accept rate is defined by the normalised area between 0 and the separation point, κ, in the inter-class distribution Pdiff, given by:
(8)
The false reject rate is defined as the normalized area between the separation point, κ, and 1 in the intra-class distribution
,given by:
(9)
[image:5.595.328.527.351.698.2]It is obvious that the false accept rate and the false reject rate is influenced by the separation point. Hence, false accept rate as well as false reject rate should be taken into consideration while choosing separation point.
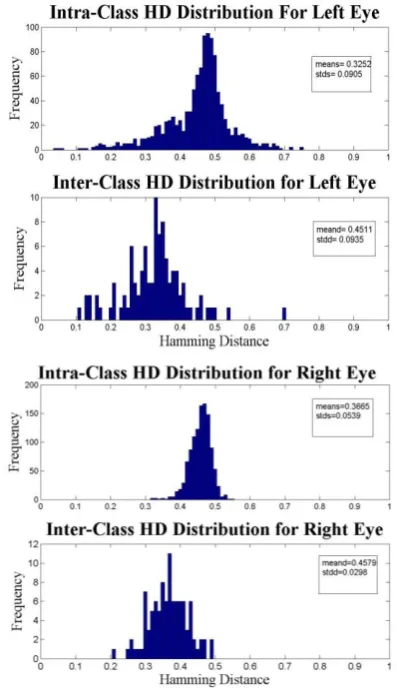
Fig 8: Distribution of intra-class and inter-class Hamming distances for left eye with 4 shifts left and right.
Fig 9: Distribution of intra-class and inter-class Hamming distances for Right eye with 4 shifts left and right.
accounts for rotational inconsistencies. As the number of shifts increases, the mean of the intra-class distribution decreases. Table 2 and 3 shows the effect of number of shifts to DOF, decidability and separation point for left and right eye respectively.
[image:6.595.57.543.159.382.2]From the below two Tables 2 and 3, it is quite evident that the decidability value and DOF for shift 2 is best for left eye and for shift 4 for right eye.
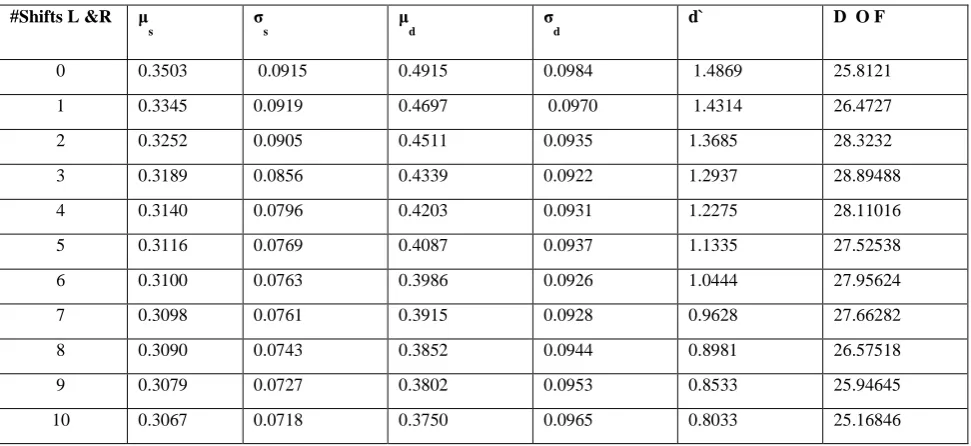
Table 2 Effect of shifts on Left eye from distance image
Table 3 Effect of shifts on Right eye from distance image
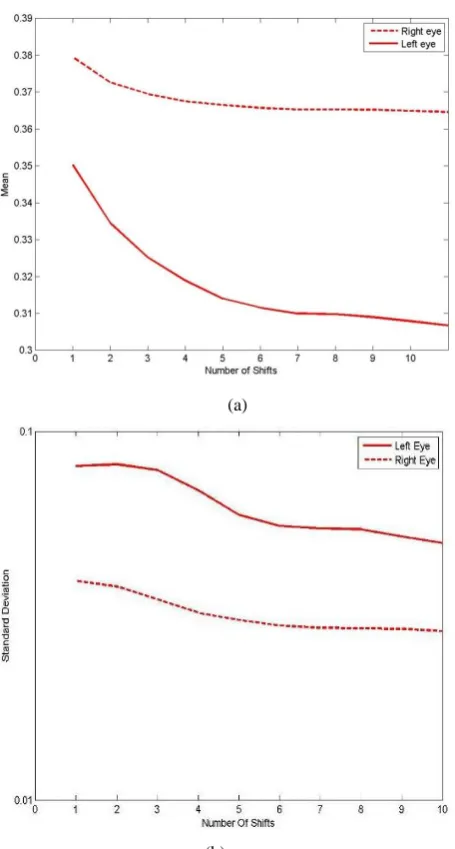
From the above Table 2 and 3, it is quite evident that the decidability value and DOF for shift 2 is best for left eye and for shift 4 for right eye. Figure 10(a) shows the effect of shifts provided on the mean HD and Figure 10(b) shows the effect of number of shifts on standard deviation. From Figure 10, it is quite notable that the mean HD calculated for right eye at various shifts reduces very speedily as compared to left eye. While the standard deviation remains same for the eyes showing very little more reduction in right eye as compared to left.
The accuracy of recognition with both the inter-class and intra-class distributions can be determined by calculating their false accept and false reject rates with different separation points.
#Shifts L &R μ
s
σ
s
μ
d
σ
d
d` D O F
0 0.3503 0.0915 0.4915 0.0984 1.4869 25.8121
1 0.3345 0.0919 0.4697 0.0970 1.4314 26.4727
2 0.3252 0.0905 0.4511 0.0935 1.3685 28.3232
3 0.3189 0.0856 0.4339 0.0922 1.2937 28.89488
4 0.3140 0.0796 0.4203 0.0931 1.2275 28.11016
5 0.3116 0.0769 0.4087 0.0937 1.1335 27.52538
6 0.3100 0.0763 0.3986 0.0926 1.0444 27.95624
7 0.3098 0.0761 0.3915 0.0928 0.9628 27.66282
8 0.3090 0.0743 0.3852 0.0944 0.8981 26.57518
9 0.3079 0.0727 0.3802 0.0953 0.8533 25.94645
10 0.3067 0.0718 0.3750 0.0965 0.8033 25.16846
#Shifts L &R μ
s
σ
s
μ
d
σ
d
d` D O F
0 0.3795 0.0635 0.4792 0.0359 1.9317 193.6417
1 0.3726 0.0621 0.4727 0.0348 1.9871 205.8187
2 0.3695 0.0589 0.4668 0.0332 2.0381 225.8109
3 0.3675 0.0557 0.4621 0.0314 2.0904 252.1031
4 0.3665 0.0539 0.4579 0.0298 2.0982 279.523
5 0.3657 0.0526 0.4545 0.0287 2.0935 300.9989
6 0.3653 0.0520 0.4517 0.0280 2.0670 315.9019
7 0.3653 0.0519 0.4493 0.0275 2.0230 327.1795
8 0.3652 0.0518 0.4475 0.0273 1.9906 331.7417
9 0.3649 0.0512 0.4460 0.0272 1.9813 333.9695
[image:6.595.57.548.418.612.2](a)
(b)
Fig10: (a) Mean vs number of shifts for intra-class distribution and (b) Standard deviation vs number of shifts for intra-class distribution
[image:7.595.59.287.69.494.2] [image:7.595.63.271.631.765.2]Table 4 and Table 5 shows the FAR and FRR for distinct threshold values. All the calculations are made using Table 1 parameters values and the number of shift is 2 for left eye and 4 for right eye.
Table 4: False accept and false reject rates for left eye with different separation points using the optimum parameters.
Threshold FAR FRR
0.15 0.1598 97.9711
0.20 0.6397 95.8290
.25 1.4790 91.6660
.30 3.4394 74.6110
.35 8.0648 46.3075
.45 30.8146 11.1385
.50 68.9568 3.8055
.55 87.4543 2.1433
Table 4: False accept and false reject rates for Right eye with different separation points using the optimum parameters.
Threshold FAR FRR
0.15 0 100.0000
0.20 0 100.0000
.25 0 98.7480
.30 0 93.4034
.35 0.3855 68.5306
.40 2.8556 32.9059
.45 32.6784 7.7179
.50 93.8471 0
.55 100.0000 0
The optimum threshold HD can be decided from the Table 4 and 5 for both left and right eyes respectively. By obesering the variations of FAR and FRR for both the eys, it is comes to notice that considerable maximum FAR and minimum FRR comes around threshold of 0.4 approximately for left eye. Similarly, for right eye, the optimum threshold comes around 0.4 approximately again. So, from the tests performed above, it can be observed that with 2 number of shifts we are getting the best recognition for left eye at separation point 0.40 and with 4 number of shifts we are getting the best recognition for right eye at separation point 0.40.
5.
CONCLUSION
It has been observed from Figure 8 and 9 that there is some overlap between intra-class and inter-class hamming distance distributions as a function of number of shifts. Separation point which drives the accuracy of the recognition is found to be 0.40 for both the eyes. There is no stability found in the FAR and FRR after the threshold point as suggested and derived by Libor Masek for iris segmentation of CASIA I dataset. The iris segmentation must be poor which leads to poor feature extraction. The cropped right and left eye image resolutions are getting disturbed and show poor features in the created templates.
Finally, it has been concluded that the recognition process using the dual iris was not stronger due to poor segmentation and feature extraction on distant images. In addition to this the strong solution for disturbances created by eyelids and eyelashes is also needed.
6.
REFERENCES
[1] R. Wildes. Iris recognition: an emerging biometric technology. Proceedings IEEE, Vol. 85, No. 9, 1997. [2] Y. Zhu, T. Tan, Y. Wang. Biometric personal
identification based on iris patterns. Proceedings of the 15th International Conference on Pattern Recognition, Spain, Vol. 2, 2000.
[4] J. Daugman. Biometric personal identification system based on iris analysis. United States Patent, Patent Number: 5,291,560, 1994.
[5] R. Wildes, J. Asmuth, G. Green, S. Hsu, R. Kolczynski, J. Matey, S. McBride. A system for automated iris recognition. Proceedings IEEE Workshop on Applications of Computer Vision, Sarasota, FL, pp. 121-128, 1994.
[6] W.W. Boles, B. Boashah: A Human Identification Technique Using Images of the Iris and Wavelet Transform. IEEE Transaction on Signal Processing Vol. 46, 1185-1188, 1998.
[7] J. R. Matey, et al., "Iris on the Move: Acquisition of Images for Iris Recognition in Less Constrained
Environments," Proceedings of the IEEE, vol. 94, pp. 1936-1947, 2006.
[8] C. Fancourt, et al., "Iris recognition at a distance," in Audio and Video Based Biometric Person Authentication, Proceedings. vol. 3546, T. Kanade, et al., Eds., ed Berlin: Springer-Verlag Berlin, 2005, pp. 1-13.
[9] F. Bashir, et al., "Eagle-Eyes: A System for Iris Recognition at a Distance," in Technologies for Homeland Security, 2008 IEEE Conference on, 2008, pp. 426-431.