Intelligent ECG Signal Noise Removal using PSONN
Sara Moein
Faculty of Engineering, Multimedia University, 63100
Cyberjaya, Malaysia
Rajasvaran Logeswaran
Faculty of Engineering, Multimedia University, 63100
Cyberjaya, Malaysia & School of Engineering, Science
and Technology, Nilai University College, 71800 Nilai,
Negeri Sembilan, Malaysia
ABSTRACT
The electrocardiogram (ECG) signal is susceptible to noise and artifacts and it is essential to remove the noise in order to support any decision making for specialist and automatic heart disorder diagnosis systems. In this paper, the use of Particle Swarm Optimization Neural Network (PSONN) for automatically identifying the cutoff frequency of ECG signal for low-pass filtering is investigated. Generally, the spectrums of the ECG signal are extracted from four classes: normal sinus rhythm, atrial fibrillation, arrhythmia and supraventricular. Baseline wander is removed using the moving median filter. A dataset of the extracted features of the ECG spectrums is used to train the PSONN. The performance of the PSONN with various parameters is investigated. The PSONN-identified cutoff frequency is applied to a Finite Impulse Response (FIR) filter and the resulting signal is evaluated against the original clean and conventional filtered ECG signals. The results show that the intelligent PSONN-based system successfully denoised the ECG signals more effectively than the conventional method.
Keywords
Cutoff frequency, Particle Swarm Optimization Neural Network (PSONN), Low-pass filtering, Finite Impulse Response (FIR).
1.
INTRODUCTION
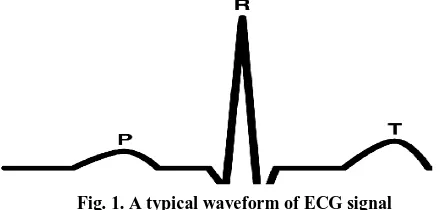
The measurement of the electrical activity of the heart (cardiac) muscle is called electrocardiogram (ECG). As the heart performs its function of pumping blood through the circulatory system, the result of the mechanical events within the heart is the generation of a certain sequence of electrical events [1]. The ECG signal waveform consists of the P wave, QRS wave and T wave, as sketched in Fig.1. For computerized interpretation systems and for the human electrocardiographer, it is vital to access accurate measurements of ECG intervals and critical points (e.g. P, QRS, T). The morphology of ECG signal has been used for recognizing heart activity; therefore, it is very important to obtain the parameters of clear ECG signals without noise [2, 3]. ECG provides valuable information to diagnose heart disorders and the ischemic changes that may occur, such as the myocardial infarction, conduction defects and arrhythmia [4]. Therefore, the ECG signal must be clearly represented
[image:1.595.311.531.285.390.2]body, respiration and muscle contractions [5]. The produced noise consists of low-frequency components that cause baseline wander, and high-frequency components such as
Fig. 1. A typical waveform of ECG signal
power-line interference [3]. ECG noise removal is complicated due to the time varying nature of ECG signals. In noise removal, it is necessary to identify the cutoff frequency of the filter. However, this is difficult to determine and improper treatment may introduce additional artifacts to the signal, especially on the QRS wave.
Although there are many new methods for noise removal, most noise removal systems for ECG signals use the band-pass filter because of simplicity in implementation and requiring minimal coefficients [6-12]. The important consideration of this popular technique is in automatically identifying the correct pass bands in the frequency spectrum. The intelligent methods commonly applied include artificial neural networks (ANN), Swarm Intelligence (SI), Support Vector Machine (SVM) etc. The next section provides a brief review on some recent noise removal methods.
2.
BACKGROUND
ECG signal noise removal has been discussed in many research works [13-20]. In [13], Independent Component Analysis (ICA) is used for analysis to remove the artifacts and noise from ECG recordings and the reconstructed ECG signals were compared with the original ECG signal and the results showed that there was a significant improvement in signal quality, i.e. signal-to-noise ration (SNR). Zhang and Sui [14] proposed a method based on morphological filtering and wavelets to eliminate the noise in ECG signals and increase the diagnosis efficiency.
10 ANN was introduced [16]. The proposed method consists of a
simple structure similar to the Multiple ADAptive LINear Element (MADALINE) neural network.
Poungponsri and Yu (2009) used the wavelet neural network (WNN) for ECG signal modeling and noise reduction [18]. The WNN built combined the multiresolution nature of wavelets and the adaptive learning ability of ANN, and was trained by a hybrid algorithm that includes the Adaptive Diversity Learning Particle Swarm Optimization (ADLPSO) and the gradient descent optimization.
Previous studies have indicated that the neural network based methods present effective approaches for denoising ECG signals. There are also some algorithms for optimization of the ANN itself. A recent algorithm is the Particle Swarm Optimization (PSO) [20], which is adapted from decentralized and self-organized systems in nature, such as choreography of a flock of birds and school of fish. It is a population-based algorithm, in which individual particles work together to solve a given problem. In PSO, physical position is not an important factor. The population (or swarm) and the member particles are initialized by assigning random positions and velocities, and potential solutions are then ‘flown’ through the hyperspace [20].
With regards to filters for noise removal, there is insufficient research in the area of automated calculation of cutoff frequencies. This paper presents application of PSO in training the ANN to identify the optimal cutoff frequency for removal of the high frequency noise in ECG signals using an FIR filter. In this study, FIR [21] is preferred to the infinite impulse response (IIR) filter as IIR are more susceptible to problems of finite-length arithmetic [6]. Additionally, FIR filters are less complex and can be readily applied to ECG signals.
3.
PROPOSED METHODOLOGY
Fig. 2 shows the proposed approach. The main stages are described below.
3.1
Data Collection
The Physiobank archive of ECG signals [22], available for use by the biomedical research community, is used to test the proposed approach. 70 ECG signals were selected randomly from four databases: the MIT-BIH Supraventricular Arrhythmia Database, the MIT-BIH Normal Sinus Rhythm Database, the MIT-BIH Atrial Fibrillation Database and the MIT-BIH Arrhythmia Database. The sampling frequency of the first three databases was 250 Hz, while the signals of the forth database were sampled at 360 Hz.
Baseline wander makes manual and automatic analysis of ECG records difficult, especially in measuring of the ST segment deviation that is used for diagnostic ischemia. Respiration, electrode impedance changes and body movements cause baseline drift in the ECG signals. However, inaccurate baseline wander removal can cause distortion of important clinical information, particularly ST segment distortion, as there are overlaps in the spectrum of the baseline wander and low frequency components of the ECG signals [23].
An example of baseline wander removal is presented in Fig. 3. Fig. 3(a) shows the original ECG signal, where the cycles of the PQRST waveform appear to be attenuated by a sinusoidal waveform. As such, the first step is the attenuation correction for the removal of baseline wander. A popular practice by past researchers was to use a high-pass filter with a cutoff frequency of 1 Hz for this purpose [24-27]. Fig. 3(d) shows this conventionally corrected ECG signal.
As the moving median filter is known to be more efficient [7], it is applied in this work. The moving median filter takes a set of points, and given a span for the filter, takes a subset of those points, returning the median of the subset. The extracted baseline identified using the moving median filter is shown in Fig. 3(c). The resulting drift effects of baseline wander removal using the conventional and median filters are given in Fig. 3(e) and (f), respectively. In Fig. 3(f), the baseline wander is eliminated successfully, producing a virtually zero attenuation of the PQRST waveform, as shown in Fig. 3(g).
3.3
Spatial
to
Frequency
Domain
Transform
Removal of the baseline drift is followed by removal of high amplitude noise usually caused by specifications of natural noise by the electromygraphic interference [28]. Treatment in the frequency domain aids this task in terms of processing efficiency, and conversion via the Fast Fourier Transform (FFT) is described by (1) [6].
N n k i N
n n k
x
e
X
21
0
for
k
0
,...,
N
1
,0
n
N
(1)where
X
0
,....,
X
N
1
are complex numbers,N
is the number of samples,n
Fig. 2. Flow chart of the proposed method
The cutoff frequency (
c
) for the low-pass filtering is normalized to
, as follows:
s
c
f
(2)
where
f
s
is the sampling frequency.The frequency spectrum of half of the symmetricf
s
250
Hz signal in Fig. 3(a) is given in Fig. 3(d). The result after the intelligent automated filtering is given in Fig. 3(h) and the final clean signal is given in Fig. 3(i). The details of the filtering are given in the next sections.3.4 Feature Extraction
The particles or inputs of the PSONN are determined by the features of the dataset. Analysis of the ECG signal, taking into account minimal complexity in computation, revealed that two common statistical measures (standard deviation and variance) would suffice. Standard deviation and variance are commonly used for measuring the dispersion. There is an advantage of using the variance as it is the sum of squaring the difference between each value and the mean. The squaring makes each term positive, so that the values more than mean do not cancel values below the mean. Because the variance is squared, the unit of data is not the same as the unit of variance [29]. Therefore, the square root of the variance, i.e. the standard deviation, is used as the second feature for the proposed dataset.
A sample of the value classes in the dataset are given in Table 1. The third column of the table lists the approximate
3.5 PSONN Configuration
In the study by Eberhart et al. [30], it was proven that particles in hyperspace keep track of the best fitness position achieved. For each particle, this is known as their personal best (pbest), while for the overall population, it is known as the global best (gbest). Each particle is accelerated toward its pbest and gbest in each epoch by calculating the velocity term based on position and distance. The ‘personal’ and ‘global’ velocities are then randomly weighted to produce the new velocity value for this particle, which will in turn affect the next position of the particle during the next epoch [31-32]. The movement and velocity update equations are given by (3) and (4), respectively [30].
t
v
x
x
n
n
n
(3)where
x
n
is the position of particlen
,
v
n
is the velocity of particlen
,
t
is the time interval of the movement.
)
(
()
)
(
()
, 2
, 1
n n best
n n best n
n
x
p
rand
c
x
g
rand
c
wv
v
(4)
where
c
1
andc
2
are acceleration constants,
w
is the inertia weight parameter. Input:Noisy ECG signal
Noisy ECG signal
Baseline drift attenuation
ot noitamrofsnnarT niamod ycnauqerf
Feature
Extraction Apply identified cutoff in FIR filter
Particle 1
Particle 2
.
.
Particle n
Feedforward neural network
Minimize learning error
Initial Particles
Update velocity and position of particles by
PSO
Train the Particles PSONN Configuration
Output:
[image:3.595.84.494.97.328.2]12 multiplied with the acceleration constants (
c
1
andc
2
areusually set to 2). The process of updating should be performed
for each element of the velocity vector. Particles move randomly around the solution space, controlled by the random numbers in (3). The acceleration constants (
c
1
andc
2
) provide some control as to which path (gbest or pbest) should be given emphasis. PSONN uses the feedforward neural network to produce the learning error (particle fitness) based on a set of weights and biases (PSO positions) [33]. To find the lowest learning errors for pbest and gbest, (4) is updated to produce a value for position adjustments to the targeted learning error. Adding the calculated velocity value to the current position value produces the new sets of positions (neural network weights and biases), which are then used for determining the new learning errors (particle fitness) in PSONN. This process is repeated until the stop conditions (minimum learning error or maximum number of iterations) are met.The PSONN employed to calculate the cutoff frequency is a 3 layer feedforward network. The population size used was 25, with the default value of 2 for the maximum velocity divisor,
1
c
andc
2
.3.6
FIR Implementation
Implementation of the FIR filter requires three parameters: the
cutoff frequency (
c
), the filter order (N
) and the window size. The filter order primarily determines the width of the transition band. Higher orders give sharper cutoff in the frequency response [21], therefore, the desired sharpness will determine the filtering order. The default window is the Hamming of sizeN
1
. The FIR filter (w
) is represented by (5) [21].)
2
cos(
46
.
0
54
.
0
N
n
w
n
for
0
n
N
(5)The cutoff frequency must be identified for the ECG signal to be filtered. The next section provides the test results achieved for automatic identification of the cutoff frequency by the PSONN and the FIR filter in denoising the ECG signals.
4.
EXPERIMENTS AND RESULTS
The proposed system performance using the configured PSONN is tested by measuring various parameters. The FIR is implemented with the cutoff frequency identified by the PSONN and the results are evaluated against the clean and conventionally filtered ECG signals.
Due to the lack of cases in the configured dataset, validity testing of the results was undertaken using a k-folding method with k=3. For each of the k times of NN training, 60% of the samples in the dataset were used for training with the non-overlapping 40% for testing. All the reported results are obtained by averaging the outcomes of three separate tests.
4.1
Test with Clean Signal
Clean signals would allow for more accurate evaluation of the effectiveness of the proposed method in terms of
noise, and there is no access to actual clean signals, pseudo-clean signals from the ECG generator of the MIT-BIH database [22] are used. The noisy versions of those pseudo-clean signals are simulated by adding a small value of high frequency components of random noise to mimic the natural noise by the electromygraphic interference which corrupts real ECG signals.
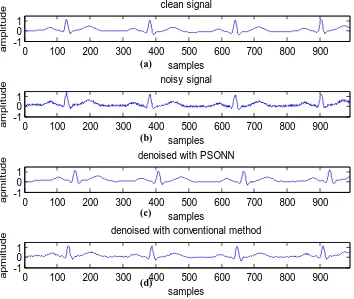
Fig. 4 and Fig. 5 show two examples of the tested clean ECG signals. For the ECG signal spectrum in Fig 4., the standard deviation and mean are 43.54 and 15.32, respectively. For Fig. 5, the standard deviation is 68.29 and the mean is 13.86. The trained PSONN gives the cutoff frequency of 14% and 17% for the first and second ECG signals, respectively. For both figures, part (a) is the pseudo-clean signal, (b) is the signal corrupted by random noise and (c) shows the result of FIR filtering with the cutoff calculated by the proposed method using PSONN. Comparing the pseudo-clean and PSONN filtered ECG signals in both figures show that PSONN can very smoothly filter the high frequency noise and has acceptable performance for ECG noise removal.
4.2
MSE Performance
The mean squared error (MSE) is measured for varying numbers of hidden nodes and number of training epochs. To decrease the complexity of the network and increase training speed, less nodes in the hidden layer is preferred [34]. The MSE equation is given by (6).
1
0
2
)
(
1
Nn n n
t
y
N
MSE
(6)where
y
n
is the output of the network,t
n
is the desired target,N
is the number of test records.(b) ECG signal frequency spectrum
(c) Baseline wander of original signal
(d) Conventional drift attenuation
Fig. 3. ECG signal drift attenuation
(e) Baseline wander of conventional attenuation
(f) Wander removal by median filter
(g) Resulting baseline by median filter
(h) Frequency spectrum after low-passfiltering
[image:5.595.60.510.91.768.2]14
4.3
Testing
of
PSONN
against
Conventional Filter
The results of FIR filtering by the calculated cutoff frequency are compared with the results of FIR low-pass filtering based on previous studies [8-11]. In these studies, the cutoff frequency for the ECG low-pass filtering was 100 Hz, where all frequencies above 100 Hz are eliminated to remove high
frequency noise. For fairness in evaluation, the baseline drift has been attenuated for all the test signals using the moving median filter, instead of just using a 1 Hz high-pass filter as per the norm, since it is has been shown in Fig. 3 that the moving median filter is better suited for baseline wander removal.
[image:6.595.75.509.118.605.2]The cutoff frequency is dynamic. Therefore, for various ECG signals, the cutoff frequency would be different due to the biometric characteristics of the ECG signal. In [35-37], the ECG signals varied from person to person. Therefore, it is obvious that the frequency spectrum would be different for Table 1. Part of dataset for training the PSONN
Normalized
c FFT StandardDeviation FFT Variance
Signal type No.
0.60
4.53
20.57
Arrhythmia
1
0.80
4.1
16.82
Arrhythmia
2
0.60
6.43
45.23
Arrhythmia
3
0.60
11.4
130.15
Arrhythmia
4
0.33
16.31
266.03
Arrhythmia
5
0.22
8.98
80.75
Supraventricular
6
0.33
6.92
47.91
Supraventricular
7
0.22
38.59
1489.5
Supraventricular
8
0.33
21.54
464.21
Supraventricular
9
0.60
6.87
47.21
Atrial Fibrillation
11
0.33
14.03
196.98
Atrial Fibrillation
12
0.80
32.93
1085
Atrial Fibrillation
13
0.60
13.11
100.2
Atrial Fibrillation
14
0.60
15.3
900.23
Atrial Fibrillation
15
0.11
9.47
89.77
Normal ECG
16
0.11
14.32
205.15
Normal ECG
17
0.22
6.28
39.47
Normal ECG
18
0.22
7.94
63.14
Normal ECG
19
0.33
15.91
253.39
Normal ECG
each person and the applied cutoff frequency has to vary, instead of being fitted as in the classical low-pass filter where 100 Hz is used as the constant threshold. Fig. 4(d) and Fig. 5(d) show results of the conventional based filtering of ECG. It presents that compared to the PSONN, the conventional method has low effectiveness in removing the high frequency noise in ECG signals, as little smoothness is observed in the
filtered ECG.
5.
CONCLUSION
This paper has shown that PSONN is a reliable and fast solution for automatically identifying the cutoff frequency, that can converge in less than 1000 training epochs. The results show that the PSONN is better able to remove the noise than the conventional method. Also, comparing the clean and PSONN filtered signals presents that the proposed method is promising for use by medical experts who wish to diagnose heart disorders using ECG.
6.
REFERENCES
[1] Karl G.R., Isis A.W., Roberto L., Hakan N., Fetal ECG waveform analysis, Best Practice & Research: Clinical Obstet Gynae, 2004; 18 (3), pp. 485-514.
[2] Robert M., Ian R.G. The effects of noise on computerized electrocardiogram measurements, J Electrocardiol 2006; 39 (4), pp.165-173.
[3] Behbahani S., Investigation of adaptive filtering for noise cancellation in ECG signals, 2nd Intl Multi-Symp Comp Comput Sci, IEEE Computer Society, 2007; pp. 144-149.
[4] Yan S., Kap L.C., Shankar M.K., ECG signal conditioning by morphological filtering, J Comp Bio, 2002; 32 (16), pp. 465-479.
0
100
200
300
400
500
600
700
800
900
-1
0
1
clean signal
samples
a
m
p
li
tu
d
e
0
100
200
300
400
500
600
700
800
900
-1
0
1
noisy signal
a
m
p
li
tu
d
e
samples
0
100
200
300
400
500
600
700
800
900
-1
0
1
denoised with PSONN
a
p
m
il
tu
d
e
samples
0
100
200
300
400
500
600
700
800
900
-1
0
1
denoised with conventional method
a
p
m
il
tu
d
e
[image:7.595.108.462.315.614.2]samples
Fig. 4. Test results with pseudo-clean ECG signal
(a)
(b)
(c)
16
Fig. 6. Performance of PSONN with 3, 5, 10 and 15 nodes in the
hidden layer for 25000 epochs of training
0 100 200 300 400 500 600 700 800 900 -10
1
clean signal
samples
a
m
p
lit
u
d
e
0 100 200 300 400 500 600 700 800 900 -1
0 1
noisy signal
a
m
p
lit
u
d
e
samples
0 100 200 300 400 500 600 700 800 900 -10
1
denoised with PSONN
a
p
m
ilt
u
d
e
samples
0 100 200 300 400 500 600 700 800 900 -1
0 1
denoised with conventional method
a
p
m
ilt
u
d
e
[image:8.595.106.477.434.746.2]samples
Fig. 5. Test results with another pseudo-clean ECG
signamethod
(a)
(b)
(c)
[5] Fitzgibbon E., Berger R., Tsitlik J., Halperin H.R., Determination of the noise source in the electrocardiogram during cardiopulmonary resuscitation, Med Care Medicine, 2002; 30 (4), pp. 148-153.
[6] Losada R.A., Design finite impulse response digital filters, Part II. Microwaves & RF, 2004; 43, pp. 70-84.
[7] Orfanidis S.J., Introduction to Signal Processing, Upper Saddle River, New Jersey: Prentice Hall; 1996.
[8] Lian Y., Hoo P.C., Digital elliptic filter application for noise reduction in ECG signal, WSEAS Trans Electron, 2006; 3 (1), pp. 65-70.
[9] Engin M., ECG beat classification using neuro-fuzzy network, Pattern Recogn Lett, 2004; 25 (15), pp. 1715-1722.
[10]Minami K., Nakajima H., Toyoshima T., Real-time discrimination of ventricular tachyarrhythmia with Fourier transform neural network, IEEE Trans Biomed Eng, 1999; 46 (2), pp. 179–185.
[11]Lin H., Wensheng H., Xiaolin Z., Chenglin P., Recognition of ECG patterns using artificial neural network, Sixth IEEE Intl Conf Intell, Sys Design and Appl (ISDA'06), Jinan, 2006; pp. 477-481.
[12]Naghsh-Nilchi A.R., Kadkhodamohammadi A.R., Cardiac arrhythmias classification method based on MUSIC morphological descriptors, and neural network, EURASIP J Adv Sig Process, 2008, Article ID 935907.
[13]Chawla M.P.S., A comparative analysis of principal component and independent component techniques for electrocardiograms, Neural Comput & Applic, 2009, 18 (6), pp. 539-556.
[14]Zhang D., Sui W., Noise Reduction of ECG Signal Based on Morphological Filtering and WT, Key Eng Mat, 2010; 439-440, pp. 12-16.
[15]Sotos J.M., Sanchez C., Mateo J., Alcaraz R., Vaya C., Rieta J.J., Neural networks based approach to remove baseline drift in biomedical signals, 11th Mediterr Conf Med Biomed Eng Comput 2007 IFMBE Proc, 2007;16 (2), pp. 90-93.
[16]Sotos J.M., Meléndez C.S., Salort C.V., Abad R.C., Ibáñez J.J.R., A learning based Widrow-Hoff Delta algorithm for noise reduction in biomedical signals, Bio-inspired Modeling of Cognitive Tasks, LNCS, 2007; 4527, pp. 377-386.
[17]Sadik K., Mustafa O., Atrial fibrillation classification with artificial neural networks, Pat Recogn, 2007, 40 (11), pp. 2967-2973
[18]Poungponsri S., Yu X.H., Electrocardiogram (ECG) signal modeling and noise reduction using wavelet neural networks, Proc IEEE Intl Conf Autom Logistics, Shenyang, China, 2009; pp. 394-398.
[19]Mehmet K., Ali. N. A new arrhythmia clustering technique based on Ant Colony Optimization, Biomed Inform, 2008; 41 (6); pp. 874-881.
[20]Ferguson D., Particle Swarm, University of Victoria,
[22]Physionet, Physiologic signal archives for biomedical research, A database for heart signals, Cambridge, MA,
(Updated: 27 April 2009)
www.physionet.org/physiobank, [accessed on: 10 September 2010].
[23]Roger A., Hans-Jakob S., Meet the challenge of high-pass filter and ST-segment requirements with a DC-coupled digital electrocardiogram amplifier, J Electrocardiol, 2009; 46 (6), pp. 574-579.
[24]Ziarani A.K., Konrad A., A nonlinear adaptive method of elimination of power line interferences in ECG signals, IEEE Trans Biomed Eng, 2004; 49 (6), pp. 540-547.
[25]Ling B.W.K., Ho C.Y.F., Lam H.K., Wong T.P.L., Chan A.Y.P., Tam P.K.S., Fuzzy rule based multiwavelet ECG signal denoising, IEEE World Cong Comput Intell, Hong Kong, 2008; pp. 1064-1068.
[26] Willems J.L., Arnaud P., A reference data base for multi-lead electrocardiographic computer measurement programs, J Am Coll Cardiol, 1987; 10 (6), pp. 1313-1321.
[27]Chang K.M., Arrhythmia ECG Noise Reduction by Ensemble Empirical Mode Decomposition, Sensors in Biomechanics and Biomedicine, 2010; pp. 6064-6080.
[28]Yan S., Kap L.C., Shankar M. K., ECG signal conditioning by morphological filtering, Comput in Bio Med, 2002; 32 (6), pp. 465-479.
[29]Murray R.S., Larry J.S., Schaum's Outline of Statistics, 3rd edition, Mc Graw Hill Book Company, Singapore; 2003.
[30]Eberhart, R., Shi, Y., Particle Swarm Optimization: Developments, Application and Resources, IEEE Congr. Evol. Comput., Seoul, Korea , May, 2001; pp. 81-86.
[31]Van d.B., Engelbrecht A.P., Cooperative learning in neural networks using Particle Swarm Optimizers, South African Comput, 2000; 26, pp. 84-90.
[32] Ying P. C., Pei J., Analysis of particle interaction in particle swarm optimization, Theoretical Comput Sci, 2010, 411 (21), pp. 2101-2115.
[33]Mehmet K., Berat D., ECG beat classification using particle swarm optimization and radial basis function neural network, Expert Sys with Appl, 2010, 37 (12), pp. 7563-7569.
[34]Hassoun M.H., Fundamentals of Artificial Neural Network, MIT; 1995.
[35]Sornmo L., Laguna P., Bioelectrical Signal Processing in Cardiac and Neurological Applications, Academic Press, 688 pages; 2005.
[36]Konstantinos N.P., Dimitrios H., Jimmy K.M.L., ECG biometric recognition without fiducial detection, IEEE Biometrics Symp, Baltimore, MD; 2006.