Comparative of Data Mining Classification Algorithm
(CDMCA) in Diabetes Disease Prediction
V.Karthikeyani
, PhD.Assistant Professor, Department of Computer
Science, Thiruvalluvar Government Arts College, Rasipuram,
India
I.Parvin Begum
,Assistant Professor, Department of Computer
Application, Soka Ikeda College of Arts and Science, Chennai-99,
Tamilnadu, India,
K.Tajudin
,Assistant Professor, Department of Computer
Science, The New College, Royapettah,
Chennai-600014, Tamilnadu, India,
I.Shahina Begam
Assistant Professor, Department of Computer
Science, Ratankanwar Bhawarlal Gothi Jain
College for Women,
Chennai-600052, India.
ABSTRACT
Data mining is an iterative development within which evolution is defined by discovery, through either usual or manual methods. In this paper using the data mining concept to CDMCA classifies two types supervised and unsupervised classifications. Here illustrate the classification of supervised data mining algorithms base on diabetes disease dataset. It encompass the diseases plasma glucose at least mentioned value. The research describes algorithmic discussion of C4.5, SVM, K-NN, PNN, BLR, MLR, CRT, CS-CRT, PLS-DA and PLS-LDA. Here used to compare the performance of computing time, precision value and the data evaluated using 10 fold Cross Validation error rate, the error rate focuses True Positive, True Negative, False Positive and False Negative and Accuracy. The outcome CS-CRT algorithm best. The Best results are achieved by using Tanagra tool. Tanagra is data mining matching set. The accuracy is calculate based on addition of true positive and true negative followed by the division of all possibilities.
Keywords
C4.5, SVM, K-NN, PNN, BLR, MLR, CRT, CS-CRT, PLS-DA, PLS-LPLS-DA, Classification based on CT, Precision value, CV error rate and Accuracy.
1.
INTRODUCTION
The significance and Uses of Data Mining in Medicine despite the differences and clash in approaches, the health sector has more need for data mining today[1][15]. There are quite a lot of arguments that could be sophisticated to support the use of data mining in the health sector (Data overload, early detection and/or avoidance of diseases, Evidence-based medicine and prevention of hospital errors. Non-invasive finding and decision support, Policy-making in public health and additional value for money and price savings). Tanagra is more powerful, it contains some supervised learning but also other paradigms such as clustering, supervised learning, meta supervised learning, feature selection, data visualization supervised learning assessment, statistics, feature selection and construction algorithms. The main reason of Tanagra development is to give researchers and students an easy-to-use data mining software, meeting the requirements to the in attendance norm of the software development in this domain, and allow to examine either real or unreal data. Tanagra can exist measured as a educational tool for knowledge encoding techniques [14].
Data surplus there is a wealth of knowledge to be gained from computerized physical condition records [15] up till now the vast bulk of data stored in these databases makes it exceptionally difficult information.
Diabetes is not a newly born disease, it has been with human race from long back but, came to knew about it in 1552 B.C. Since this period, many of Greek as well French physicians had worked on it and made us aware of the nature of disease, organs responsible for it etc. In 1870s, a French physician had discover a link between Diabetes and diet in take, and an idea to prepare individual diet plan.
Diabetic diet was formulated with inclusion of milk, oats and other fiber containing foods in 1900-1915. Function of insulin, its nature, along with its use started from 1920 -1923, discovered by Dr. Banting, Prof. Macleod and Dr .Collip, who were awarded the Noble prize. In the decade of 1940, it has been discovered that different organs like kidney and skin are also affected if diabetes is creeping for a long term.
The main technical objective in KDD development is to design for Data Mining. In addition to the construction, it is also intended to address the process-related issues. It is assumed that the execution of the Data Mining technology would be dealing out, memory and data demanding task as in opposition to one that require continuous interaction with the database.
2. DATA ANALYSIS
The most important methodology use for this paper throughout the analysis of journals and publications in the field of medicine. The explore focused on more recent publications.
The data study consists of diabetes dataset. It includes name of the attribute as well as the explanation of the attributes. Indian Council of medical Research–Indian Diabetes (ICMR-INDIAB) study has provides data from three states and one Union Territory, representing nearly 18.1 percent of the nation’s population.
The occurrences of pre-diabetes (impair fasting glucose and/or impair glucose tolerance) was 8.3 percent, 12.8 percent, 8.1 percent, 14.6 percent correspondingly.
[image:2.595.316.546.69.246.2]Nineteen years to the lead of that deadline, India has 62.4 million, and further 77.2 million (potential diabetes) in the pre-diabetes period. According to the diabetes atlas of 2009, there were 50.8 million people with diabetes in India.
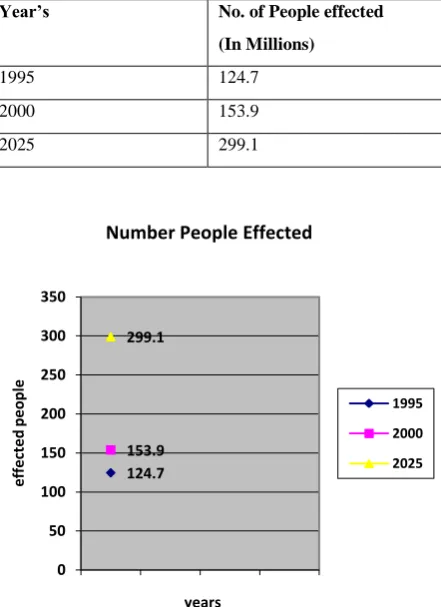
Table 1 Increasing occurrence of Diabetes: India
Diabetes Effected & estimated details in India
Year’s No. of People effected
(In Millions)
1995 124.7
2000 153.9
2025 299.1
The chart express the increase prevalence of diabetes in India, approximation in 2025 299.1 millions of people effect in diabetes. The occurrence of diabetes in Tamilnadu was 10.4 percent, in Maharashtra it was 8.4 percent, in Jharkhand 5.3 percent, and in terms of percentage, highest in Chandigarh at 13.6 percent.
Prediabetes is a condition when patient blood sugar level triggers higher than normal, but not so high that we can validate it as type 2 diabetes. Gestational diabetes is a form of diabetes which affects pregnant women. It is thought that the hormones created during pregnancy reduce a woman's receptivity to insulin, leading to high blood sugar levels. Gestational diabetes affects on 4% of all pregnant women
3. ALGORITHMS USED
3.1 C4.5
Decision trees are controlling categorization algorithms. Accepted decision tree algorithms consist of C4.5, CRT, and CS-CRT. At the equivalent time as the name imply, this performance recursively separate inspection in branches to build tree for the purpose of improving the calculation accuracy.
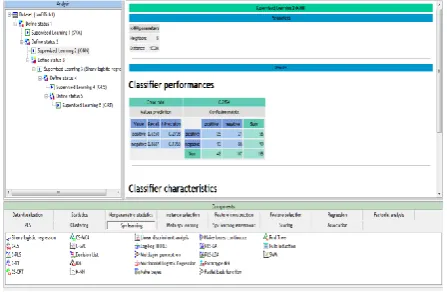
Figure 1: Screen shot for C4.5 classifier performance and error rate
3.2 SVM
Support vector machines (SVM). Support vector machines are a moderately new-fangled type of learning algorithm, originally introduced. Naturally, SVM aim at pointed for the hyper plane that most excellent separates the classes of data. SVMs have confirmed the capability not only to accurately separate entities into correct classes, but also to identify instance whose establish classification is not supported by data. Although SVM are comparatively insensitive define distribution of training examples of each class.
[image:2.595.60.281.190.494.2]SVM can be simply extended to perform numerical calculations. Two such extension, the first is to extend SVM to execute regression analysis, where the goal is to produce a linear function that can fairly accurate that target function. An extra extension is to learn to rank elements rather than producing a classification for individual elements. Ranking can be reduced to comparing pairs of instance and producing a +1 estimate if the pair is in the correct ranking order in addition to −1 otherwise.
Figure 2: Screen shot for SVM classifier performance and error rate
3.3 KNN
The nearest neighbour algorithm. The K-nearest neighbour’s algorithm is a technique for classifying objects based on the next training data in the feature space. It is among simplest of all mechanism learning algorithms [8].
The algorithm operates on a set of d-dimensional vectors, D =
{xi | i = 1. . . N}, where xi ∈ kd denotes the i th data point.
The algorithm is initialized by selection k points in kdas the
124.7 153.9 299.1
0 50 100 150 200 250 300 350
e
ff
e
ct
e
d
pe
ople
years
Number People Effected
1995
2000
[image:2.595.320.537.495.634.2]initial k cluster representatives or “centroids”. Techniques for
select these primary seeds include sampling at random from the dataset, setting them as the solution of clustering a small
subset of the data or perturbing the global mean of the data k
times[4]. Then the algorithm iterates between two steps till junction:
Step 1: Data Assignment each data point is assign to its
adjoiningcentroid, with ties broken arbitrarily. This results in
a partitioning of the data.
[image:3.595.317.545.204.343.2]Step 2: Relocation of “means”. Each group representative is relocating to the center (mean) of all data points assign to it. If the data points come with a possibility measure (Weights), then the relocation is to the expectations (weighted mean) of the data partitions.
Figure 3: Screen shot of Classifier performance and error rate for k-NN.
“Kernelize” k-means though margins between clusters are still linear in the embedded high-dimensional space, they can become non-linear when projected back to the original space, thus allowing kernel k-means to deal with more complex clusters.
Dhillon et al. have shown a close connection between kernel k-means and spectral clustering. The K-medoid algorithm is similar to k-means except that the centroids have to belong to the data set being clustered. Fuzzy c-means is also similar, except that it computes fuzzy membership functions for each clusters rather than a hard one.
3.4 PNN
Prototype NN classification is an easy to understand and easy to implement classification techniques. Despite its simplicity, it can perform well in many situations.
The new prototype p be simply the average vector of pl and p2, or the average vector of weighted pl and p2. The-class of the new prototype is the same as the one of pl and p2. Continue the merging process until the number of incorrect classifications of patterns in T starts to increase.
3.5 BLR
Predictive analysis in health care primarily to determine which patients are at risk of developing certain conditions, like diabetes, asthma, heart disease and other lifetime illnesses. Additionally, sophisticated clinical decision support systems incorporate predictive analytics to support medical decision making at the point of care. Logistic regression is a
generalization of linear regression [28]. It is used primarily for predicting binary or multi-class dependent variables. 3.6 Multinomial Logistic Regression (MLR)
A multinomial logit (MNL) model, also known as
[image:3.595.54.278.251.397.2]multinomial logistic regression, is a regression model which generalizes logistic regression by allowing more than two discrete outcomes. That is, it is a model that is used to predict the probabilities of the different possible outcomes of a categorically distributed dependent variable given a set of independent variables (which may be real-valued, binary-valued, categorical-binary-valued, etc.).
Figure 4: Screen shot for BLR & MLR overall effect
An extension of the binary logistic model cases where the dependent variable has more than two categories is the multinomial logistic Regression. In such cases collapsing the data into two categories not make good sense or lead to loss in the richness of the data. The multinomial logit model is the appropriate technique in these cases, especially when the dependent variable categories are not ordered. Multinomial regression to include feature selection/importance methods. 3.7 C-RT
CART [7] a very accepted classification tree (says also decision tree) learning algorithm. Rightly, CART incorporate all the ingredient of a good learning control: the post-pruning procedure enable to make the substitution between the bias and the variance; the cost complexity mechanism enables to "smooth" the looking at of the space of solutions, control the first choice for ease with the standard error rule (SE-rule) etc.The Breiman's algorithm is provided under different designations in the free data mining tools. Tanagra uses the "C-RT" name [3].
CR-T consists of two sets one is Growing set and another one is Pruning set. Growing set decreases as the number of leaves increases cannot use this information to select the right model. Use Pruning to choose the best model. The tree minimizes the error rate on the Pruning set [7].
3.8 CS-CRT
Figure 5: Screen shot for C-RT & CS-CRT with tree description
They provide a set of rules that can apply to a new (unclassified) dataset to predict which records will have a given ending. CART segment a dataset by create two way split while CHAID segment using chi square tests to create multi-way splits. CART classically requires fewer data training than CHAID.
Shafer et al, 1996, Decision tree induction is one of the classification techniques used in decision support systems and machine learning process. With decision tree technique the training data set is recursively partitioned using depth- first (Hunt’s method) or breadth-first greedy technique.
Mehta et al, 1996, Decision tree model is preferred among other classification algorithms because it is an eager learning algorithm and easy to implement. Decision tree algorithms can be implemented serially or in parallel. In spite of the performance method adopted, most decision tree algorithms in literature are constructed in two phases: tree growth and tree pruning phase. Tree pruning is an important part of decision tree construction as it is used improving the
classification/prediction accuracy by ensure that the constructed tree model.
3.9 PLS-DA & PLS-LDA
PLS Regression for Classification Task PLS (Partial Least Squares Regression) Regression can be viewed as a multivariate regression framework where to predict the values of several PLS-LDA (Partial Least squares-Linear Discriminant Analysis target variables (Y1, Y2 …) from the values of several input variables (X1,X2,…)[5][6].
Figure 6: Screen shot for PLS-LDA classifier performance
The algorithm use three axis for the diabetes disease is the following: The components of X are used to predict the scores on the Y components, and the predicted Y component scores are used to predict the actual values of the Y variables. In constructing the principal components of X, the PLS algorithm iteratively maximizes the strength of the relation of successive pairs of X and Y component scores by maximizing the covariance of each X-score with the Y variables.
The PLS Regression is initially defined for the prediction of continuous target variable. But it seems it can be useful in the supervised learning problem where we want to predict the values of discrete attributes. In this tutorial we propose a few variants of PLS Regression adapted to the prediction of discrete variable. The generic name "PLS-DA" (Partial Least Square Discriminant Analysis) is often used in the literature. To predict the values of the dependent variable for unseen instances (or unlabeled instances) from the observed values on the independent variables. The process is rather basic if handle a linear regression model. Apply the computed parameters on the unseen instances.
4. RESEARCH FINDINGS
4.1. Data mining in the diabetes disease Prediction
Ten different supervised classification algorithms i.e. C4.5, SVM, K-NN, PNN, BLR, MLR, CRT, CS-CRT, PLS-DA, PLS-LDA have been used analyze dataset in. Tanagra tool is powerful system that contains clustering, supervised learning, Meta supervised learning, feature selection, data visualization supervised learning assessment, statistics, feature selection and construction algorithms.
4.2. Data source
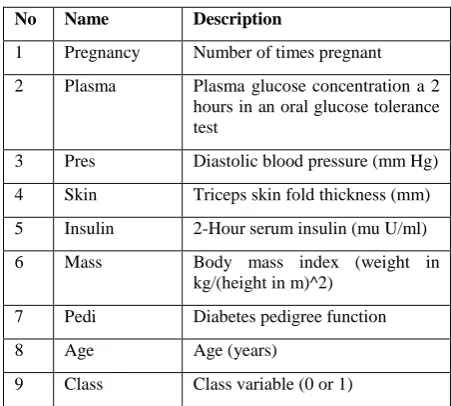
[image:4.595.321.547.478.681.2]To evaluate these data mining classification Pima Indian Diabetes Dataset was used. The dataset has 9 attributes and 768 instances.
Table 2. Attributes of diabetes dataset
No Name Description
1 Pregnancy Number of times pregnant 2 Plasma Plasma glucose concentration a 2
hours in an oral glucose tolerance test
3 Pres Diastolic blood pressure (mm Hg) 4 Skin Triceps skin fold thickness (mm) 5 Insulin 2-Hour serum insulin (mu U/ml)
6 Mass Body mass index (weight in
kg/(height in m)^2) 7 Pedi Diabetes pedigree function
8 Age Age (years)
9 Class Class variable (0 or 1)
[image:4.595.56.287.590.728.2]4.3. Performance study of algorithms
[image:5.595.331.555.81.322.2]The table 2 consists of values of different classification. According to these values the lowest computing time (<550ms) can be determined.
Table 4. Performance study of Algorithm
Algorithm used
Time
Taken
Accuracy
%
Positive
Recall
Error
Rate
C4.5 550 86 0.38 0.28
SVM 546 74.8 0.3684 0.29
K-NN 640 78 0.4737 0.34
PNN 546 67 0.4815 0.34
BLR 515 75 0.3725 0.2733
MLR 530 75 0.3725 0.2733
CRT 515 85 0.5 0.36
CS-CRT 531 86 0.119 0.36
PLS-DA 452 76 0.3137 0.2667
PLS-LDA 593 73 0.3077 0.2667
[image:5.595.49.279.155.372.2]SVM, PNN, BLR, MLR, CRT, CS-CRT, PLS-DA in a lowest computing time that we have experimented with a dataset. A distinguished confusion matrix was obtained to calculate sensitivity, specificity and accuracy. Confusion matrix is a matrix representation of the classification results. Table 3 shows confusion matrix.
Table 3. Confusion Matrix
Classified as
Healthy
Classified as not healthy
Actual Healthy
TP FN
Actual not
Healthy
FP TN
The below formula were used to calculate sensitivity, specificity and accuracy:
Sensitivity = TP / (TP+FN)
Specificity= TN / (TN+FP)
Accuracy= (TP+TN) / (TP+FP+TN+FN)
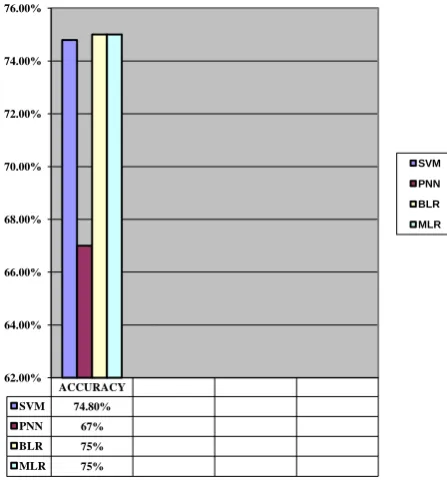
The table 4 consists of values of different classification. According to these values the accuracy was calculated. The figure 7 represents the resultant values of above classified dataset using data mining supervised classification algorithms and it shows the highest accuracy. It is logical from chart that compared on basis of performance and computing time, precision value and the data evaluated using 10 fold Cross CS-CRT algorithm shows the superior performance compared to other algorithms.
Figure 7: Predicted Accuracy
5.CONCLUSION
There are different data mining classification techniques can be used for the identification and prevention of diabetes disease among patients. In this paper ten classification techniques in data mining to predict diabetes disease in patients. They names are : C4.5, SVM, K-NN, PNN, BLR, MLR, CRT, CS-CRT, PLS-DA and PLS-LDA. These techniques are compared by using disease among patients. In this paper ten classification validation error rate (True Positive, True Negative, False Positive and False Negative) and Accuracy. Our studies first filtered ten algorithms based on lowest computing time SVM, PNN, BLR, MLR, CRT, CS-CRT and PLS-DA. The second one was highest accuracy above 85%. The CS-CRT algorithm best among tens. In the CS-CRT tree description number of nodes was 15 and number of leaves was eight the plasma value less than 161, mass value less than 28.95 then class ‘negative’ (97.22% of 36 examples), mass greater than equal to 28.95 and plasma less than 112 then class ‘negative’ (81.48% of 27 examples), insulin greater than equal to 160.5 then class ‘negative’ (100% of 4 examples), mass greater than are equal to 41.850 then class ‘positive’ (100% of 4 examples). They are used in various healthcare units all over the world. In future to improve the performance of these classification.
6. REFERENCES
[1] Jiawei Han and Micheline Kamber, “Data Mining Concepts and Techniques”, second edition, Morgan Kaufmann Publishers an imprint of Elsevier.
[2] Cover, T., Hart P.,1967, “Nearest Neighbour Pattern Classification”, IEEE Trans Inform Theory 13(1):21–27.
[3] Breiman, L., Friedman, J., Olsen,R., Stone, C., 1984. “Classification and Regression Trees”, Chapman & Hall.
[4] Dayle, L., Sampson, Tony J., Parker, Zee Upton, Cameron, P., Hurst, September, 2011. “Comparison of Methods for Classifying Clinical Samples Based on
ACCURACY
SVM 74.80%
PNN 67%
BLR 75%
MLR 75%
62.00% 64.00% 66.00% 68.00% 70.00% 72.00% 74.00% 76.00%
[image:5.595.47.281.458.543.2]Proteomics Data: A Case Study for Statistical and Machine and SIMCA classification, Journal of Chemo metrics”, 20(8–10), 341–351.
[5] Barker, M., & Rayens, W., 2003. “Partial least squares for discrimination”, Journal of Chemo metrics, 17(3), 166–173.
[6] Bylesjo, M., Rantalainen, M., Cloarec, O., “OPLS discriminant analysis: Combining the strengths of PLS-DA”,2006.
[7] Breiman,L.,Friedman,J.,Olsen,R., Stone.C .,1984, .“Classification and Regression Trees”, Chapman & Hall.
[8] Cover.,T.M., Hart, P.E.,"Nearest neighbor pattern classification",IEEE Trans. Inform Theory, vol. IT-13, pp. 21-27, Jan, 1967.
[9] Barker, M., & Rayens, W, “Partial least squares for discrimination”, Journal of Chemo metrics, 17(3), 166– 173,2003.
[10] Ramakrishna, Gehrkev, “Database Management Systems”, International Edition, TMH, p-929.
[11] David,A.,Aoyama, Jen-Ting,T., “TimeLine and visualization of multiple-data sets and the visualization querying challenge”, Journal of visual languages and Computing 18(2007),1-21.
[12] Chau, M., Shin,D., “A Comparative study of Medical Data classification Methods Based on Decision Tree and Bagging algorithms”,Proceedings of IEEE International Conference on Dependable,Autonomic and Secure Computing 2009, pp.183-187.
[13] Palaniappan, S., Awang, R., “Intelligent Heart Disease Prediction System Using Data Mining Techniques”, Proceedings of IEEE/ACS International Conference on Computer Systems and Applications 2008,pp.108-115. [14] Carlos Ordonez, 2004. “Improving Heart Disease
Prediction Using Constrained Association Rules ”, Seminar Presentation at University of Tokyo.
[15] Liang Yanhong, Tan Runhua, “Text Mining-based Patent Analysis in Product Innovative Process”, Hebei University of Technology.
AUTHOR’S PROFILE
Dr.V.Karthikeyani received her PhD(computer science) in 2007 from Periyar University.MCA from Madras University in 1995 and B.Sc (mathematics) from Madurai Kamaraj University in 1992.she is 16 years of teaching experience in various engineering and arts & science colleges. She was Published 10 papers in National and International Journals .she is a Life member in ISTE, CSI and ACM-CSTA. Her Research interest is Image Processing, Multimedia, Data Mining and Computer Graphics.
I.Parvin Begum received her M.Phil(computer science) from Periyar University at Salem, in 2007,MCA from Madurai Kamaraj University in 2004. BES (electronic science) from Madras University in 2001. She is working in the post of Assistant Professor totally four years. She was published two international journals. She is interest in the area of computer Graphics, data mining and database.
K.Tajudin received his M.Phil (computer science) from Bharathidasan university in 2005, M.Sc (information technology and management) from Bharathidasan university in 2003 and B.Sc(chemistry) from Madras University in 2001. He is working in the post of Assistant Professor in totally four years. He was published two international journals. He is interest in the area of computer network, data mining and database.
I.Shahina Begam received her M.Phil(computer science) from Bharathidasan university in 2005,MCA from periyar University in 2002. BES (electronic science) from Madras University in 1999.She is working in the post of Assistant Professor totally eight years. She was published two international journals. She is interests in the area of database management system, moving object database, data
warehousing and data mining.