State Equation based Dynamic Model of a PV/T Heating
Pumping System
Majed Ben Ammar
University of SFAX, Research Unit on Control of Electrical Machines and Power Networks, National School of Engineers of
Sfax, BP.W, 3038, Sfax, Tunisia.
Maher Chaabene
University of SFAX, Research Unit on Control of Electrical Machines and Power Networks, National School of Engineers of
Sfax, BP.W, 3038, Sfax, Tunisia.
Mohsen Ben Ammar
University of SFAX, Research Unit on Control of Electrical Machines and Power Networks, National School of Engineers of
Sfax, BP.W, 3038, Sfax, Tunisia.
ABSTRACT
This paper presents the dynamic simulation model to characterize water pumping and heating installation using PV/Thermal panel (PV/T) is developed. The model consists of a set of mathematical equations governing the main components of the system; namely: transparent cover, solar cell, absorber plate and operating fluid. The model is based on the analysis of the energy balance which includes the photo electric conversion and the thermal conduction, convection and radiation. The model gathers all components equations so as to reflect the electrical and thermal behavior of the PV/T system. It delivers the state equation of the system function of the climatic parameters and the fluid flow rate. The investigation of the effect of water mass flow rate through the collector on PV/T outputs have been carried out.
General Terms
PV/Thermal, dynamic simulation, model.
Keywords
PV/T modeling, state equation, PV/T outputs.
1.
INTRODUCTION
Many researchers have improved the performance of photovoltaic system. Some investigations stated that the efficiency increases when the cell temperature decreases. Hence, a new technology combining thermal and photovoltaic effects (Photovoltaic/Thermal PV/T) is developed. Considered as a hybrid system, the PV/T collector is able to produce thermal and electric energy. It is composed of a flat-plate water and air heating collector inserted within a PV module. PV/T panels are used for air heating [1, 2], water heating [3, 4], water pumping [5, 6]. Many technological investigations have been introduced in literature. They confirmed that electricity output of a PV module depends on its operating temperature. The electric power output when the cell temperature decreases [7]. In addition, a thermal behavior of copolymer PV/T solar system in low flow rate condition has been investigated [8]. It confirms that the utilization of copolymer for the design of the solar collector has numerous advantages as reducing the weight, facilitating the manufacturing and reducing the cost. Similarly, a parametric study on the performance evaluation of hybrid PV/T water/air heating system confirms that the daily
efficiency of integrated photovoltaic and thermal solar (IPVTS) system with water is higher than those of all configurations except glazed without tedlar (GWT) [9]. Also, many applications of PV/T have been implemented. A distributed dynamic modeling and experimental study of PV evaporator in a PV/T solar-assisted heat pump is developed [10]. The study has improved the overall system efficiency. In the same way a hybrid photovoltaic-thermosyphon water heating system for residential application is investigated, a high final hot water temperature in the collector system can be achieved after a one-day exposure [11]. In this paper, an explicit dynamic model for PV/T heating pumping system is introduced. The model is based on the gathering of photovoltaic and thermal equations into a state equations system. Simulation is developed using Matlab Software. The effectiveness of PV/T system compared to a photovoltaic panel (PV) is underlined. The model generates results for hourly and transient performance analysis (thermal and electrical efficiency). Consequently, the effect of the mass flow rate on the PV/T efficiency is deduced.
2.
PV/T SYSTEM DESCRIPTION
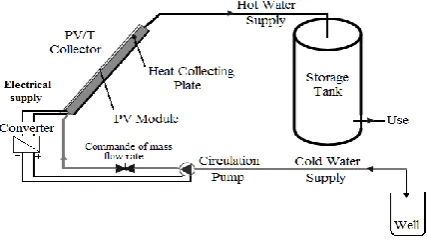
[image:1.595.322.536.596.718.2]Figure 1 shows the architecture of the PV/T based water pumping and heating system. It includes a water storage tank connected to PV/T collector. A water pump supplied by the PV/T generated electric power ensures the water pumping from a well.
PV/T Solar Collector T
f p c g
T T T T
m
h
g
a
T
T
=
WP
Q
photovoltaic solar cells directly over the absorber plate of the solar collector in conventional forced circulation type solar water heater. It is composed of:
(i) A transparent cover allowing sunlight to pass towards the absorber and to create an effect of greenhouse. It is composed by one or more panes.
(ii) A photovoltaic cell for the production electricity production.
(iii) A plate absorbing for transfers from energy collected to a coolant.
(iv) A heat insulator limits the losses by conduction through the walls back and side.
(a) View of the array
(b) Exploded view
[image:2.595.55.281.116.352.2](c) Cross section
Fig 2: Composition of a PV/T collector [12].
3.
DYNAMIC MODEL OF THE PV/T
PANEL
The representative schema of a water pumping and heating system is given by Figure 3.
Fig 3: Modeling of PV/T system.
Where Tg,Tc,Tp,Tf,Ta are respectively the temperatures of glazing, solar cell, absorber plate, water circulation and ambient temperature. W is the wind speed, gh the solar irradiation, m the mass flow rate of fluid,
P
the electric power output and Q the thermal profit. The energy balance for each component of the PV/T collector is:3.1
Glass cover sub-model
Considerg m and
g
c are respectively the mass and specific heat capacities of the front glazing, the glass cover sub model is expressed as:
c g
g cg
c g
rcg g
g a rga wind g g h g g g g
T T h A T T h A
T T h h A A g dt dT c m
(1)Where
h
cg is the convective heat transfer coefficient between glass cover and solar cell.The convective heat transfer coefficient under is given by [13]:
W wind
h 2.83
(2) The radiation heat transfer coefficient between the front cover and the ambient environment is:
) )( 2 2
(Tg Ta Tg Ta g
rga
h
(3) And that between the front cover and the collector plate is:
1 1 1
) )(
( 2 2
c g
a g a
g T T T
T rcg h
(4)
3.2
Photovoltaic generator sub-model
The electric output power depends on the instantaneous cell temperaturec
T . The maximum tracked output power of a
photovoltaic generator (PVG) is calculated as [14]:
h c
gAg
P
(5)
Where
g is the instantaneous PVG efficiency,c
A the total
PVG area and h
g the global irradiance incident on the titled plane (W/m2). The instantaneous PVG efficiency is [15]:
)] ( 1
[ g c r r
g T T
(6)
Where r is the PVG reference efficiency, Tc the PVG temperature,
r
T the PVG reference temperature and g is the PVG temperature coefficient. As the PVG is integrated in the thermal panel, the PVG cell temperature
c
T is expressed on
the basis of PV/T energy balance:
c g
c cp
c p
cg g
g c rcg g h r c g c c c c
T T h A T T h A
T T h A g A dt
dT c m
1
(7) Where
cp
h is the conduction heat transfer between cell and
absorber plate:
L k N hcp u 1
(8)
N
u [image:2.595.67.260.439.528.2]
1 5830 cos cos 1708 1 cos 8 . 1 sin 1708 1 44 . 1 1 3 / 1 6 . 1
a a a u R R R N (9) aR is the Reynolds number. It is expressed as:
a i a T TL g R 3 (10) Where T is the difference in temperature of the cell/collector surface and temperature of the plate (bottom) is:
Tp Tc
T
(11)
3.3
Absorber plate sub-model
The absorber plate temperature depends on the PVG cell temperature and the fluid temperature:
f a
f ffa f a p pa c p c cp c p p p T c m T T h A T T h A T T h A dt dT c m . . . (12) The mean plate temperature is used to calculate the useful gain of PV/T collector
h L pm a
cg U T T
A
Q
(13)
The mean plate temperature is given by:
R
L R c fi pm F U F A Q T T 1 (14)
The Overall heat loss coefficient is expressed as:
e b t
L U U U
U
(15)
The bottom heat loss coefficient is:
L K Ub 1 (16) The edge heat loss coefficient is given by:
A A K Ue e
(17)
The top heat loss coefficient is given by:
1 1 1 cg w rcp cp t h h h h U (18)
Referring to Duffie and Beckman and Tiwari [12, 13], the flow rate factor is given by
)) ' ( exp 1 ( f L c L c f c m F U A U A c m FR (19)
The flat plate collector efficiency is given by:
) ) ( 1 ( 1 ' F d lai d h d U lai F i i L (20) Where
tanh(( ) / 2) ( ) / 2
lai d F
m lai d
(21)
k U
m L
3.4
Output fluid temperature sub-model
The fluid temperature is computed by:y T m C T T h A dt dT c
mf f f f pf p f f f
( ) (22) While computing, the variation of the fluid temperature by the variation of the tube length is considered constant [13, 16]. The useful collected heat Q is given by [17]
) ( f i p
f C T T
m
Q
(23)
3.5
State equation of the PV/T panel
By gathering the system components sub-models, the state equation of the energy balance is:
CT Y W D U B T A T (24) ] [
Tg Tc Tp Tf
T is the vector containing the
temperatures at the 4 nodes of the PV/T system, A is the state matrix which contain the heat exchange coefficients between the system elements, B is the control matrix which encloses commands applied on the mass flow rate (m ), D is the perturbation matrix acting on the perturbation inputs vector (
]
[
gh Ta
W ), Y is the output vector containing the electrical powers and the thermal profit gain( T
Q P
Y[ ] ) . The detailed form of the state equation is expressed by:
f p c g a h f p c g f p c g T T T T c c c c c c c c Q P T g d d d d d d d d b b b b m T T T T a a a a a a a a a a a a a a a a T T T T 24 23 22 21 14 13 12 11 42 32 22 41 31 21 12 11 41 31 21 11 44 43 42 41 34 33 32 31 24 23 22 21 14 13 12 11
The parameters aij, bij, cij and dij are determined from equations 1, 7, 12 and 22.
4.
RESULTS AND DISCUSSION
Table 1. Design parameters of (PV/T) collector Parameters
Front glazing (low-iron glass)
Area of glass Mass of glass Specific heat capacity of glass Emissivity of glass Transmissivity of glass Solar cell ( polycrystalline silicon) Area of module Mass of module Specific heat capacity of cell Emissivity of cell PVG reference efficiency Kinematic viscosity PVG reference temperature PVG temperature coefficient Plate spacing
Vertical orientation angle Thermal diffusivity Thermal absorber (aluminum alloy) Area of plate absorber Mass of plate absorber
Specific heat capacity of plate absorber Plate spacing
Plate thermal conductivity Thickness
Water in channel
Area of channel fluid flow Mass of water
Specific heat capacity of fluid Tube spacing
Plate spacing
Numerical values 1.64 m2
7.2 kg 810 J/kg K 0.88 0.95
0.87 m2 5.4 kg 903 J/kg K 0.35 0.178 1.88 10-5 m2/s 25 °C 0.00375 °C-1 0.025 m 45°
2.69 10-5 m2/s
2 m2 9.03 kg
900 J/kg K 0.025 m 385 W/m K 0.03 m
0.165 m2 45 kg 4190 J/kg K 0.15 m 0.025 m
Heat transfer coefficient hpf
hcp hrcp hi
wind speed W
100W/m2 5.7 W/m2 1000 W/m2 300 W/m2K 1 m/s
4.1
Model simulation
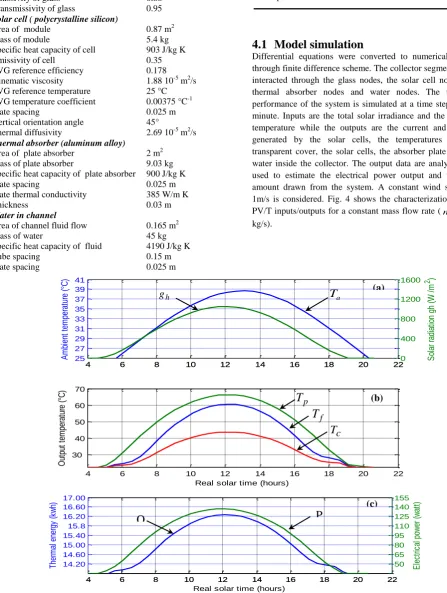
[image:4.595.63.511.143.737.2]Differential equations were converted to numerical format through finite difference scheme. The collector segments were interacted through the glass nodes, the solar cell nodes, the thermal absorber nodes and water nodes. The transient performance of the system is simulated at a time step of one minute. Inputs are the total solar irradiance and the ambient temperature while the outputs are the current and voltage generated by the solar cells, the temperatures of: the transparent cover, the solar cells, the absorber plate and the water inside the collector. The output data are analyzed and used to estimate the electrical power output and the heat amount drawn from the system. A constant wind speed of 1m/s is considered. Fig. 4 shows the characterization of the PV/T inputs/outputs for a constant mass flow rate (m = 0.04 kg/s).
Fig 4: Characterization of the PV/T panel
4 6 8 10 12 14 16 18 20 22
14.20 14.60 15.00 15.40 15.8 16.20 16.60 17.00
T
he
rm
al
e
ne
rg
y
(k
w
h)
4 6 8 10 12 14 16 18 20 22
50 65 80 95 110 125 140 155
E
le
ct
ric
al
p
ow
er
(
w
at
t)
Real solar time (hours)
Q
P
(c)
4 6 8 10 12 14 16 18 20 22
25 27 29 31 33 35 37 39 41
A
m
bi
en
t
te
m
pe
ra
tu
re
(
°C
)
4 6 8 10 12 14 16 18 20 220
400 800 1200 1600
S
ol
ar
r
ad
ia
tio
n
gh
(
W
/
m
2 )
4 6 8 10 12 14 16 18 20 22
30 40 50 60 70
Real solar time (hours)
O
ut
pu
t
te
m
pe
ra
tu
re
(
°C
)
p
T
f
T
c
T
aT
h
g
(a)
A typical day of the summer season (August 5th, 2011) is considered to simulate the developed model. Figure 4.a gives the behavior of the solar radiation and ambient temperature. Equations 7, 12 and 22 have been computed using MATLAB 7.0 to evaluate the hourly variation of cell temperature, plate absorber temperature and water temperature (Figure 4.b) at constant mass flow rate (m = 0.04 kg/s). Similarly, equations 5 and 24 have been used to calculate the useful thermal and electrical energy yield. Figure 4.c shows that the useful thermal energy yield increases from 14.81 kWh (at 8:00 am) to 16.32 kWh (at 1:00 pm) as the water temperature increases from to 38°C to 61°C. In addition, it can be seen that the electrical efficiency varies between 15% and 18%; which confirms an efficiency improvement in PV/T collectors
compared to PV collector for which the efficiency is in between 9% and 12%.
4.2
The effect of the mass flow rate
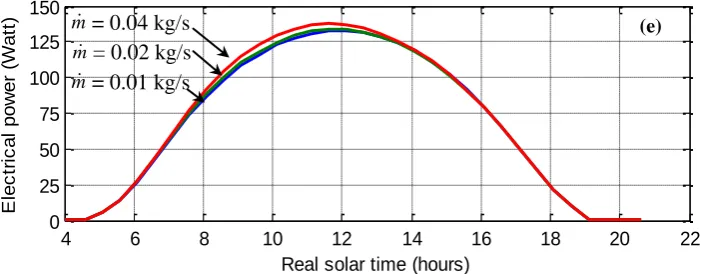
The PV efficiency increases while the cell temperature (Tc) decreases (Eq. 6) [7, 14, and 18]. In addition, equation 7 shows that the cell temperature (Tc) varies in the same way of the plate absorber temperature (Tp). Nevertheless, Tp decreases when increasing the mass flow rate (Eq. 12). Hence, the PV efficiency changes proportionally with the mass flow rate. The phenomenon is underlined by compiling the PV/T model simulated for different mass flow rates (Figure 5) during a considered day (August 5th, 2011).
4 6 8 10 12 14 16 18 20 22
25 28 31 34 37 40 43
A
m
b
ie
n
t
te
m
p
e
ra
tu
re
(
°C
)
4 6 8 10 12 14 16 18 20 220
200 400 600 800 1000
S
o
la
r
ra
d
ia
ti
o
n
g
h
(
w
/m
2 )
4 6 8 10 12 14 16 18 20 22
30 40 50 60 70 80
W
a
te
r
te
m
p
e
ra
tu
re
(°
C
)
a
T
h
g
m
=
0.01 kg/s
m
= 0.02 kg/s
m
= 0.04 kg/s
4 6 8 10 12 14 16 18 20 22
30 40 50 60
C
e
ll
te
m
p
e
ra
tu
re
(
°C
)
m
= 0.01 kg/s
m
= 0.02 kg/s
m
= 0.04 kg/s
4 6 8 10 12 14 16 18 20 22
14.20 14.60 15.00 15.40 15.80 16.20 16.60 17.00
T
h
e
rm
a
l
e
n
e
rg
y
(
K
W
h
)
m
= 0.01 kg/s
m
= 0.02 kg/s
m
= 0.04 kg/s
(a)
(b)
(c)
Fig 5: Simulation of the PV/T system at different mass flow rates.
The hourly variation of water temperature and cell temperature of PV/T system for various values of mass flow rate are shown in Figure 5.b and Figure 5.c. The results reveal that, when m increases from 0.01 kg/s to 0.04 kg/s, the water temperature decreases from 68°C to 61°C (at 12:00) and the cell temperature decreases from 43°C to 41°C (at 12:00). Figure 5.d and Figure 5.e show respectively the electrical power and the thermal energy at different mass flow rates. The results reveal that when the mass flow rate increases from 0.01 kg/s to 0.04 kg/s, the electrical power increases from
131 Watt to 142 Watt (at 12:00) as for the thermal energy yield decreases from 17 kWh to 16.30 kWh (at 12:00).
4.3
System valorization
[image:6.595.61.538.412.516.2]A one day test-results of the experimental plant are listed in Table 2. All efficiency terms are with reference to the collector area and for a constant flow rate (m = 0.04 kg/s). It can be seen that the cell temperature of a PV system is considerably superior than that of a PV/T system. This is due to the water circulation in PV/T. Consequently the electrical PV/T efficiency is higher than that of PV system.
Table 2 : Daily test results
gh (W /m2) Ta (°C) TCpv/t (°C) ηg of PV/T collector (%) Tcpv panel (°C) ηgof PV panel (%)
1000 34.00 43.00 16.59 59.00 10.16
900 33.00 40.00 16.79 55.50 10.53
800 32.00 37.00 16.99 52.00 10.54
700 31.00 35.00 17.13 48.50 10.73
600 30.00 31.00 17.39 45.00 10.92
500 29.00 29.50 17.51 41.50 11.10
400 28.00 28.50 17.59 38.00 11.29
5.
CONCLUSION
A PV/T dynamic model is established. Electric and thermal equations are formulated as a state equation system. The model simulation evaluates the system performances such as the different temperatures, the output power and the thermal energy yield for a considered weather conditions (gh and Ta). It is observed that the thermal and electrical performances of PV/T system are improved when compared to a photovoltaic panel. The developed model will be used to compute dynamically the optimum mass flow rate to affect to the PV/T so as to bring the maximum thermal and electrical efficiency. This technology presents an electrical efficiency increase ranging between 2% and 4% compared to other technologies.
6.
REFERENCES
[1] Garg HP, Adhikari RS. Transient simulation of conventional hybrid photovoltaic/thermal air heating collectors. International Journal Energy Res 1998; 22:547–62.
[2] Tripanagnostopoulos Y, Nousia Th, Souliotis M, Yianoulis P. Hybrid photovoltaic/thermal solar systems. Sol Energy 2002; 72(3):217–34.
[3] H.P. Garg, P.K. Agarwal, Some aspects of a PV/T collector/forced circulation flat plate solar water heater with solar cells, Energy Conversion and Management 1995; 36: 87–99.
[4] T. Bergene, O.M. Lovik, Model calculations on a flat-plate solar heat collector with integrated solar cells, Solar Energy 1995; 55: 453– 462.
[5] B.J. Huang, T.H. Lin, W.C. Hung, F.S. Sun, Performance evaluation of solar photovoltaic/thermal systems, Solar Energy 2001;70: 443– 448.
[6] N. Boutasseta, PSO-PI based control of photovoltaic arrays, International Journal of Computer Applications (0975-8887) volume 48 N°17, June 2012.
[7] Mohsen Ben Ammar, Maher Chaabene, Abdelhamid Rabhi & Mohamed Ben Ali Kammoun, Energy planning of a domestic photovoltaic panel, PV49, World Renewable Energy Congress X, 1344-1349, July, 19 – 25, 2008 Glasgow, Scotland, United Kingdom.
4 6 8 10 12 14 16 18 20 22
0 25 50 75 100 125 150
Real solar time (hours)
E
le
c
tr
ic
a
l
p
o
w
e
r
(W
a
tt
)
m
= 0.02 kg/s
m
=
0.01 kg/s
[8] Christian Cristofori, Gilles Notton, Jean Louis Canaletti, Thermal behaviour of a copolymer PV/T solar system in low flow rate conditions, solar energy 2009;83:1123-1138.
[9] Arvind Tiwari, M.S. Sodha, Performance evaluation of hybrid PV/thermal water/air heating system a parametric study, Renewable energy 2006; 31: 2460-2474.
[10]Jie Ji, Hanfeng He, Tintai Chow, Gang Pei, Wei He, Keliang Liu, Distributed dynamic modeling and experimental study of PV evaporator in PV/T solar assisted heat pump, International Journal of Heat and Mass Transfer 2009; 52:1365-1373.
[11] T.T. Chow, W. He, J. Ji, hybrid photovoltaic-thermosyphon water heating system for residential application, Solar Energy 2006; 80: 298-306.
[12] Adnan Ibrahim, Mohd Yusef Othmen, Mohd Hafidz Ruslan, Sohif Mat, Kamaruzzaman Sopian, Recent advances in flat plate photovoltaic/thermal (PV/T) solar collectors, Renewable and Sustainable Reviews 2011;15:352-365.
[13] Duffie JA, Beckman WA. Solar engineering of thermal processes, 2nd ed. New York: Wiley, 1991.
[14] G.N. Tiwari and Swapnil Dubey. Fundamentals of photovoltaic modules and their applications Centre for Energy Studies, Indian Institute of Technology Delhi, New Delhi, India, 2010.
[15] K. Nagano, T. Mochida, K. Shimakura, K. Murashita, S. Takida, Development of thermal-photovoltaic hybrid exterior wallbords incorporating PV cells in and their winter performances, Solar Energy Materials and Solar Cells 2003; 77:265-282.
[16] Swapnil Dubey, G.N. Tiwari, Analysis of PV/T flat plate water collectors connected in series, Solar Energy 2009;83:1485–1498.
[17] P.G. Charalambous, G.G. Maidment, S.A. Kalogirou, K. Yiakoumetti, Photovoltaic thermal (PV/T) collectors: A review. Applied Thermal Engineering 2007; 27: 275–286.
![Fig 2: Composition of a PV/T collector [12].](https://thumb-us.123doks.com/thumbv2/123dok_us/8093426.785439/2.595.67.260.439.528/fig-composition-of-a-pv-t-collector.webp)