How to cite this paper: Quais, Md.K., Dewan, Md.M.R., Khatun, A. and Sultana, H. (2015) Rice Yield Gap Minimization in Central Bangladesh: Using and Adapting Existing Technologies. Open Access Library Journal, 2: e1641.
http://dx.doi.org/10.4236/oalib.1101641
Rice Yield Gap Minimization in Central
Bangladesh: Using and Adapting Existing
Technologies
Md. Khairul Quais1*, Md. Mahbubur Rahman Dewan2, Amina Khatun1, Hasina Sultana1
1Rice Farming Systems Division, Bangladesh Rice Research Institute, Gazipur, Bangladesh
2Bangladesh Rice Research Institute, Kushtia, Bangladesh
Email: *[email protected]
Received 14 June 2015; accepted 30 June 2015; published 6 July 2015
Copyright © 2015 by authors and OALib.
This work is licensed under the Creative Commons Attribution International License (CC BY).
http://creativecommons.org/licenses/by/4.0/
Abstract
Rice (Oryza sativa L.) in the dry season (Boro) followed by rice in the wet season (Aman) is the major cereal cropping system in Bangladesh. The average productivity (7 Mg∙ha−1) of this system is far below attainable yields (14 Mg∙ha−1) in farmers’ fields, resulting in a large yield gap mainly due to farmers’ traditional management practices. Narrowing yield gap is a vital complementary strategy in improving rice yield and consequently enhancing food security. We evaluated BRRI recommended management practices, BRRI recommended management practices along with two N management options (leaf color chart and Urea Super Granule) and farmers’ crop management practices integrated with quality seed, leaf color chart (LCC) and Urea Super Granule (USG) in farmers’ fields of Kapasia, Gazipur over 6 contiguous seasons during 2009-2012. Across years, all the management options increased grain yields compared with the farmers’ practice (FP) by 1.12 Mg∙ha−1 in Aman and 0.84 Mg∙ha−1 in Boro season. The higher yield response (43%) occurred with BRRI recommended management practices followed by BRRI recommended management prac-tices in combination with Urea Super Granule (42%) as N source (BRRI-USG). Yield advantage of 41% could be attained by BRRI recommended management practices with leaf color chart (LCC) aided N management (BRRI-LCC) while this was 22%, 13% and 13% higher than FP (farmer’s practice) when only quality seeds, USG and LCC were used with farmers’ management practice. BRRI Rec., BRRI-LCC and BRRI-USG∙management options reduce the yield gap of FP by 41%, with an average of 2.87 Mg∙ha−1. When farmers adopted FP-QS, FP-USG and FP-LCC management options, they reduced the yield gap of FP by 21%, 13% and 12%, with an average of 1.49, 0.88 and 0.81 Mg∙ha−1, respectively. The average added net returns with BRRI Rec., BRRI-LCC and BRRI-USG∙ma- nagement options were US$175 to US$362 ha−1 in the wet season and US $158 to US $263 ha−1 in the dry season. BRRI management practices and BRRI management practices integrated with two N management options, either LCC or USG has the potential to boost rice yield and consequently total rice production in Bangladesh.
OALibJ | DOI:10.4236/oalib.1101641 2 July 2015 | Volume 2 | e1641
Keywords
Rice-Rice Cropping System, Yield Gap, Productivity, Net Profit
Subject Area: Agricultural Science
1. Introduction
About half of the world’s cereal production and 89% of the world’s harvested rice are from Asia [1]. Economi-cally disadvantaged people spend as much as 30% - 40% of their income just to buy rice [2]. Increasing the amount of rice production and keeping the rice price low and affordable to them are crucial for poverty reduc-tion. Rice yield must continue to increase at an annual rate of 1.5% compared with the current rate of 0.8% to keep pace with the expected demand [3]. Like in many other Asian countries, rice is the staple food in Bangla-desh and it contributes one-half of the agricultural GDP and 55% of the total labor employment [4]. During the last 20 years, Bangladesh has increased rice production 1.8 times with almost no increase in its land area of about 11.7 million ha [5]. However, because of the continuous increase in population growth, rice demand in 2050 is projected to be 56% higher than in 2001 [6]. This is going to be doubly challenging in light of the diver-sion of better quality land, water, and labor to other sectors of the national economy. Evidence is now appearing that the productivity of rice-rice and rice-wheat systems is plateauing because of a fatigued natural resource base
[7] [8]. The productivity and sustainability of rice-based cropping systems are threatened because of i) the inef-ficient use of fertilizer, water, and labor; ii) increasing scarcity of water and labor; iii) changing climate; iv) emerging energy crisis and rising fuel prices; v) emerging socioeconomic changes such as urbanization, migra-tion of labor, and preference for nonagricultural work [9]. In addition, recent increases in the prices of farm in-puts in relation to outin-puts, fewer off-farm work opportunities for supplementing farm income, reduced remit-tances from relatives working outside villages, and declining income and purchasing power of poor consumers have threatened the existence of rice producers and consumers [9].
Bangladesh produced about 50.1 million tons of rough rice from 11.7 m ha of land in 2010 with a productivity of 4.3 t∙ha−1 [5]. The present productivity is far below the attainable yield of 8 - 10 t∙ha−1 in the dry season (Boro)
and 5 - 6 t∙ha−1 in the wet season (Transplanted Aman) in farmers’ field experiments [10]-[13]. This difference
in yield in farmers’ fields between farmer-managed and researcher-managed trials exists because the best avail-able production technologies are not adopted in farmers’ fields. This could be, among others, due to farmers’ characteristics (e.g., lack of knowledge and skills, and risk aversion), farm characteristics (e.g., poor soil, diffi-cult terrain, and inaccessibility), and inappropriateness of the technology to farmers’ circumstances (e.g., labor- intensive, high investment costs, and poor access to inputs). However, a large portion of this yield gap remains unexplained.
Minimizing the yield gap and increasing profit and product quality are becoming increasingly difficult to achieve by using a single-technology-centric approach. The use of a component technology in isolation also has limited widespread adoption. Combining and simultaneously applying a number of the best compatible individ-ual or component technologies are crucial for maximizing overall benefits to farmers [9]. Depending on the need and profitability of new technologies, farmers generally integrate new technology with the cultural practices be-ing practiced by them on their farms. The choice or selection of the best individual or component technologies in an integrated manner is crucial for achieving the full benefit. As narrowing yield gap of rice is attributed to many factors, it should be better quantified and understood. This paper aims to evaluate the contribution of dif-ferent crop management factors in curtailing the rice yield gap over six seasons during three years.
2. Materials and Methods
2.1. Experimental Sites and Seasons
OALibJ | DOI:10.4236/oalib.1101641 3 July 2015 | Volume 2 | e1641
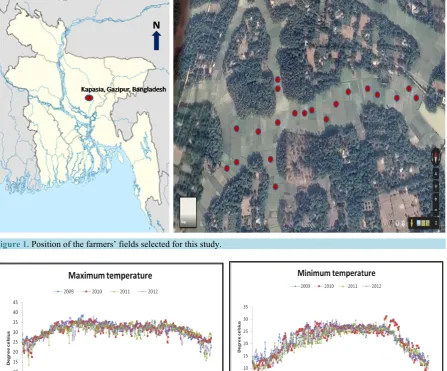
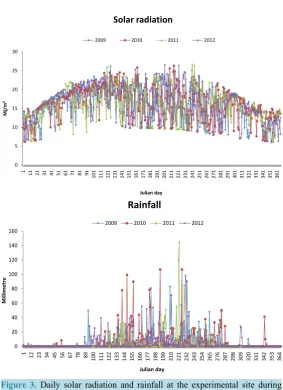
and humidity. Weather data were collected from a nearby weather station of Bangladesh Meteorological De-partment. The weather pattern during the study period is given inFigure 2 andFigure 3.
Moison village in Gazipur District belong to Agro-Ecological Zone (AEZ) 28 (Madhupur Tract). The soils are well drained friable clay loam to clay or heavy clay, strongly acidic, mainly phosphate fixing, low in P, K, S, and B in AEZ-28 [14]. Transplanted rice was grown on puddled soil under rainfed conditions in the wet season or Aman (June-July to November-December) and under irrigated conditions in the dry season or Boro (Decem-ber-January to April-May). In both seasons, soils were well prepared through 4 - 5 passes with a power tiller followed by 2 - 3 ladderings. High-yielding semi-dwarf rice cultivars BRRI dhan49 (135 day seed to seed) and BRRI dhan28 (140 day seed to seed) were grown in the Aman and Boro seasons, respectively.
2.2. Experimental Design and Treatments
[image:3.595.92.540.274.645.2]The trials were established in farmers’ fields in a randomized complete block design with a set of seven treat-ments in each farmer’s field. Farmers’ fields were considered as replications. The number of replicate farmers was twenty. There were seven treatments, viz. farmers’ management practices (FP), farmers’ management prac-
Figure 1.Position of the farmers’ fields selected for this study.
OALibJ | DOI:10.4236/oalib.1101641 4 July 2015 | Volume 2 | e1641
Figure 3.Daily solar radiation and rainfall at the experimental site during
2009-2012.
tices with quality seed (FP-QS), farmers’ management practices with USG (FP-USG), farmers’ management practices with LCC based N management (FP-LCC), Bangladesh Rice Research Institute (BRRI) recommended management practices coupled with leaf color chart (LCC)-aided fertilizer N management (BRRI-LCC), BRRI recommended management practices coupled with urea super granules (USG) as source of fertilizer N (BRRI- USG) and BRRI recommended management practices (BRRI Rec.).
2.3. Treatment Details
2.3.1. Farmers’ Management Practices (FP)
The farmers’ management practice of seed and seedling raising, planting∙method, and fertilization varied consi-derably among farmers and seasons (Table 1). All farmers used seeds from their own source having 80% - 85% germination capacity without any seed treatment. They prepared a flat seedbed without any organic matter and used a very high seed rate (140 - 168 g∙m−2) on the seedbed. Five to nine rice seedlings (35- - 44-day-old) per
hill in Aman and five to eight rice seedlings (48- - 60-day-old) in the Boro season were transplanted at random spacing.
Across seasons and years, all farmers applied N fertilizer at early tillering, late tillering and panicle initiation stage. Farmers applied on an average 70% - 76% of N fertilizer between early tillering and late tillering (Table 1). In the Aman season, 100% farmers applied P and K fertilizer but no farmer applied S and Zn fertilizer. In the Boro season, 100% of the farmers applied P fertilizer, 100% applied K fertilizer, 80% - 100% applied S fertilizer, and 40% - 60% applied Zn fertilizer.
0 5 10 15 20 25 30
1 11 21 31 41 51 61 71 81 91
101 111 121 131 141 151 161 171 181 191 201 211 221 231 241 251 261 271 281 291 301 311 321 331 341 351 361
M
j/m
2
Julian day Solar radiation
2009 2010 2011 2012
0 20 40 60 80 100 120 140 160
1 12 23 34 45 56 67 78 89
100 111 122 133 144 155 166 177 188 199 210 221 232 243 254 265 276 287 298 309 320 331 342 353 364
M
illim
et
re
Julian day Rainfall
OALibJ | DOI:10.4236/oalib.1101641 5 July 2015 | Volume 2 | e1641
Table 1. Farmers’ management practices for transplanted rice in central Bangladesh in Aman and Boro seasons during 2009-
2012.
Parametera Aman 2009 Aman 2010 Aman 2011 Boro 2009-10 Boro 2010-11 Boro 2011-12 Seed rate on seed bed,
range (g∙m−2) 142 - 160 140 - 155 145 - 157 158 - 167 160 - 168 155-164
Seed rate to transplant 1
ha main field (kg) 55 ± 5 45 ± 7 50 ± 5 58 ± 4 49 ± 7 46 ± 6
Seedling age, range (days) 35 - 44 32 - 40 36 - 39 49 - 60 48 - 55 50 - 59
Hill spacing at
transplanting (cm) Random Random Random Random Random Random
Seedling number (hill−1) 5 - 8 5 - 9 5 - 8 5 - 7 5 - 8 5-8
Fertilizer management N applied at basal
Farmer (%) 0 0 0 0 0 0
Amount ± S.D. (kg∙ha−1) 0 0 0 0 0 0
N applied at early tillering
Farmer (%) 100 100 100 100 100 100
Time ± S.D. (DAT) 15 ± 2 14 ± 2 18 ± 3 15 ± 4 16 ± 3 13 ± 4
Amount ± S.D. (kg∙ha−1) 34 ± 9 33 ± 7 24 ± 6 39 ± 6 40 ± 4 43 ± 3
N applied at late tillering
Farmer (%) 100 100 100 100 100 100
Time ± S.D. (DAT) 25 ± 3 30 ± 3 28 ± 4 30 ± 3 32 ± 5 37 ± 4
Amount ± S.D. (kg∙ha−1) 37 ± 5 45 ± 5 39 ± 8 42 ± 4 36 ± 3 40 ± 4
N applied at panicle initiation
Farmer (%) 100 100 100 100 100 100
Time ± S.D. (DAT) 40 ± 4 43 ± 2 39 ± 3 46 ± 3 41 ± 5 45 ± 4
Amount ± S.D. (kg∙ha−1) 28 ± 6 24 ± 3 21 ± 3 34 ± 7 33 ± 4 33 ± 4
Fraction of total N applied
At basal (%) 0 0 0 0 0 0
At early tillering (%) 34 32 29 34 37 37
At late tillering (%) 37 44 46 36 33 35
At panicle initiation (%) 28 24 25 30 30 28
P applied
Farmer (%) 100 100 100 100 100 100
Amount ± S.D. (kg∙ha−1) 7 ± 2 7 ± 2 7 ± 1 19 ± 4 14 ± 2 19 ± 4
K applied
Farmer (%) 100 100 100 100 100 100
Amount ± S.D. (kg∙ha−1) 14 ± 6 12 ± 3 16 ± 4 36 ± 3 40 ± 10 37 ± 5
S applied
Farmer (%) 0 0 0 80 100 100
Amount ± S.D. (kg∙ha−1) 0 0 0 5 ± 3 5 ± 3 6 ± 1
Zn applied
Farmer (%) 0 0 0 40 60 40
Amount ± S.D. (kg∙ha−1) 0 0 0 1 ± 1 1 ± 1 1 ± 1
OALibJ | DOI:10.4236/oalib.1101641 6 July 2015 | Volume 2 | e1641 2.3.2. Farmers’ Practices with Quality Seed (FP-QS)
The management practices in FP-QS were same as FP except seed source. Certified seed from BRRI having 92-95% germination capacity was used.
2.3.3. Farmers’ Practices with USG (FP-USG)
The management practices in FP-USG were same as FP except N fertilizer management. Nitrogen as USG was deep-placed within 7 - 10 DAT at 7 - 10 cm soil depth at the rate of one USG (1.8 g) in Aman and one USG (2.7 g) in Boro in the middle of 4 hills. The total N dose was 54 kg∙ha−1 in Aman and 79 kg∙ha−1 in Boro.
2.3.4. Farmers’ Practices with LCC (FP-LCC)
The management practices in FP-LCC were same as FP except N fertilizer management. Nitrogen as urea was applied by using the LCC in a real-time N management approach [15]. The N rate varied among farmers’ fields and seasons. The mean total N dose ranged from 77 to 103 kg∙ha−1 in Aman and from 93 to 124 kg∙ha−1 in Boro
(Table 2).
2.3.5. BRRI Recommended Management Practices with LCC (BRRI-LCC)
A set of five BRRI recommended management practices integrated with existing farmers’ practices were i) cer-tified seeds, ii) healthy young seedlings, iii) hill spacing of 20 cm × 20 cm at transplanting with 3 - 4 seedlings per hill, iv) AEZ-based recommended P, K, S, and Zn fertilization, and v) N application by using the LCC in a real-time N management approach. The management practices recommended by BRRI were used for raising healthy seedlings (Table 3) [16]. Across the years, seedling age ranged from 28 to 34 days in Aman and from 40 to 48 days in Boro. The P, K, S, and Zn fertilizers were applied at the rates and time recommended by BRRI based on AEZ-based recommendations [16]. Nitrogen as urea was applied by using the LCC in a real-time N management approach [15]. The N rate varied among farmers’ fields and seasons. The mean total N dose ranged from 77 to 103 kg∙ha−1 in Aman and from 93 to 124 kg∙ha−1 in Boro (Table 3).
2.3.6. BRRI Recommended Management Practices with USG (BRRI-USG)
The management practices in BRRI–USG were same as BRRI–LCC except N fertilizer management. Nitrogen as USG was deep-placed within 7 - 10 DAT at 7 - 10-cm soil depth at the rate of one USG (1.8 g) in Aman and one USG (2.7 g) in Boro in the middle of 4 hills. The total N dose was 54 kg∙ha−1 in Aman and 79 kg∙ha−1 in
Boro.
2.3.7. BRRI Recommended Management Practices (BRRI Rec.)
The management practices in BRRI were same as BRRI–LCC except N fertilizer management. The total N dose was 54 kg∙ha−1 in Aman and 79 kg∙ha−1 in Boro. Nitrogen was applied as urea in three equal splits: 7 - 10, 25 -
30 and 35 - 40 days after transplanting (DAT) in Aman and at 15 - 20, 30 - 35 and 40 - 45 DAT in Boro.
2.4. Data Collection and Analysis
Grain yields (rough rice) were obtained from two central 6 m2 harvest areas in each plot at∙harvestable maturity
and reported at 0.14 g H2O g−1 fresh weight of grain. Human labor used for seedling raising, transplanting, and
fertilizer application and wage rate were recorded. The time required to complete each field operation was ex-pressed as person-days ha−1, considering 8 h to be equivalent to 1 person-day. The farm-gate price of rough rice
and prices of seed, fertilizers, and seed-treating chemicals were also recorded.
Table 2. N management integrated with famers’ management practices in central Bangladesh in Aman and Boro seasons
during 2009-2012.
Crop production factora FP-LCC
N fertilizer management, mean ± S.D.
OALibJ | DOI:10.4236/oalib.1101641 7 July 2015 | Volume 2 | e1641
Table 3. BRRI recommended management practices for transplanted rice in central Bangladesh in Aman and Boro seasons
during 2009-2012.
Crop production factors and
parametera BRRI-LCC
Seed and seedlings
Seed source Certified seeds from BRRI
Seed germination (%) 92 - 95
Seed treatment Seeds treated with bavistine at 3 g per kg seeds. Seeds were soaked in water mixed with bavistine for 24 h
Seed rate (kg∙ha−1) 30 kg seeds used to transplant 1 ha main field
Land for seedbed preparation Land having loamy or clay loam soils, sufficient sunlight, irrigation, and drainage facility was selected for seedbed preparation
Seedbed preparation
• Decomposed cowdung at 2.0 kg∙m−2 was spread uniformly on the surface of the seedbed before or at land preparation
• Land plowed 2 - 3 times by power tiller followed by laddering and allowed to decompose for 7 - 10 days to make the soil soft and muddy
• When soils became sufficiently soft and muddy, 1.0-m-wide raised beds (length as long as the length of the land) were made surrounded by a 25-cm-wide and 10 - 15-cm deep canal. The soils from the canal were put on the bed. The number of beds made depended on the land size and requirement
• Surface of the raised bed was leveled by a plane and flat wood
• Soils at the surface of the raised bed were allowed to settle for 3 - 4 h before seed sowing Seed rate sown on seedbed,
range (g∙m−2) 80 - 100
Water management cracking at the surface of the raised bed. Soil surface of the raised bed was not allowed to crack Canals surrounding the raised beds always kept full with water to prevent soil
Seedling age, range (days) 28 - 34 in Aman and 40 - 48 in Boro
Plant population at planting
Hill spacing at transplanting (cm) 20 × 20
Number of seedlings per hill (no.) 3 - 4
P, K, S, and Zn fertilizer management
Total amounts of P as triple superphosphate, S as gypsum, Zn as zinc sulfate, and K as KCl were applied basally immediately before transplanting rice in both
Boro and Aman seasons. The fertilizer rates (kg∙ha−1) were:
Boro season: 17 P, 62 K, 10 S, and 2 Zn; Aman season: 12 P, 42 K, 10 S, and 2 Zn
N fertilizer management, mean ± S.D.
The N rates (kg∙ha−1) for the LCC option given below: Aman 2009: 88 ± 14 in 3 - 4 splits; Aman 2010: 93 ± 11 in 3 - 4 splits; Aman 2011: 83 ± 12 in 3 - 4 splits; Boro 2009-10: 117 ± 14 in 3 - 4 splits; Boro 2010-11: 111 ± 17 in 3 - 4 splits; Boro 2011-12: 117 ± 14 in 3 - 4 splits aS.D., standard deviation of the mean.
Analysis of variance (ANOVA) of the treatment means were compared using Least Significant Difference (LSD) at the 5% level of probability [17]. Descriptive statistics such as means, standard deviation, range, 25% quartile, and 75% quartile were used to determine the variability of parameters.
Treatments were evaluated based on added net return relative to the farmers’ practice, which is the difference between added gross return and added cost for a treatment as compared with FP. Added gross return equaled additional yield as rough rice (yield of treatment−yield of FP) multiplied by the price of yield. Added cost equaled the sum of costs for differences in labor determined as [(labor for seedling raising, transplanting, and fertilizer application of the treatment-labor for seedling raising, transplanting, and fertilizer application of FP) × wage rate] and costs for differences in fertilizer and seed-treating chemicals determined as (fertilizer and seed-treating chemical costs of treatment-fertilizer and seed-treating chemical costs of FP). The prices of seeds, cowdung, fertilizer, seed-treating chemical, rough rice, and labor wage were as follows: seed = US $0.45 kg−1,
cowdung = US $12.86 to 19.29 Mg−1, P fertilizer = US $0.28 to 0.51 kg−1 P, K fertilizer = US $0.19 to 0.45 kg−1
OALibJ | DOI:10.4236/oalib.1101641 8 July 2015 | Volume 2 | e1641
N, USG = US $0.21 to 0.29 kg−1 N, seed-treating chemical = US $34.07 to 35.48 kg−1, rough rice = US $0.22 to
0.26 kg−1, and labor wage = US $1.93 to 2.57 person-day−1 (US $1 = Bangladesh Taka 77.78).
3. Results and Discussion
3.1. Grain Yield
BRRI management practices and BRRI management practices along with two N management options, either LCC or USG, had a significant response in rice grain yield in both Aman and Boro seasons in all three years
(Table 4andTable 5). Famers’ management practices when coupled with either quality seed, LCC or USG also
showed significant increase in grain yields compared to farmers’ practices. The yields of BRRI-LCC, BRRI- USG and BRRI recommended practices were always similar in the range 4.29 - 4.84 Mg∙ha−1 in Aman and in
5.12 - 5.50 Mg∙ha−1 Boro. BRRI recommended practices produced the highest yield in Aman 2009, 2011 and in
Boro 2011-12. BRRI-USG produced the highest yield in Aman 2010 and in Boro 2010-11 and BRRI-LCC in Boro 2009-10.
BRRI-LCC, BRRI-USG and BRRI recommended practices turned out about 41% - 62% in wet and 27% - 38% higher grain yield in dry season, respectively. The results of the study also implies that yield advantage of 13% - 35% in wet season and 1% - 21% in dry season could be attained when only quality seeds, USG and LCC were used with farmers’ management practice. On average, the yields in Boro were 18% higher than the yields in Aman, with the highest yield of 5.50 Mg∙ha−1 in Boro and 4.84 Mg∙ha−1 in Aman.
Figure in parenthesis indicates yield increase in percent over farmers practice
Irrespective of years, the average yield for the system (combined yield of Aman and Boro seasons within a cropping year) for FP was 7.04 Mg∙ha−1. The system productivity of FP-QS, FP-USG and FP-LCC, BRRI-LCC,
BRRI-USG and BRRI Recommended management options was 8.53, 7.92, 7.85, 9.84, 9.91and 9.99 Mg∙ha−1.
BRRI-reported that average attainable yield for this system is 14 Mg∙ha−1 [10]-[13]. When farmers adopted
BRRI Rec., BRRI-LCC and BRRI-USG∙management options (9.91 Mg∙ha−1) resulting a yield gap of 4.09
Mg∙ha−1. On the other hand, system productivity of FP-QS, FP-USG and FP-LCC management options was 8.10
[image:8.595.91.539.451.705.2]Mg∙ha−1 resulted in a yield gap of 5.90 Mg∙ha−1. Thus, in this study, BRRI Rec., BRRI-LCC and BRRI-USG
Table 4. Rice grain yield with different management options during Aman seasons in farmers’ fields of central Bangladesh,
2009-2011.
Treatments Grain yield (Mg∙ha
−1)
2009 2010 2011
FP 3.09 2.99 3.05
FP-QS 4.16 (35) 3.76 (26) 3.77 (24)
FP-USG 3.83 (24) 3.74 (25) 3.44 (13)
FP-LCC 3.77 (22) 3.67 (23) 3.49 (14)
BRRI-LCC 4.69 (52) 4.67 (56) 4.29 (41)
BRRI-USG 4.55 (47) 4.84 (62) 4.39 (44)
BRRI Rec. 4.71 (52) 4.73 (58) 4.48 (47)
F values for treat **
F values for year *
F values for treat x year NS
LSD0.05 for treat 0.34
LSD0.05 for year 0.22
LSD0.05 for treat x year -
CV (%) 11.6
OALibJ | DOI:10.4236/oalib.1101641 9 July 2015 | Volume 2 | e1641
Table 5.Rice grain yield with different management options during Boro seasons in farmers’ fields of central Bangladesh,
2009-2011.
Treatments Grain yield (Mg∙ha
−1)
2009-10 2010-11 2011-12
FP 3.96 3.99 4.04
FP-QS 4.54 (15) 4.47 (12) 4.88 (21)
FP-USG 4.45 (12) 4.04 (1) 4.26 (5)
FP-LCC 4.22 (7) 4.19 (5) 4.20 (4)
BRRI-LCC 5.31 (34) 5.45 (37) 5.12 (27)
BRRI-USG 5.21 (32) 5.50 (38) 5.23 (29)
BRRI Rec. 5.27 (33) 5.42 (36) 5.37 (33)
F values for treat **
F values for year NS
F values for treat x year *
LSD0.05 for treat 0.14
LSD0.05 for year -
LSD0.05 for treat x year 0.23
CV (%) 5.9
NS, *, ** for not significant, significant at 5 and 1% level, respectively.
management options reduced the yield gap of the farmers’ practice by 2.87 Mg∙ha−1. Results also revealed that
famers can able to trim down the existing gap by 1.49, 0.88 and 0.81 Mg∙ha−1 when only quality seeds, USG and
LCC were used with farmers’ management practice. The higher positive response of BRRI-LCC, BRRI-USG and BRRI recommended practices was due to the combined effects of certified seeds with seed treatment, healthy seedlings, optimum planting density, balanced fertilization, and better synchronization of N fertilization with plant needs. These findings suggest potential to increase farmers’ rice yields through BRRI recommended practices in an integrated way. Other studies in India and Bangladesh rice fields also reported comparatively higher yields in the range 0.8 - 2.0 Mg∙ha−1 with the use of improved methods of more than one crop production
factor in an integrated way [18]-[20].
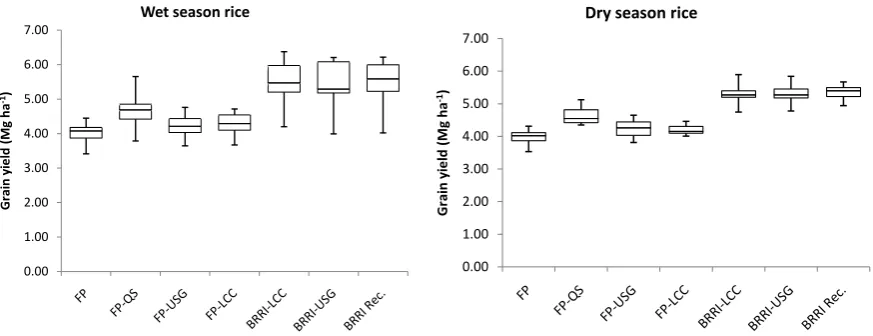
Box and whisker plots showed higher mean and median yield of wet and dry season rice on BRRI-LCC, BRRI-USG and BRRI Rec. treatments, with the lowest under farmers’ practice (Figure 4). The inter-quartile range (IQR—a measure of variability, based on dividing a data set into quartiles) was higher in wet season rice and lower in dry season rice, indicating higher variability in the former than the latter.
In wet season, Box and whisker plots for grain yields under BRRI-LCC, BRRI-USG and BRRI Rec. treat-ments showed higher variability than the other treattreat-ments. High variation in rainfall and maximum temperature during the study period may have the contribution in higher grain yield variability (Figure 2andFigure3). Whereas, BRRI-LCC, BRRI-USG and BRRI Rec. treatments showed lower variability in dry season rice. Lower variability of dry season rice yield may be the consequence of lower variation in minimum and maximum tem-perature in dry seasons (Figure 3). A similar observation was reported by [21] who examines the relationship between the yield of three major rice crops (e.g., Aus, Aman and Boro) and three main climate variables (e.g., maximum temperature, minimum temperature and rainfall) for Bangladesh.
3.2. Economic Analysis
OALibJ | DOI:10.4236/oalib.1101641 10 July 2015 | Volume 2 | e1641
Figure 4. Box and whisker plots showing variability of grain yield of wet and dry season rice under different management
options across 3 years of experimentation in central Bangladesh.
added costs associated with BRRI management practices involved treatments in at least 75% of the farmers’ fields were ≥$94 - 123 ha−1in Aman and ≥$77 - 114 ha−1 in Boro. These added costs for BRRI Rec., BRRI-
LCC and BRRI-USG∙management options were mainly because of the additional application of P, K, Zn and additional labor requirement with these management options. The large ranges in added costs suggest substantial variation in the amounts of additional P, K, Zn and labor use.
The average added costs for FP-QS in Aman and Boro across years was $13ha−1. The average added costs for
FP-USG in Aman and Boro across years ranged from $31 to 49 ha−1 and from $33 to 49 ha−1, respectively. The
added costs associated with FP-USG in at least 75% of the farmers’ fields were ≥$33 - 46 ha−1 in Aman and ≥
$35 - 49 ha−1 in Boro. This cost for FP-USG was mainly because of the additional labor requirement with USG
placement. FP-LCC management option did not impose any additional cost both in Boro and Aman across years except in Aman, 2011.
The average added net returns with BRRI recommended management option and BRRI recommended man-agement practices along with two N manman-agement options were always positive, ranging from US $175 to 362 ha−1 in Aman and from US$159 to 265 ha−1 in Boro across years. The added net returns associated with BRRI-
LCC, BRRI-USG and BRRI recommended practices in at least 75% of the farmers’ fields were ≥$305 to 440 ha−1 in Aman and ≥$196 to 324 ha−1 in Boro (Table 6). The average added net return was highest with BRRI
recommended management practice compared with other treatments in both seasons across three years. The av-erage added net returns were higher with BRRI–LCC than with BRRI–USG in both seasons, suggesting LCC-aided N management as a more profitable option than USG. The average added net return with FP-QS was ranging from US $ 146 to 233 ha−1 in Aman and from US$101 to 177 ha−1 in Boro across years. The added net
returns associated with FP-QS in at least 75% of the farmers’ fields were ≥$187 to 267 ha−1 in Aman and ≥$121
to 324 ha−1 in Boro. The average added net return with FP-LCC was ranging from US$ 96 to 173 ha−1 in Aman
and from US $37 to 60 ha−1 in Boro across years. The added net returns associated with FP-LCC in at least 75%
of the farmers’ fields were ≥$147 to 224 ha−1 in Aman and ≥$51 to 67 ha−1 in Boro. FP-USG resulted average
added net return ranging from US $42 to 159 ha−1 in Aman and from US $24 to 76 ha−1 in Boro across years.
The negative added net returns with FP-USG in at least 25% of the farmers’ fields were mainly due to high added costs ($34 - 46 ha−1) compared with added returns from increased yield (0.04 - 0.39 Mg∙ha−1) in Aman
2011, Boro 2010-11, and Boro 2011-12. The large ranges in added net returns ($115 to 662 ha−1) indicate large
farm-to-farm variability in the costs and gains associated with inputs and outputs for using BMP along with ei-ther LCC or USG across seasons and years (Table 6).
In Aman season, on an average per dollar net return (added net return divided by added cost) was highest in BRRI recommended management practices ($ 2.84) followed by BRRI-LCC ($ 2.70). But in Boro season, it was highest in BRRI-LCC ($ 2.54) followed by BRRI recommended management practices ($2.40). The results suggested that BRRI recommended management practices and BRRI-LCC were more profitable option com-pared to others.
0.00 1.00 2.00 3.00 4.00 5.00 6.00 7.00 G ra in y ie ld (Mg h a -1)
Wet season rice
0.00 1.00 2.00 3.00 4.00 5.00 6.00 7.00 G ra in y ie ld (Mg h a -1)
OALibJ | DOI:10.4236/oalib.1101641 11 July 2015 | Volume 2 | e1641
Table 6. Added costs and added net returns with different management practices during Aman and Boro seasons in farmers’
fields of central Bangladesh, 2009-2012.
Management practices Added cost (US $ ha
−1) Added net return (US $ ha−1)
Mean Range 25% quartile 75% quartile Mean Range 25% quartile 75% quartile
Aman 2009
FP-QS 13 13 13 13 233 94 to 456 156 267
FP-USG 34 31 to 37 34 35 137 103 to 217 104 146
FP-LCC 0 0 0 0 154 65 to 243 111 198
BRRI-LCC 101 100 to 102 100 102 270 69 to 482 124 409
BRRI-USG 121 119 to 124 119 122 215 −32 to 425 82 365
BRRI Rec. 101 100 to 102 100 102 273 91 to 444 126 426
Aman 2010
FP-QS 13 13 13 13 184 20 to 443 91 209
FP-USG 32 31 to 35 31 33 159 −38 to 412 5 262
FP-LCC 0 0 0 0 173 28 to 420 39 224
BRRI-LCC 93 92 to 94 92 94 338 155 to 662 173 386
BRRI-USG 112 107 to 115 109 113 362 142 to 630 268 440
BRRI Rec. 93 92 to 94 92 94 353 135 to 626 222 394
Aman 2011
FP-QS 13 13 13 13 146 4 to 237 138 187
FP-USG 44 39 to 49 41 46 42 −12 to 126 −4 60
FP-LCC 2 2 2 2 96 19 to 223 36 147
BRRI-LCC 97 95 to 98 98 98 177 −37 to 328 92 305
BRRI-USG 120 118 to 123 118 123 175 −88 to 349 109 346
BRRI Rec. 101 100 to 102 100 102 213 −42 to 375 150 361
Boro 2009-10
FP-QS 13 13 13 13 118 63 to 166 119 121
FP-USG 35 33 to 39 33 37 76 41 to 107 54 89
FP-LCC 0 0 0 0 60 29 to 79 58 67
BRRI-LCC 82 81 to 83 81 83 222 164 to 299 175 238
BRRI-USG 96 92 to 99 92 97 185 139 to 210 184 200
BRRI Rec. 77 75 to 79 75 77 218 163 to 274 190 238
Boro 2010-11
FP-QS 13 13 13 13 101 −3 to 221 35 137
FP-USG 34 33 to 37 33 35 −24 −115 to 42 −69 35
FP-LCC 0 0 0 0 47 −13 to 132 31 51
BRRI-LCC 86 84 to 86 84 86 265 132 to 344 243 324
BRRI-USG 99 99 to 100 99 100 263 128 to 374 203 320
BRRI Rec. 103 100 to 107 101 105 241 80 to 414 221 245
Boro 2011-12
FP-QS 13 13 13 13 177 65 to 276 132 231
FP-USG 46 44 to 49 44 49 3 −19 to 24 −4 8
FP-LCC 0 0 0 0 37 −12 to 98 17 62
BRRI-LCC 86 83 to 86 86 86 159 66 to 232 91 219
BRRI-USG 111 106 to 114 109 114 158 48 to 272 115 196
OALibJ | DOI:10.4236/oalib.1101641 12 July 2015 | Volume 2 | e1641
The higher positive added net returns with the use of BRRI-LCC, BRRI-USG and BRRI recommended man-agement practices in the majority of farmers’ fields confirmed that they are ready for wide-scale evaluation and promotion in Bangladesh. Our results suggest that BRRI recommended management practices and BRRI rec-ommended management practices along with either LCC or USG can be promoted through integration with the farmers’ own portfolio of practices for increased profitability. The markedly increased yield and profit for rice in Bangladesh reported in another study [19] arise from the use of LCC-based N management combined with im-proved management of other nutrients and imim-proved weed control.
4. Conclusion
Efficient and judicious integration of improved crop management practices along with the farmers’ management practices has scope to increase rice production in Bangladesh. About 27% - 62% grain yield increases with BRRI-LCC, BRRI-USG and BRRI recommended management practices resulting in farmers’ net profit increase of US $158 to 362 ha−1. Adoption of BRRI-LCC, BRRI-USG and BRRI recommended management practices in
an integrated way can be a measure to attain productivity through minimizing yield gap. A massive and effective program for wider demonstration, refinement, and dissemination of BRRI-LCC, BRRI-USG and BRRI recom-mended management practices in an integrated way throughout the country may be taken to improve the prod-uctivity and profit from rice farming.
5. Limitation of the Study
Although the selected fields were in same ecosystem, soil physical and chemical properties analysis might assist in better interpretation of the findings.
References
[1] Young, A. (1999) Is There Really Spare Land? A Critique of Estimates of Available Cultivable Land in Developing Countries. Environment, Development and Sustainability, 1, 3-18. http://dx.doi.org/10.1023/A:1010055012699 [2] IRRI (2008) I.R.R.I. Responding to the Rice Crisis: How IRRI Can Work with Its Partners. IRRI, Los Baños, 1-14. [3] Aureus, M. (2011) The Rise of Rice. Rice Today, Jan-Mar, IRRI, Los Baños, 16.
[4] Bangladesh Economic Review (2009) Government of the People’s Republic of Bangladesh Ministry of Finance, Dha-ka.
[5] FAO (2012) FAOSTAT. Food and Agriculture Organization of the United Nations—For a World without Hunger, Sta-tistics Division. http://faostat.fao.org/
[6] Mukherjee, N., Choudhury, G.A., Khan, M.F.A. and Islam, A.K.M.S. (2011) Implication of Changing Consumption Pattern on Food Security and Water Resources in Bangladesh. Proceedings of the 3rd International Conference on Water and Flood Management (ICWFM 2011), Dhaka, 8-10 January 2011, 731-738. (ISBN: 978-984-33-2298-2) [7] Ladha, J.K., Pathak, H., Padre, A.T., Dawe, D. and Gupta, R.K. (2003) Productivity Trends in Intensive Rice-Wheat
Cropping Systems in Asia. In: Ladha, J.K., Hill, J., Gupta, R.K., Duxbury, J. and Buresh, R.J., Eds., Improving the Productivity and Sustainability of Rice-Wheat Systems: Issues and Impacts, ASA Special Publication 65, American Society of Agronomy, Madison, 45-76. http://dx.doi.org/10.2134/asaspecpub65.c3
[8] Pathak, H., Ladha, J.K., Aggarwal, P.K., Peng, S., Das, S., Singh, Y., Singh, B., Kamara, S.K., Mishra, B., Sastri, A.S.R.A.S., Aggarwal, H.P., Das, D.K. and Gupta, R.K. (2003) Climatic Potential and On-Farm Yield Trends of Rice and Wheat in the Indo-Gangetic Plains. Field Crops Research, 80, 223-234.
http://dx.doi.org/10.1016/S0378-4290(02)00194-6
[9] Ladha, J.K., Kumar, V., Alam, M.M., Sharma, S., Gathala, M.K., Chandna, P., Saharawat, Y.P. and Balasubramanian, V. (2009) Integrating Crop and Resource Management Technologies for Enhanced Productivity, Profitability and Sus-tainability of the Rice-Wheat System in South Asia. In: Ladha, J.K., Yadvinder, S., Erenstein, O. and Hardy, B., Eds.,
Integrated Crop and Resource Management in the Rice-Wheat System of South Asia, International Rice Research In-stitute, Los Baños, 69-108.
OALibJ | DOI:10.4236/oalib.1101641 13 July 2015 | Volume 2 | e1641 [14] Fertilizer Recommendation Guide (2005) Bangladesh Agricultural Research Council (BARC), Dhaka.
[15] Alam, M.M., Buresh, R.J., Ladha, J.K. and Khan, A.H. (2004) Site-Specific Nutrient Management (SSNM) for Rice. Bangladesh Rice Research Institute, Gazipur, 13-17.
[16] BRRI (2008) Adhunik Daner Chas (A Bangali Publication). Bangladesh Rice Research Institute, Gazipur.
[17] Gomez, K.A. and Gomez, A.A. (1984) Statistical Procedure for Agricultural Research. 2nd Edition, John Willey and Sons, Singapore City, 28-192.
[18] Regmi, A.P., Tripathi, J., Giri, G.S., Bhatta, M.R., Sherchan, D.P., Karki, K.B., Tripathi, B.P., Kumar, V. and Ladha, J.K. (2009) Improving Food Security through Integrated Crop and Resource Management in the Rice-Wheat System. In: Ladha, J.K., Yadvinder-Singh, Erenstein, O. and Hardy, B., Eds., Integrated Crop and Resource Management in the Rice-Wheat System of South Asia, International Rice Research Institute, Los Baños, 69-108.
[19] Alam, M.M., Ladha, J.K., Khan, S.R., Rashid, H.F., Khan, A.H. and Buresh, R.J. (2005) Leaf Color Chart for Manag-ing Nitrogen Fertilizer in Lowland Rice in Bangladesh. Agronomy Journal, 97, 949-959.
http://dx.doi.org/10.2134/agronj2004.0206
[20] Alam, M.M., Ladha, J.K., Rahman, Z.F., Khan, S.R., Rashid, H., Khan, A.H. and Buresh, R.J. (2006) Nutrient Man-agement for Increased Productivity of Rice-Wheat Cropping System in Bangladesh. Field Crops Research, 96, 374- 386. http://dx.doi.org/10.1016/j.fcr.2005.08.010
[21] Sarker, M.A.R., Alam, K. and Gow, J. (2012) Exploring the Relationship between Climate Change and Rice Yield in Bangladesh: An Analysis of Time Series Data. Agricultural Systems, 112, 11-16.