IJPSR (2019), Volume 10, Issue 1 (Research Article)
Received on 20 May 2018; received in revised form, 10 November 2018; accepted, 12 November 2018; published 01 January 2019
FORMULATION AND EVALUATION OF α-TOCOPHEROL ACETATE TABLET BY
LIQUID-SOLID TECHNOLOGY
Anupam Kumar Sachan *, Vineet Kumar, Sunil Kumar, Kiran Kumari and Jitendra Kumar
Dayanand Dinanath College, Institute of Pharmacy, Ramaipur, Kanpur - 209214, Uttar Pradesh, India.
ABSTRACT: The objective of this research was to develop a liquisolid (LS) formulation of dl-α tocopherol acetate with improved dissolution properties and evaluate its strength to excipient modifications as well as its stability. Microcrystalline cellulose (MCC) and sodium starch glycolate (SSG) was employed as carrier material and disintegrant respectively for preparing LS compacts. Colloidal silicon dioxide (CSD) was selected as coating materials. All the precompression parameters such as tapped density, bulk density, carr's index, hausner's ratio and angle of repose show the good flow properties of the formulation. UV and FTIR evaluated the physicochemical properties of the liquisolid system. All studies revealed that no interaction between drug and the carrier. The drug release rates of liquisolid compacts were specifically higher as compared to regular tablets. The specific surface areas of coating materials affected the flow properties of the blends, and the particle sizes of coating materials affected the dissolution rate. The selected formulation demonstrated stability for atleast 3 months. The F3 formulation is found to be the optimized formulation. The liquisolid system was an effective approach to prepare dl-ɑ tocopherol acetate tablets with enhanced dissolution properties.
INTRODUCTION:
Liquisolid (LS) Technology: Solubility is one of the important parameters to achieve the desired concentration of drug in systemic circulation for a pharmacological response. Poor water-soluble drugs will be naturally released at a slow rate due to their limited dissolution rate within the gastrointestinal tract (GIT). The challenge for poor water-soluble drugs is to increase the rate of dissolution 2. Different techniques have been employed to formulate oral drug delivery system that would enhance the dissolution profile and change the absorption efficiency of poorly water-soluble drugs 1.
QUICK RESPONSE CODE
DOI:
10.13040/IJPSR.0975-8232.10(1).329-36
The article can be accessed online on
www.ijpsr.com
DOI link: http://dx.doi.org/10.13040/IJPSR.0975-8232.10(1).329-36
LS technique has been successfully employed to improve the dissolution rate of poorly water soluble or water insoluble drugs which belong to the Biopharmaceutical Classification System (BCS) Class II or IV. The liquisolid technique developed by Spireas and Bolton et al., (1999). These techniques take advantage of the improved dissolution rate resulting from the addition of a solubilizing agent, particle size reduction or the drug already dissolved or amorphous state 2, 3.
Classification of LS Systems: 4Based on the type of liquid medication encapsulated, LS systems may be classified into three subgroups:-
1. Powdered drug solutions. 2. Powdered drug suspensions. 3. Powdered liquid drugs.
Simultaneously, based on the formulation technique used, LS systems may be classified into two categories namely:-
Keywords:
Liquisolid (LS) technology, α -Tocopherol acetate, MCC (102), DCP,
Aerosil 200, PVP K 30, Solubility studies
Correspondence to Author: Anupam Kumar Sachan
Associate Professor,
Dayanand Dinanath College, Institute of Pharmacy, Ramaipur, Kanpur - 209214, Uttar Pradesh, India.
1. Liquisolid Compacts.
2. Liquisolid Microsystems.
The term LS compacts refer to immediate or sustained-release tablets or capsules prepared, combined with the inclusion of appropriate excipients required for tableting or encapsulation, such as lubricants and rapid or sustained release action, such as disintegrants or binders, respectively.
The term LS microsystems refer to capsules prepared by combining the drug with the carrier and the coating materials with the inclusion of an additive in the liquid medication wherein the resulting unit size may be as much as five times that of LS compacts 3.
Concept: When the liquid drug (dl-ɑ-tocopherol acetate) incorporated into a carrier material (microcrystalline cellulose, Silica, and dibasic calcium phosphate) adsorption of the liquid onto the internal and external surfaces of the porous carrier particles occur. Then, the coating material having high adsorptive properties and large specific surface area gives the liquisolid system the desired flow characteristics. In liquisolid systems, the drug is already liquid vehicle, while at the same time, it is carried by the powder particles (microcrystalline cellulose and silica). Thus, due to significantly increased wetting properties and surface area of drug available for dissolution, liquisolid compacts of water-insoluble substances may be expected 4.
Advantages of LS Systems: 8
1. Water insoluble drugs can be formulated into LS systems.
2. Improved availability of an orally administered poorly water-soluble drug is achieved when the drug is in solution form.
3. Optimized rapid release LS tablets or capsules of poorly water-soluble drugs exhibit improved
in-vitro and in-vivo drug release as compared to their commercial counterparts.
4. Can be applied to formulate liquid medications such as oily liquid drugs.
5. The drug release can be modified using suitable formulation ingredients.
6. It can be used in controlled drug delivery, and zero-order release also is obtained.
7. The production cost of liquisolid system is lower than that of soft gelatin capsules because the production of LS systems is similar to that of conventional tablets.
Limitations of LS Systems: 8
1. This system is only for slightly/very slightly water-soluble and practically water-insoluble drugs.
2. To get acceptable flowability and
compactibility for liquisolid powder
formulation, high levels of carrier and coating materials should be added. This will increase the weight of tablets to above one gram which makes them difficult to swallow.
3. The liquisolid method has drug loading capacities, and they require high solubility of the drug in non-volatile liquid vehicles.
MATERIALS AND METHODS: 2
Materials: dl-α tocopherol acetate (99.6%) provide was provided by Tiwari chemicals, Nalagarh, Solan (Himachal Pradesh) as a gift sample, nm-sized amorphous silicon dioxide (gift sample of logos pharma Nalagarh, Solan, Himachal Pradesh), Microcrystalline cellulose (gift sample of Logos Pharma, Nalagarh, Solan, Himachal Pradesh), Dibasic calcium phosphate (gift sample of Logos Pharma, Nalagarh, Solan, Himachal Pradesh), Sodium starch glycolate (gift sample of Torrent Pharma, Solan, Himachal Pradesh, Magnesium stearate (S.D Fine chemical limited, Mumbai), PVP K-30 (C.D.H. Pvt. Ltd., New Delhi), Potassium dihydrogen phosphate (Thomas Fisher Scientific India Pvt. Ltd.), Talc (C.D.H. Pvt. Ltd., New Delhi).
Equipment: Electric weight balance, UV-Visible spectrophotometer, Rotary tablet compression machine, Tablet Hardness Tester, Friability tester, Disintegration test apparatus, Dissolution apparatus.
Methodology: 6
Solubility Studies: The solubility studies of the drug were carried out in different non-volatile solvents and different media at different pH.
Wet Granulation Method by Liquisolid System:
6
polyvinylpyrrolidone K-30 in water was used as a binder to prepare granules. The prepared granules were compressed into tablets by rotary tablet compression machine.
Formulation Table of dl-α-tocopherol Acetate Tablet (Wet Granulation Method by Liquisolid
[image:3.612.51.558.160.287.2]System): Each formulation contains two different carriers MCC and dibasic calcium phosphate (Fujicalin) and aerosil 200 as the coating material. The appropriate amounts of carrier and coating materials used for each formulation depend upon optimum liquid load factor (Lf) of that formulation.
TABLE 1: COMPOSITION OF dl-α-TOCOPHEROL ACETATE TABLET FORMULATION
S. no. Ingredient Name F1 (mg) F2 (mg) F3 (mg) F4 (mg) F5 (mg) F6 (mg)
1 dl-α-tocopherol acetate 200 200 200 200 200 200
2 MCC 500 550 600 - - -
3 Dibasic calcium phosphate (fujicalin) - - - 500 500 600
4 Aerosil 200 125 110 100 125 110 100
5 Sodium starch glycolate (3%) 8.7 9.1 9.5 8.7 9.1 9.5
6 Magnesium Stearate (1%) 8.7 9.1 9.1 8.7 9.1 9.1
7 Talc (1%) 8.7 9.1 9.1 8.7 9.1 9.1
8 PVP K30 (2%) qs qs qs qs qs qs
Total Weight 868.4 905.3 947.4 868.4 905.3 947.4
Analytical Methods:
Preparation of pH 7.4 Phosphate Buffer: 7
1. Potassium Dihydrogen Phosphate, 0.2 M: Dissolve 27.218 g potassium dihydrogen phosphate in water and dilute with water to 1000 ml.
2. Sodium hydroxide, 0.2 M: Dissolve 8 g of sodium hydroxide in water and dilute with water to 1000 ml.
2. Place 50.0 ml of 0.2M potassium hydrogen phosphate in a 200 ml volumetric flask, add the 22.4 ml of 0.2M sodium hydroxide and then add water to volume up to 200 ml.
Preparation of Calibration Curve: 7 Calibration curve of drug dl-α tocopherol acetate was prepared by the stock solution of 100 mg drug in 100 ml of phosphate buffer (pH 7.4), that is 1000 μg/ml. Kept for one hour for the complete reaction then filtered with Whatman filter paper. Finally, from the stock solution take 1 ml in 100 ml of volumetric flask and volume makeup to 100ml with the phosphate buffer. 10 μg/ml stock solution II was prepared from which further dilution was prepared of 5 μg/ml, 10 μg/ml, 15 μg/ml, 20 μg/ml solution.
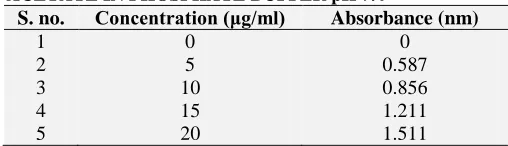
TABLE 2: CALIBRATION DATA OF dl-α TOCOPHEROL ACETATE IN PHOSPHATE BUFFER pH 7.4
S. no. Concentration (μg/ml) Absorbance (nm)
1 0 0
2 5 0.587
3 10 0.856
4 15 1.211
5 20 1.511
Absorbance was measured at 283 nm, and a calibration curve was prepared. The correlation coefficient and equation of line were obtained from the data obtained from calibration.
FIG. 1: CALIBRATION CURVE OF dl-α TOCOPHEROL ACETATE IN PHOSPHATE BUFFER pH 7.4
Evaluation Parameters:
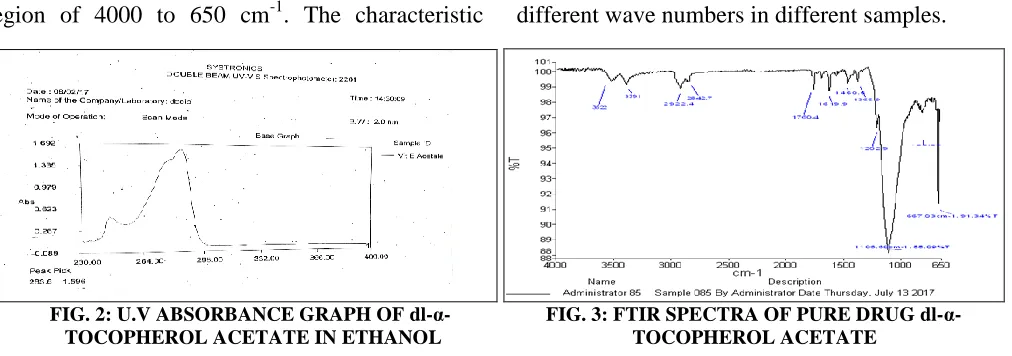
Identification of Drug by UV-Visible Spectrophotometer: The (λmax) was determined by
preparing the sample solution of the 10 µg/ml in Phosphate buffer (pH 7.4) and further the sample was scanned at the range of 200-400 nm by using
Double beam UV-visible Spectrophotometer
(Systronics 2201). It was observed that the maximum absorbance was seen at 283-284 nm, which was regarded as the λmax of the drug dl-α
tocopherol acetate.
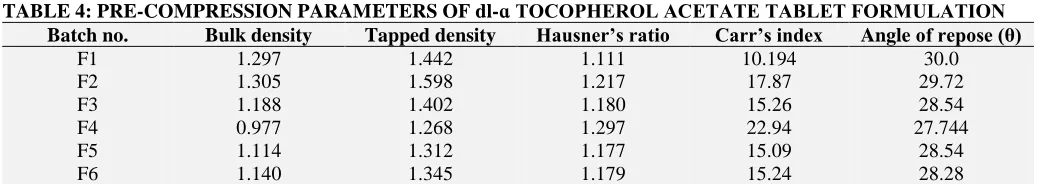
[image:3.612.314.567.364.485.2] [image:3.612.45.299.676.749.2]The spectrum was recorded in the wavelength region of 4000 to 650 cm-1. The characteristic
absorption peaks of the drug were obtained at different wave numbers in different samples.
[image:4.612.56.562.68.246.2]FIG. 2: U.V ABSORBANCE GRAPH OF dl-α- FIG. 3: FTIR SPECTRA OF PURE DRUG dl-α- TOCOPHEROL ACETATE IN ETHANOL TOCOPHEROL ACETATE
TABLE 3: INTERPRETATION OF IR SPECTRA OF PURE DRUG dl-α-TOCOPHEROL ACETATE
S. no. Functional group Range (cm-1) Observed frequency (cm-1)
1 C-O-C Methoxy 1000-1200 1106.6
2 C=O Ester 1750-1730 1760.4
3 C=C Stretching 1680-1600 1619.9
4 C-H Stretching 3000-2850 2922
Pre-Compression Parameters: 3
Angle of Repose: 3, 16 The diameter of the powder cone was measured, and the angle of repose was calculated using the following equation.
Ɵ = tan-1 (h/r)
Where ‘h’ is the height, and ‘r’ is the radius of the powder cone.
Density: 3 The bulk density (BD) and tapped density (TD) were determined and calculated by using the following formulas.
Bulk density = Weight of powder / Bulk volume
Tapped Density = Weight of powder / Tapped volume
Percentage Compressibility: 3, 10 Percent compressibility of powder mix was determined by Carr’s compressibility index calculated by following formula.
Carr’s Index % = TD-BD / TD × 100
Where ‘TD’ is the tapped density, and ‘BD’ is the bulk density.
Hausner's ratio: Hausner’s ratio was determined as the ratio between the tapped density to that bulk density. The formula calculates it:
Hausner’s Ratio = TD / BD
Where TD = tapped density and BD = bulk density.
Post-Compression Parameters: 12
Size and Shape: The size and shape of the tablet can be dimensionally described, monitored and controlled.
Tablet Thickness: Thickness and diameter of tablets were important for uniformity of tablet size. Thickness and diameter were measured using venire caliper.
Weight Variation: Twenty tablets were weighed individually, and the average weight was calculated. Based on the obtained weight, % weight variation was calculated using the formula.
% Weight Variation = Average weight- Individual weight × 100 / Average weight
Friability: The friability of tablets was determined by digital friability test apparatus (model-902) in which tablet was subjected to the combined effect of abrasions and shock in a plastic chamber revolving at 25 rpm and dropping the tablets at the height of 6 inches in each revolution. A pre-weighed sample of the tablet was placed in the friabilator and allowed to rotate for 100 revolutions (5 minutes). Later the tablets were degusted, and the tablets were reweighed.
The formula gives percentage friability
Where W0 is the weight of the tablets before the
test; W is the weight of tablets after the test; Limits for friability are % F should not be more than 1%.
Hardness (Crushing Strength): The hardness of the tablet of each formulation was measured by Monsanto hardness tester. The hardness was measured in kg/cm2.
Wetting Time and Water Absorption Ratio: 18 To determine the wetting time of vitamin E tablet, a piece of tissue paper was taken, and it was folded twice and placed in a culture dish (d = 6.5 cm) containing about 6 ml of purified water. Vitamin E tablet was placed on tissue paper. The time required for complete wetting was measured. To determine the water absorption ratio, the wetted tablets were transferred to a tissue paper and wiped off excess water and weighed immediately. The following formula given an equation calculated the water absorption ratio.
R = Wa – Wb × 100 / Wa
Where Wb is the weight of tablet before the study; Wa is the weight of tablet after study 39.
Disintegration Test: 3 Disintegration test is a method to evaluate the rate of disintegration of tablets. It is also defined as for breakdown of solid dosage form into smaller particles when it is disintegrated. Place 1 tablet in each of the 6 tubes and added a disc to each tube. Maintain the temperature of the disintegration media at 37 ± 2 ºC as specified in the monographs. At the end of the time limit specified, left the basket from fluid and observed the tablets. If 1 or 2 tablets fail to disintegrate completely repeat the test on 12 additional tablets. Not less than 16 out of 18 tablets tested disintegrate completely.
In-vitro Dissolution Study: 4, 5 The dissolution study of the dl-α-tocopherol tablet was performed USP dissolution testing apparatus type II with a
paddle stirrer. The speed of rotation of paddle was set at 70 rpm. The dissolution study was performed using 900 ml of phosphate buffer pH 7.4 maintained at a temperature of 37 ± 0.5 °C. At different time intervals (5, 10, 20 and 30 min), 5 ml of the samples were withdrawn and replaced with 5ml of phosphate buffer pH 7.4 at the maintained temperature of 37 ± 0.5 °C. The samples withdrawn were analyzed at 283 nm for drug release and release kinetics by using UV spectrophotometer after suitable dilutions. The % drug release was calculated using the calibration curve of the drug in phosphate buffer pH 7.4.
Stability Studies: Stability of optimized formulation was carried out according to the ICH guidelines. The optimized formulation was stored at 40 ± 2 ºC and 75 ± 5% RH for 3 months, and the effect on release profile and the crushing strength were compared with those of freshly prepared tablets.
RESULTS AND DISCUSSION: Solubility of the drug was determined by dissolving 10 mg of the drug in 10 ml different solvents. Drug sample was found to be freely soluble in the solvent in ethanol and acetone, chloroform and phosphate buffer (7.4) by using solubilizing agent bile salt. Calibration curve of drug (dl-α tocopherol acetate) was prepared by the stock solution of 100 mg drug in 100ml of phosphate buffer (pH 7.4), i.e. 1 mg/ml solution of the drug. Similarly, the calibration curve was prepared, and absorbance was measured at 283-284 nm. The graph was then plotted, and the R2 value (correlation coefficient) and the equation of line were obtained from the data obtained from calibration. Compatibility studies between the drug and polymer mixture were performed using FTIR technique by preparing a powder of the mixture of drug-polymer and identify the presence of organic functional groups. The characteristic absorption peaks of dl-α tocopherol acetate were obtained at different wave numbers in different samples.
[image:5.612.47.567.659.751.2]Pre-Compression Parameters:
TABLE 4: PRE-COMPRESSION PARAMETERS OF dl-ɑ TOCOPHEROL ACETATE TABLET FORMULATION Batch no. Bulk density Tapped density Hausner’s ratio Carr’s index Angle of repose (θ)
F1 1.297 1.442 1.111 10.194 30.0
F2 1.305 1.598 1.217 17.87 29.72
F3 1.188 1.402 1.180 15.26 28.54
F4 0.977 1.268 1.297 22.94 27.744
F5 1.114 1.312 1.177 15.09 28.54
Post-Compression Parameters:
TABLE 5: POST-COMPRESSION PARAMETERS OF dl-ɑ TOCOPHEROL ACETATE TABLET FORMULATION Batch no. Diameter (mm) Hardness (kg/cm2) Thickness (mm) Friability (%) Drug content (%)
F1 10.5 4.75 8.2 0.98 90.7
F2 10.5 4.44 8.1 0.80 93.1
F3 10.5 4.68 8.2 0.92 94.6
F4 10.5 4.88 7.4 0.88 90.8
F5 10.5 4.92 7.4 0.79 92.6
F6 10.5 4.39 7.6 0.94 91.6
TABLE 6: POST-COMPRESSION PARAMETERS OF dl-ɑ TOCOPHEROL ACETATE TABLET FORMULATION Batch no. Weight variation (mg) Wetting time (sec) Disintegration time (sec) Water absorption ratio (%)
F1 865.4 48 75 30.40
F2 918.6 52 78 28.87
F3 935.2 47 65 34.19
F4 875.5 68 85 23.43
F5 920.4 72 87 32.19
F6 958.7 55 92 37.61
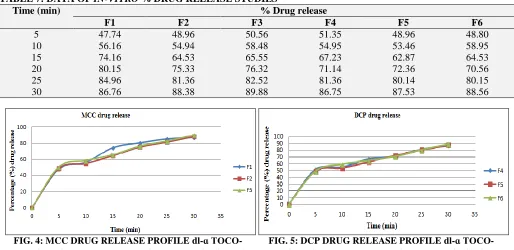
In-vitro Dissolution Studies: The dissolution profiles of the liquisolid tablets of dl-α tocopherol acetate are shown in Fig. 4 and 5. The percentage drug released after different time intervals (5, 10,
20 and 30 min) are shown in Table 7. The formulation F3 showed higher drug release (89.88%) in 30 min.
TABLE 7: DATA OF IN-VITRO % DRUG RELEASE STUDIES
Time (min) % Drug release
F1 F2 F3 F4 F5 F6
5 47.74 48.96 50.56 51.35 48.96 48.80
10 56.16 54.94 58.48 54.95 53.46 58.95
15 74.16 64.53 65.55 67.23 62.87 64.53
20 80.15 75.33 76.32 71.14 72.36 70.56
25 84.96 81.36 82.52 81.36 80.14 80.15
30 86.76 88.38 89.88 86.75 87.53 88.56
FIG. 4: MCC DRUG RELEASE PROFILE dl-ɑ TOCO- FIG. 5: DCP DRUG RELEASE PROFILE dl-ɑ TOCO- PHEROL ACETATE TABLET FORMULATIONS F1-F3 PHEROL ACETATE TABLET FORMULATIONS F4-F6
In-vitro Drug Release Kinetics: A number of theories and kinetic models were described the drug release category of immediate release and modified release dosage forms, by using dissolution data and quantitative interpretation of values obtained in dissolution assay if facilitated by the usage of the generic equation dosage form that mathematically translates the dissolution curve in
function of some parameters related to
pharmaceutical dosage form. In the present work, some analytical models were used to study the mechanism of drug release of extended-release by following models.
TABLE 8: RELEASE KINETICS OF dl-ɑ TOCOPHEROL ACETATE TABLET OF ALL THE FORMULATIONS F1- F6 Formulations Zero-order
R2
First order R2
Hixon – Crowell R2
Higuchi R2
Kors mayers & Peppas model
F1 0.806 0.253 0.211 0.971 0.851
F2 0.833 0.250 0.211 0.977 0.848
F3 0.818 0.260 0.219 0.973 0.841
F4 0.802 0.265 0.223 0.963 0.834
F5 0.834 0.254 0.210 0.974 0.843
F6 0.814 0.261 0.221 0.969 0.840
TABLE 9: STABILITY ANALYSIS DURING ACCELERATED CONDITIONS
Month 40 ± 2 ºC, 75 ± 5% RH (Formulation F3)
Appearance Drug content Friability (%) Weight variation Hardness (kg/cm2) (n=10)
0 No change No change No change No change No change
1 No change 94.6 0.92 935.2 4.68
2 No change 94.6 0.92 935.2 4.68
3 No change 94.2 0.92 935.4 4.68
CONCLUSION: The present study was aimed to prepare α-tocopherol tablet by liquisolid system by wet granulation method. This method was applied successfully to prepare the α-tocopherol tablet formulation. The tablet identification tests were carried out FT-IR and UV spectrophotometric studies and the result indicated that the drug was pure tocopherol acetate. There is no interaction between the drug and excipients. The wet granulation method, the granules were evaluated the flow properties like bulk density, tapped density, compressibility index, hausner's ratio and angle of repose. The values find in prescribed limit and indicate good flow properties. The formulation F3 was considered as optimized formulation. The pre-compression parameters of F3 formulation show good flow properties. The formulation F3 showed 89.88% of drug release in 30 min. and has 4.68 kg/cm2 hardness, it indicated that formulation has good hardness. The kinetic release model follows the Higuchi model. Stability studies indicated that there was no significant change in optimized formulation.
ACKNOWLEDGEMENT: The authors
acknow-ledge the support received from my colleague. Dayanand Dinanath College, Institute of Pharmacy, Ramaipur, Kanpur, Uttar Pradesh for their support and encouragement to carry out this work.
CONFLICT OF INTEREST: All authors declare that they have no conflict of interest.
REFERENCES:
1. Charman SA and Charman WN: Oral modified release delivery systems. Modified release drug delivery technology. New York: Marcel Dekker 2003; 1-9.
2. Spireas S and Bolton SM: Liquisolid systems and methods of preparing same. The United States Patent 1999; 968, 550.
3. Spireas S: Liquisolid systems and methods of preparing same. United States Patent 2002; 6,423,339 B1.
4. Fahmy RH and Kassem MA: Enhancement of famotidine dissolution rate through liquisolid tablet formulation:
In-vitro and in-vivo evaluation. European Journal of
Pharmaceutics and Biopharmaceutics 2008; 69(3): 993-1003.
5. Saharan VA and Kukkar V: Dissolution enhancement of drugs Part I: Technologies and effect of carriers. International Journal of Health Research 2009; 2(2): 107124.
6. Lintz: Wet Granulation process. United States Patent 2006; 0057073A1.
7. Indian Pharmacopeia: Government of India, Controller of Publications, New Delhi, Edition 3rd, 2007: 477-478. 8. Burra S and Yamsani M: The liquisolid technique: An
overview. Brazilian Journal of Pharmaceutical Sciences 2011; 47(3): 475-482.
9. Pavia DL, Lampman G and Kriz G: Introduction of spectroscopy, Saunders college division, Edition 3rd, 2001. 10. Sachan AK and Singh S: Formulation and evaluation of
controlled floating tablet of Alprazolam. International Journal of Pharmaceutical Sciences 2016; 2(2): 38-42. 11. Baby DA and Saroj S: Mechanism of solubility of
liquisolid formulation in non- volatile solvent: A review. International Journal of Pharmacy and Pharmaceutical Sciences 2012; 4(3): 710-715.
12. Sachan AK, Tripathi, K and Visnoi G: Formulation development and characterization of piroxicam fast dissolving tablets approved for the treatment of arthritis. International Journal of Development Research 2015; 3440-3446.
13. Sachan AK and Gupta A: Design and characterization of solid dispersion based fast dissolving tablet of Cetirizine hydrochloride MIT. International Journal of Pharmaceutical Sciences 2015; 37-44.
14. Kavitha K and Raju NSL: Effect of dissolution rate by liquisolid compact approach: An overview. Der Pharmacia Lettre 2011; 3(1): 71-83.
16. Sachan AK and Verma AK: A review on fast dissolving tablet as an efficient technique for oral drug delivery. Journal of Chemical and Pharmaceutical Sciences 2013; 6(1): 29-34.
17. Rowe R and Sheskey PJ: Handbook of Pharmaceutical Excipients. Pharmaceutical Press and Washington, London, Edition 6th, 2009.
18. Sachan AK: A review on excipients used in oral liquid dosage forms. International Journal of Pharmacy & Technology 2017; 5709-5719.
19. Sharma S and Sher P: Adsorption of meloxicam on porous calcium silicate: Characterization and tablet formulation. American Association of Pharmaceutical Scientists Pharmaceutical Science and Technology 2005; 6(4): E618-625.
20. Shams T and Sayeed MS: Thermal, infrared characterization and in-vitro evaluation of repaglinide solid dispersion. Der Pharmacia Letter 2011; 3(6): 142-150.
All © 2013 are reserved by International Journal of Pharmaceutical Sciences and Research. This Journal licensed under a Creative Commons Attribution-NonCommercial-ShareAlike 3.0 Unported License.
This article can be downloaded to ANDROID OS based mobile. Scan QR Code using Code/Bar Scanner from your mobile. (Scanners are available on Google Play store)
How to cite this article: