Liesefeld, H.R. and Liesefeld, A.M. and Muller, Hermann and Rangelov,
D. (2017) Saliency maps for finding changes in visual scenes? Attention,
Perception, & Psychophysics 79 (7), pp. 2190-2201. ISSN 1943-3921.
Downloaded from:
Usage Guidelines:
This manuscript was published as Liesefeld, H.R., Liesefeld, A.M., Müller, H.J., & Rangelov,
D. (2017). Saliency maps for finding changes in visual scenes? Attention, Perception, &
Psychophysics, 79, 2190-2201. doi:10.3758/s13414-017-1383-9
© 2017 The Psychnomic Society. This article may not exactly replicate the final version
published. It is not the copy of record. The final publication is available at Springer via
http://dx.doi.org/10.3758/s13414-017-1383-9
Saliency maps for finding changes in visual scenes?
Heinrich René Liesefeld1, Anna Marie Liesefeld1, Hermann J. Müller1,2, Dragan
Rangelov1,3
1
Ludwig-Maximilians-Universität, München, Germany, 2Birkbeck College, London, UK,
3
Queensland Brain Institute, The University of Queensland, Brisbane, Australia
Author Note
This work was supported by RA 2191/1-1 grant of the German Research Foundation
(DFG), awarded to DR and by a Junior Research grant from LMU Munich‘s Institutional
Strategy LMUexcellent within the framework of the German Excellence Initiative, awarded to
HRL.
Correspondence concerning this article should be addressed to Heinrich René Liesefeld
Department Psychologie, Ludwig-Maximilians-Universität, Leopoldstr. 13, 80802 Munich,
Germany, phone: +49 89 2180-6302, E-mail: [email protected] or to Dragan
Rangelov, Queensland Brain Institute, University of Queensland, St Lucia 4072, Queensland,
Abstract
Sudden changes in the environment reliably summon attention. This rapid change detection
appears to operate in a similar fashion as pop-out in visual search, the phenomenon that very
salient stimuli are directly attended, independently of the number of distracting objects.
Pop-out is usually explained by the workings of saliency maps, i.e., map-like representations that
code for the conspicuity at each location of the visual field. While past research emphasized
similarities between pop-out search and change detection, our study highlights differences
between the saliency computations in the two tasks: in contrast to pop-out search, saliency
computation in change detection (i) operates independently across different stimulus
properties (e.g., color and orientation), and (ii) is little influenced by trial history. These
deviations from pop-out search are not due to idiosyncrasies of the stimuli or task design, as
evidenced by a replication of standard findings in a comparable visual-search design. To
explain these results, we outline a model of change detection involving the computation of
feature-difference maps, which explains the known similarities and differences with visual
search.
Keywords: visual short-term memory, race-model inequality (RMI), priority map,
Saliency maps for finding changes in visual scenes?
Perception provides only a sparse and biased representation of the external world. It is
clearly selective, with preference for the most salient stimuli. Additionally, our current and
recent motives and action goals influence what we select (Awh, Belopolsky, & Theeuwes,
2012), with a critical role assigned to memory processes (e.g., Kuhl & Chun, 2014). In the
present study, we examine a newly discovered influence of memory on perception (Hyun,
Woodman, Vogel, & Luck, 2009) and discuss its underlying mechanisms.
Many studies have shown that information held in visual working memory(VWM)
influences perception (e.g., Downing, 2000; Olivers, Meijer, & Theeuwes, 2006; Soto,
Heinke, Humphreys, & Blanco, 2005; Reinhart, McClenahan, & Woodman, 2016). Since
even a task-irrelevant stimulus matching VWM content is likely to capture attention, it has
been suggested that VWM content may serve as an attentional template influencing stimulus
selection (for reviews, see Olivers, Peters, Houtkamp, & Roelfsema, 2011; Soto, Hodsoll,
Rotshtein, & Humphreys, 2008). To date, this attentional-template hypothesis is the dominant
theoretical account for interactions between VWM and perception (Desimone & Duncan,
1995; Duncan & Humphreys, 1989; Humphreys & Müller, 1993; Olivers et al., 2011; Soto et
al., 2008; Shomstein & Yantis, 2002).
Recently, however, Hyun et al. (2009) reported a VWM effect on spatial attention that
cannot be explained by attentional templates. They used a change-detection task, in which
participants had to discern a change between two stimulus displays presented consecutively
with some delay. Each display comprised several differently oriented bars that, on a portion of
trials, were identical across displays. On the remaining trials, one bar changed its orientation.
Analysis of event-related potentials (ERPs) locked to the second display revealed a negative
deflection contralateral to the change location in the 170–270-ms range. This lateralized ERP
contralateral to the eliciting object), and the consensus in the literature is that the N2pc
reflects dynamics of spatial attention (for a review, see Luck, 2012). Consequently, the results
of Hyun et al. imply that the change attracts spatial attention. Importantly, the latency of the
N2pc was completely independent of the numbers of elements, indicating that attention was
guided directly to the change location. Since the precise feature values of the changed
elements are unpredictable, participants were effectively prevented from adopting any
particular attentional template that could have mediated this guidance. Accordingly, some
other kind of signal must have guided attention.
Guidance of attention towards the change location bears a striking resemblance with one
of the most robust and theoretically interesting findings in visual-attention research. When
participants search for one element that strongly differs from surrounding homogeneous
distractors (e.g., a tilted bar amongst many vertical bars), response speed varies little with an
increase in the number of distractors (e.g., Liesefeld, Moran, Müller, & Zehetleitner, 2016;
Nothdurft, 1993). Such flat search slopes for feature singletons are considered a hallmark of
pop-out search, in which the target element is mandatorily selected first.
Most theories of visuo-spatial attention account for pop-out in terms of an early
(pre-attentive) segmentation mechanism that partitions the scene into regions of high and low
interest: a saliency map. This map codes the saliency at each location of visual input, with the
most salient location summoning focal attention (e.g., Wolfe, 2007). Saliency depends on
local feature contrasts; thus, for example, a strongly tilted bar surrounded by vertical bars
would yield a strong feature-contrast signal and pop out. With this in mind, Hyun et al.’s
(2009) findings may be taken to indicate that, similar to feature singletons, changes pop out
because their locations are assigned the highest values on some saliency map. Importantly,
this map would not represent feature contrasts but rather change contrasts, that is, differences
between past (maintained in VWM) and present (currently displayed) sensory input. The
mechanisms are involved in finding visual targets and in detecting changes, by testing
whether behavioral effects that are robustly observed in pop-out search tasks persist in the
change-detection task.
A robust effect typically attributed to the dynamics of saliency maps are redundancy
gains: A search target differing from distractors in two attributes (redundant target) is found
faster than a target differing in just one attribute (single target); for example, a red-and-tilted
target against green-vertical distractors is easier to find than a red-vertical target. As
previously demonstrated (e.g., Miller, 1982), redundancy gains can arise from a simple race
between two signals. Evidence for the presence of the two target attributes is accumulated in
parallel and the first accumulator that reaches some criterion boundary will trigger target
detection. As both accumulators can trigger target detection, the one that reaches the boundary
first determines the response time on a given trial. If sometimes one and sometimes the other
signal wins the race (if the distributions of detection times for the two single signals are
overlapping), this yields faster detection of redundant signals relative to even the detection of
the, on average, easier single signal (redundancy gains).
Race models can explain redundancy gains only up to a certain boundary: if the race
model holds, RTs in the redundant condition can never be faster than as predicted by an ideal
race between the single signals. Violations of this so-called race-model inequality (RMI) have
been interpreted as evidence for co-activation, which means that the two signals are combined
into one stronger signal, rather than simply racing against each other (e.g., Feintuch & Cohen,
2002; Krummenacher, Müller, & Heller, 2001, 2002a,b; Krummenacher & Müller, 2014;
Mordkoff & Yantis, 1993). In the context of visual search, RMI violations imply the existence
of a supra-dimensional (master) saliency map at which all feature contrasts (e.g., both color
and orientation) are pooled together. Different attributes of the same item (e.g., a redundant
color/orientation target) would co-activate the same location on the spatio-topically organized
Krummenacher, & Müller, 2011). As the combined signal is stronger than each of the single
signals, target detection is expedited, resulting in strong redundancy gains.
As the RMI constitutes the upper bound on race models, RMI violations are a
conservative criterion for co-activation (Miller, 1982); that is, the presence of RMI violations
provides strong evidence for co-activation. The absence of RMI violations, by contrast, does
not constitute strong evidence against co-activation (see Ratko-Dehnert, 2013, for an in-depth
simulation study directly assessing this lack of power of the RMI-violation test). For the
visual domain, previous studies have shown that RMI violations occur only when the two
target attributes belong to the same object (or nearby objects, less than some 4° of visual
angle apart; Feintuch & Cohen, 2002; Krummenacher et al., 2002a), indicating that only
signals that emerge from the same (or nearby) spatial location(s) co-activate. Capitalizing on
the spatial restrictions on co-activation, a potentially more sensitive index of co-activation
(and therefore a stricter test for the absence of co-activation) is the difference in RTs between
a condition with one redundant target (redundant/same location) and a condition in which
also both target attributes are present, but in different objects (redundant/different locations).
If there is a simple race between the two attributes (i.e., if the two signals are not integrated in
any way), it should not matter whether they are present at the same or at different locations.
Shorter RTs in the same-location condition (relative to the different-locations condition)
would indicate that it matters whether the two signals can be integrated on a spatially
organized saliency map (Feintuch & Cohen, 2002; Krummenacher et al., 2002a); accordingly,
such a pattern of RTs is incompatible with a simple race.
A further common finding in visual search is that performance improves when the
target-defining dimension repeats across consecutive trials (e.g., orientation → orientation), relative
to dimension changes, (e.g., color → orientation). Repeating the precise target features (e.g.,
left-tilted → left-titled) yields only marginally faster responses than just repeating dimensions
feature-specific, in nature (Found & Müller, 1996; Müller, Heller, & Ziegler, 1995; Müller,
Reimann, & Krummenacher, 2003). These dimension-repetition effects probably reflect an
amplified influence of the previously relevant dimension on saliency signals at the
master-map level and the stronger signal, in turn, triggers faster target selection (dimension
weighting; Rangelov, Müller, & Zehetleitner, 2011a,b, 2012; Rangelov, Töllner, Müller, &
Zehetleitner, 2013; Töllner, Gramann, Müller, Kiss, & Eimer, 2008).
Finally, an additional intertrial-sequence effect emerges in visual-search tasks with
redundant targets: responses on single-target trials are slower following redundant-target trials
(e.g., color-and-orientation → color), relative to dimension-repetition single-target trials (e.g.,
color → color; redundancy costs; Krummenacher et al., 2001, 2002a,b). While
dimension-repetition effects demonstrate that spatial attention can be biased in favor of processing one or
the other stimulus dimension (dimension weighting), the existence of redundancy costs
demonstrates that a bias towards one dimension comes at a cost for other dimensions. This
adds to the evidence from RMI violations that different stimulus dimensions are not processed
independently.
Experiment 1
To test whether mechanisms generating feature-singleton pop-out generalize to change
pop-out, we employed a version of the change-detection task tailored for examining (i)
redundancy gains, (ii) co-activation, (iii) dimension-repetition effects, and (iv) redundancy
costs. To test these effects, the change could be either redundant (color and orientation) or
single (color only or orientation only), with redundant changes appearing either at the same
location or at different locations. If feature-singleton pop-out and change pop-out are
generated by similar mechanisms, all four effects should emerge in the change-detection task.
Methods
Participants. Thirty-two healthy human adults took part in the experiment for either
RMI violations and intertrial-sequence effects typically employ between 8 and 16 participants
(e.g., Krummenacher et al., 2001, 2002a,b). To detect even potentially weaker effects in
change detection (for which no prior experience is available), we doubled the higher of these
numbers. All participants had normal or corrected-to-normal visual acuity and normal color
vision (as confirmed by Ishihara color plates). All participants had extensive experience with
psychophysical experiments and all were naïve as to the purpose of the study. The experiment
was approved by the responsible ethics committee of the LMU Munich, and all participants
provided informed consent prior to the experiment. QUEST did not converge for 4
participants (see below) and 2 participants did not finish the experiment. These participants
were removed from subsequent data analyses. The final sample thus consisted of 26
participants (mean age: 25 years; 16 female). This is still larger than Saiki’s (2016) sample (N
= 23), who recently observed RMI violations in a different visual-working-memory task.
Stimuli and Design. Stimulus presentation (TFT screen, 1920 × 1080 pixels, 60 Hz,
viewing distance = 60 cm) and response collection (F and J key on a computer keyboard) was
controlled by a Matlab (The Mathworks) program, using functions from the Psychophysics
Toolbox (Brainard, 1997). Stimuli were colored and tilted arrowheads, 1.5° of visual angle in
width, randomly positioned on an imaginary circle (6° radius, 4° minimal distance between
stimuli) around a central fixation cross (0.5°) on a dark grey background. Colors were
randomly drawn from a circle in a luminance plane of the CIE Lab space (L = 63, center: a =
9, b = 27). Lab values were chosen to allow for large radii (up to 40) with colors displayable
in sRGB space. Radii were 20 in the first phase and scaled in the second phase (see below).
On each trial, one color and one orientation were selected randomly from the 360 possible
values. The remaining colors and orientations (if applicable) were then selected randomly
from a pool of six values (60° steps, starting at the original random value) so that any two
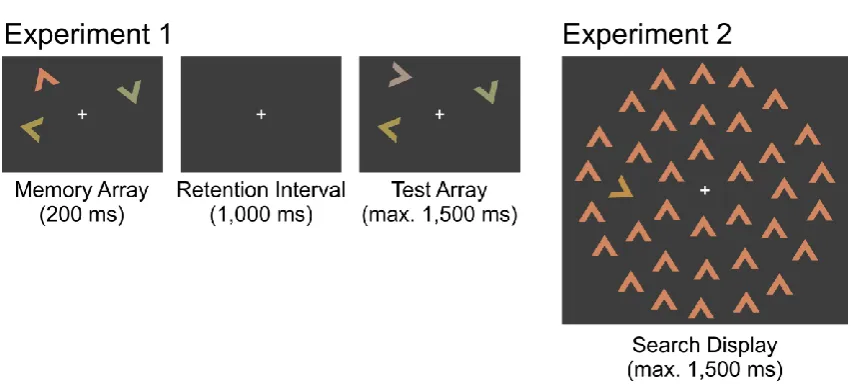
Each trial (Figure 1) consisted of a memory array, presented for 200 ms, containing three
to-be-remembered arrowheads. After a blank retention period of 1,000 ms, the test array
containing three arrowheads was presented until response or maximally 1,500 ms. This was
followed by written feedback for late or incorrect responses (1,500 ms; “Faster!” or “Wrong!”
in German) and, finally, a blank intertrial interval (800–2,000 ms). The fixation cross was
visible throughout the trial, except for the feedback. Participants reported, as fast and
accurately as possible, whether any element differed between memory and test arrays via key
presses (left/right index finger, response-assignment counterbalanced across participants), and
the timing and accuracy of these presses was recorded. After each block, participants received
feedback on their mean accuracy.
The experiment consisted of three phases. To measure the difficulty of detecting
orientation changes, individual arrowheads differed in orientation and only one orientation
could change (by ±120°, 2/3 of trials) in the first phase (2 blocks of 51 trials). All arrowheads
in a display had the same color (varying randomly across trials). In the second phase (2 blocks
of 51 trials), the QUEST scaling algorithm (King-Smith, Grigsby, Vingrys, Benes, &
Supowit, 1994; Watson & Pelli, 1983) was used (β = 3.5, δ = 0.01, γ = 0.5) to match the
difficulty of detecting color changes to that of detecting orientation changes. In this phase, the
three arrowheads differed in color (while having the same random orientation), and only one
color could change (by ±120°; 2/3 of trials). The discriminability of color changes was
adjusted by changing the radius of the color circle (guess = 20, range = 0-40). The aim of the
first two phases was to equate the difficulty of detecting the two types of change. The first
phase measured the difficulty of detecting 120° orientation changes and the second phase
adapted the difficulty of detecting 120° color changes accordingly.1 Thus, all participants
performed the task with orientation changes first and the task with color changes second,
without counterbalancing. This resulted in color-circle radii from 2.96 to 35.68 (mean =
In the third, main phase (12 blocks of 66 trials), each arrowhead was uniquely colored
and oriented (see Figure 1). The memory and probe arrays were identical (no change) on 1/3
of the trials. On half of the remaining trials, one, randomly selected arrowhead changed in
either color or orientation (single change). On the other half, there was both a color and an
orientation change (redundant changes). On half of the redundant-change trials, two
arrowheads changed, one in color and the other in orientation (redundant/different locations,
mean distance: 9.17°). On the remaining half of redundant-change trials, one arrowhead
changed in both color and orientation (redundant/same location). Conditions were balanced
per block of trials and otherwise completely randomized. Thus, each block consisted of 11
trials per change type and 22 no-change trials presented in a random order.
Results
Here, we report analyses of the data from the main phase. For analyses on RTs, only
correct-response trials were considered (78% of trials on average across participants and
experimental conditions). To detect trials with outlier RTs, we employed Tukey’s cut-off rule
(e.g., Hoaglin, Iglewicz, & Tukey, 1986), which uses the lower (FL) and upper (FU) RT
quartiles: correct trials with RTs faster than FL – 1.5(FU - FL) or slower than FU + 1.5(FU - FL)
were considered outliers and removed from analyses (3% of correct-response trials on average
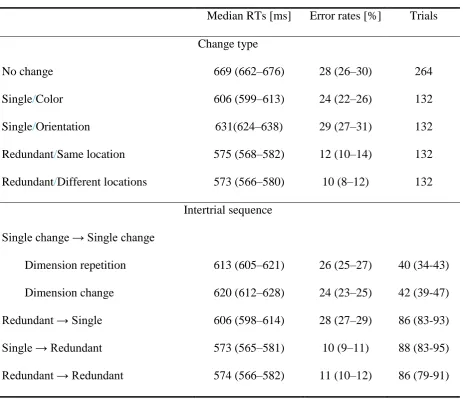
across participants and experimental conditions). As Table 1 shows, participants responded
slowest on no-change trials, followed by single-change trials, and fastest on redundant-change
trials. Error rates were lowest for redundant changes, while the other experimental conditions
differed little in error rates.
These observations were supported by Holm-adjusted pairwise t tests, which revealed
significantly slower RTs for the no-change condition relative to all change conditions (all
t(25)s ≥ 3.30, all ps ≤ .009, all Cohen’s dzs ≥ 0.66). Error rates, by contrast, were similar for
no-change and single-change conditions (both t(25)s ≤ 1.41, both ps > .250, all dzs ≤ 0.28).
(t(25) = 3.07, p = .010, dz = 0.61), they were detected with similar accuracy (t(25) = 1.48, p >
.250, dz = 0.30), indicating successful stimulus scaling. The faster (color) single change was
significantly slower than redundant changes at either the same location (t(25) = 5.13, p < .001,
dz = 1.03) or different locations (t(25) = 4.92, p < .001, dz = 0.98), indicating significant
redundancy gains. Similarly, error rates for single changes were significantly higher than for
redundant changes at either the same or different locations (both t(25)s ≥ 6.24, both ps < .001,
both dz ≥ 1.25). Interestingly, there were no significant differences between redundant
changes at the same and at different locations, in either RT (t(25) = .32, p > .250, dz = 0.06) or
error rate (t(25) = 2.30, p = .120, dz = 0.46). Taken together, analyses of median RTs and error
rates revealed substantial redundancy gains of similar magnitude for changes at the same and
at different locations.
To understand better what these redundancy gains reflect, we tested for violations of the
race-model inequality (RMI). Violations of the RMI are regarded as evidence for co-active
processing, in which case rejecting the simpler race model is warranted. To test for RMI
violations, we estimated RTs at ten percentiles of the cumulative distribution function (CDF)
for each condition as well as the sum of the two single-change CDFs (5th–95th percentile in
steps of 10) according to the method of Ulrich, Miller, and Schröter (2007). The sum of the
two single-change CDFs constitutes the theoretical upper bound that is still compatible with
race models. If, at any percentile, RTs in a redundant-signal condition are faster than the
upper bound (i.e., the RMI is violated), independent race processing can be reliably rejected.
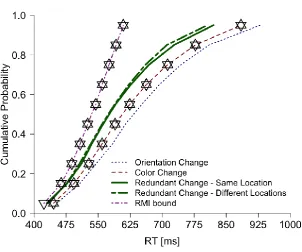
As Figure 2 shows, for both redundant-change conditions, none of the percentile RTs was
faster than the race-model bound, that is, there were no violations of the RMI. In fact,
two-tailed paired t tests (corrected for multiple-comparisons by the method of Hochberg, 1988)
revealed that all but the fastest percentile RTs for redundant changes at both the same and
different locations were significantly slower than the race-model bound. Nevertheless,
changes at both the same and different locations were detected significantly faster than single
color changes for all percentiles.
As mentioned earlier, RMI violations are a conservative criterion for co-activation,
permitting reliable rejection of race models. Simple absence of RMI violations, however, does
not permit rejecting any of the models. As a more sensitive test of co-activation, we compared
RT distributions for redundant changes at the same and different locations. If the changes
indeed are detected at the master-map level (similar to the master map of saliencies), then
redundant changes at the same location would co-activate, predicting faster RTs. A simple
race, by contrast, predicts no differences between redundant changes at the same location and
at different locations. Consistent with race-model predictions, Figure 2 shows a striking
overlap between RT distributions in these two conditions. This observation was confirmed by
analyses of Bayes factors (BF) for a mixed-measures linear model (Morey, Rouder, & Jamil,
2015) of RT distributions for redundant targets with change type (same vs. different locations)
as a categorical predictor, cumulative probability as a continuous predictor, and participant as
a random factor. We examined 2ln(BF) values, which have the attractive property that their
absolute value can be interpreted in the same way irrespectively of whether the data supports
the null (2ln(BF) ≤ -2) or the alternative (2ln(BF) ≥ 2) hypothesis (Kass & Raftery, 1995).
The 2ln(BFs) values supported the null hypothesis that the RT distributions for redundant
changes at the same versus different locations were equivalent in both the fastest RTs
(2ln(BF) = -4.38 for the main effect of change type) and RT variability (2ln(BF) = -4.72 for
the interaction between the change type and cumulative probability).
Analyses of intertrial-sequence effects on RTs (Table 1) revealed none of the sequence
effects typically observed in singleton-feature search. Dimension-repetition and
dimension-change trials did not differ (i.e., there were no dimension-repetition effects) in median RTs
(2ln(BF) = -2.73). Redundancy costs were absent, too: single-change trials following a
Inspection of the error rates revealed no indications of speed-accuracy trade-offs across
conditions. Taken together, intertrial-sequence effects (dimension-repetition effects and
redundancy costs), which are robust in visual-search tasks, were absent in the
change-detection task.
Discussion
We transferred a redundant-signals paradigm typically used to examine the workings of
saliency maps in visual search to the change-detection task to test whether saliency
computations are similar across tasks.
On the one hand, we found clear and robust redundancy gains in both redundant-change
conditions (faster RTs for redundant compared with single changes). Such effects are
typically explained by a parallel processing (i.e., a race) of two saliency signals: the response
is triggered as soon as one signal finishes processing without having to wait for the other
signal (Miller, 1982). Thus, the substantial redundancy gains for the change detection task we
observed in Experiment 1 support the notion that changes are detected in parallel akin to
pop-out search. This nicely complements the evidence for change pop-pop-out provided by Hyun et al.
(2009). Notably, both phenomena (race and pop-out) are typically explained by a parallel
processing on saliency maps.
On the other hand, however, no sign of co-activation or intertrial-sequence effects – that
is, effects that are diagnostic of the hierarchical architecture of saliency computation in visual
search – emerged in our change-detection task. These striking deviations from standard
findings reported in the visual-search literature (e.g., Feintuch & Cohen, 2002;
Krummenacher et al., 2001, 2002a,b) indicate fundamental differences in the way saliency
maps are employed in the two tasks.
Experiment 2
Rather than assuming fundamental differences between processes underlying change
experimental design are responsible for the deviating data pattern. In other words, it is
conceivable that using a comparable stimulus set and experimental design, the co-activation
and intertrial-sequence effects would likewise be absent in a visual-search task. To rule out
this possibility and to provide a more direct comparison between the two tasks, in Experiment
2 we administered a visual-search task similar to the change detection task used in
Experiment 1.
Given that change detection and visual search differ in many respects, a direct translation
of a change-detection design to a visual-search design is, of course, not possible. For instance,
error rates in change-detection are necessarily higher, because information might be lost from
memory before the test array comes up and search can commence, whereas all necessary
information is physically available in a standard visual-search task. Perhaps most importantly,
performance in the two tasks relies on different types of contrast signals. Change detection, on
the one hand, depends on the (change) contrast between a target (the changed object) and an
object at the same position stored in VWM. In pop-out search, on the other hand, target
detection depends on the (feature) contrast between the target (a feature singleton) and
concurrently presented surrounding distractor objects (Duncan & Humphreys, 1989; Liesefeld
et al., 2016; Nothdurft, 2000; Rangelov, Müller, & Zehetleitner, 2017).
These differences have two main implications for the design of Experiment 2. First,
previous research (e.g., Rangelov et al., 2017) as well as unpublished evidence2 suggest that,
in order to achieve reliable pop-out in visual search, more objects must be in the display as
compared to change detection. Additionally, employing only three items is problematic,
because in the redundant/different-locations condition all three objects differ from each other,
so that all objects are singletons (i.e. the two targets are not special).
Second, a given change contrast might not directly translate into a respective feature
contrast. For instance, a change from blue to green might not directly compare to the contrast
unfavorable consequences for the present visual-search experiment: if one contrast (e.g.,
color) is much stronger than the other (e.g., orientation), participants likely focus on the more
efficiently processed dimension (e.g., color) and ignore the other dimension (e.g., orientation)
in a first stage (and switch over only once they have established the absence of a color target).
Consequently, the same signal (color) would always determine response times, that is, no
redundancy gains would emerge. In fact, this is what we found when we directly translated
the contrasts in a first attempt to reproduce the typical visual-search findings in a dense
display. Without redundancy gains, one might question the comparability to typical
visual-search tasks and to the change-detection task in Experiment 1. Accordingly, to assure that
there is a race in which both signals have a chance to win, we determined, in a preliminary
scaling study, a color contrast that is comparable to the orientation contrast.
Thus, for Experiment 2, we decided to use dense displays and color targets that were
detected comparably fast relative to orientation targets (as determined in an independent
scaling experiment, which tested a range of color contrasts).
Methods
Participants. Twenty healthy human adults took part in the experiment for either course
credits or monetary remuneration (8 €/h). Three participants missed the single-color target on
more than 50% of trials and were, thus, excluded from further analysis. The final sample
consisted of 17 participants (mean age: 22 years; 12 female). This is at the upper end of
sample sizes in typical redundant-signals studies (e.g., Krummenacher et al., 2001, 2002a,b).
Stimuli and Design. Stimulus presentation (TFT screen, 1920 × 1080 pixels, 60 Hz,
viewing distance = 60 cm) and response collection (F and J keys on a computer keyboard)
was controlled by a Matlab (The Mathworks) program, using functions from the
Psychophysics Toolbox (Brainard, 1997). Search displays in the main part of the experiment
consisted of 36 colored arrowheads, 1.5° of visual angle in width, arranged with a positional
arrowheads), respectively, around a central fixation cross (0.5°) on a dark grey background, as
illustrated in Figure 1. Two colors (one for targets and one for non-targets) were drawn from a
circle in the same luminance plane of the CIE Lab space as in Experiment 1 (L = 63, center: a
= 9, b = 27) with a radius of 17.69 (the average across participants from Experiment 1).
Non-target arrowheads were orange (a = 25.61, b = 33.05) and pointed upwards. The Non-target color
was a different shade of orange (a = 21.50, b = 39.51; i.e., 5° clockwise from the non-target
color on the color circle), and the target orientation was a 120°-tilt from upright. As
mentioned above, the color contrast was chosen based on data from an independent scaling
experiment, so as to equate the detection speeds for color and orientation targets and, thereby,
to assure that both features are processed.
Each search display was presented until response or maximally 1,500 ms. The fixation
cross was visible throughout the trial and turned blue for late and, respectively, red for
incorrect responses (1,500 ms). Trials were separated by a blank interval (800–2,000 ms).
Participants reported, as fast and as accurately as possible, whether any target object was
present (vs. absent) via key press (left/right index finger, response-assignment
counterbalanced across participants), and the timing and accuracy of these presses was
recorded. After each block, participants received feedback on their mean accuracy. Displays
contained either a single color target, a single orientation target, both a color and an
orientation target (with at minimum one non-target object in between the two targets), or a
target redundantly defined by color and orientation. Within each block, each target condition
occurred on 1/6 of all trials; on 1/3of trials no target was present. All conditions were
randomly intermixed. Participants performed a (non-analyzed) practice block of 24 trials,
followed by 21 blocks of 96 trials each.
After the main part, participants performed an additional task with only single-color and
single-orientation targets and a set-size manipulation. Now displays contained 19 or 37
cross). Participants were told that the outer ring (containing 12 or 18 objects) would never
contain a target, so that it is reasonable to assume that they ignored it (did never suspect a
target on this ring), resulting in effective set sizes of 7 or 19 objects, respectively (see
Liesefeld et al., 2016). The purpose of the outer ring was to assure that all targets (including
those on the second-to-outer ring) were surrounded by homogenous non-targets and would
therefore exhibit high feature contrast (Liesefeld et al., 2016; Nothdurft, 1993, 2000). The
whole array was shifted at random on each trial so that target eccentricity was, on average,
kept constant between the two set sizes (see Liesefeld et al., 2016, Experiments 2 and 3). All
other stimulation details were identical to the main part of Experiment 2. Experimental
conditions were intermixed and balanced within each block according to a full factorial target
presence (present vs. absent) × target type (color vs. orientation) × set size (7 vs. 19) design.
Participants performed three blocks of 96 trials each.
Results
Similar to Experiment 1, for analyses on RTs, only correct-response trials were
considered. Outlier RTs were rejected using Tukey’s outlier-detection criterion as detailed
above (5% of trials on average across participants and experimental conditions). Effects of
experimental conditions on median RTs and error rates were again tested for significance
using Holm-adjusted pairwise t tests. We first analyzed the set-size effect on correct-response
RTs to test whether the color and orientation targets indeed produced pop-out. Set-size effects
were small (set-size effects smaller than 5 ms/item are usually considered evidence for
parallel search/pop out; Liesefeld et al., 2016; Treisman & Souther, 1985; Wolfe, 1998) and
non-significant for both color, 0.0 ms/item, t(16) = 0.01, p = .995, dz < 0.01, and orientation,
1.5 ms/item, t(16) = 1.90, p = .075, dz = 0.46. There was also no effect of set size on error
rates (both t(16)s ≤ 1.78, all ps > .096, all Cohen’s dzs < 0.43).
In the main part of the experiment, participants responded again slowest on target-absent
responses were faster on redundant-target as compared to single-target trials, all t(16)s ≥ 3.86,
all ps ≤ .003, all Cohen’s dzs ≥ 0.94. That is, we again observed clear redundancy gains. In
contrast to Experiment 1, redundant signals at the same location were detected faster than
redundant signals at different locations, t(16) = 7.05, p < .001, dz = 1.68, indicating
co-activation. As a consequence of our scaling of contrast values for equating RTs, orientation
targets and color targets were detected equally fast, t(16) = 0.57, p = .576, dz = 0.14. Error
rates were lowest for redundant targets, all t(16)s ≥ 5.32, all ps ≤ .001, all Cohen’s dzs ≥ 1.33,
and did not differ between the two redundant-target conditions, t(16) = 0.22, p = .830, dz =
0.05. Error rates for target-absent trials were lower than those for color targets, t(16) = 4.65, p
= .001, dz = 1.16, but similar to those for orientation targets, t(16) = 1.02, p = .646, dz = 0.25.
In contrast to RTs, error rates differed between the two single-target conditions, t(16) = 4.12,
p = .002, dz = 1.03.
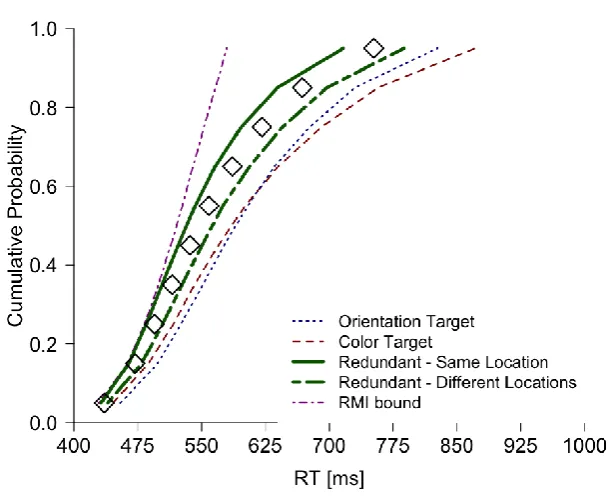
To follow up on the redundancy gains in RTs, we again tested for RMI violations. As
Figure 3 shows, for both redundant-target conditions, none of the percentile RTs was shorter
than any of the respective percentile RTs from the RMI bound, that is, there were no
violations of the RMI. However, several percentile RTs were shorter for the
redundant/same-location as compared to the redundant/different-redundant/same-locations condition, thus indicating
co-activation in the absence of RMI violations.
Analyses of intertrial-sequence effects on RTs (Table 2) revealed all expected sequence
effects. Responses were faster for dimension-repetition than for dimension-change trials, t(16)
= 4.95, p < .001, dz = 1.24, and redundancy costs (slowing for single targets following a
redundant-target relative to dimension-repetition targets) were also manifest, t(16) = 3.48, p =
.009, dz = 0.87. Analyses of intertrial-squence effects on error rates revealed a similar pattern,
showing dimension-repetition effects, t(16) = 3.82, p = .006, dz = 0.95, and redundancy costs,
Discussion
In Experiment 2, we used a visual-search task with stimuli and a design similar to that of
the change-detection task in Experiment 1. In contrast to Experiment 1, we observed most
standard findings from the visual-search literature that have been taken as evidence for a
master map of saliencies. Taken together, the results of Experiment 2 suggest that the lack of
intertrial and co-activation effects in Experiment 1 was not simply due to a specific stimulus
set and experimental design. Of note, though, we did not replicate one much stressed finding
from the visual-search literature: the RT distribution for redundant/same-location targets did
not violate the RMI. However, tests for RMI violations are known to be rather conservative,
that is, these tests might miss co-activation when it is actually present (e.g., Ratko-Dehnert,
2013). As argued above, the difference between RTs for redundant/same-location
redundant/different-locations targets provides a more sensitive test for co-activation in visual
search, and this difference turned out to be robust in the present experiment.
General Discussion
We examined whether searching for a change between two successively presented scenes
(change detection) is governed by the same principles as searching for an element in a
currently viewed scene (visual search). On the one hand, we observed robust redundancy
gains, which complement the findings of Hyun et al. (2009) and further support the notion
that change detection relies on some sort of saliency map (see Discussion of Experiment 1).
Critically, however, dimension-repetition effects, indices of co-activation, and intertrial
redundancy costs (i.e., effects reliably found in visual search) were absent in the
change-detection task. This indicates that key mechanisms at play in visual search (dimension
weighting, co-activation) play no role in change detection. Instead, our findings suggest that
similar, yet distinct mechanisms mediate pop-out in visual-search and change-detection tasks,
As an interesting aside, we observed no difference in error rates between the two
redundant-change conditions; this finding could be taken as tentative evidence that binding
plays no major role during VWM maintenance. If all features of an object are maintained (and
forgotten) together, the probability that any of the two changed objects in the
redundant/different-locations condition is remembered should be higher than the probability
that the single object in the redundant/same-location condition is remembered (e.g., Bays,
Wu, & Husain, 2011; Rangelov & Zeki, 2014). However, change-detection performance does
not only depend on whether the changed object is maintained, but also on the magnitude of
the change and, thus, the discriminability of changes versus non-changes (Awh, Barton, &
Vogel, 2007). Accordingly, the larger change in one object in the redundant/same-location
condition (two features instead of only one) might have offset the advantage of two changing
objects in the redundant/different-locations condition. The present findings thus contribute
another interesting indication to the debate on the status of objects during VWM maintenance,
while being not decisive on their own.
That a change pops out, as demonstrated by Hyun et al. (2009), is actually more
fascinating than meets the eye: How can attention be guided by something that is not present
but merely defined as the difference between two subsequently presented displays (a change)?
Attention could not be guided by any feature of the changed stimulus: its features were not
known in advance and the changed item was special only in that it was not present in the
memory display. In fact, if participants had used their VWM content to guide search, they
would have attended anywhere else but the change location, because the remaining
(non-changed) elements matched their VWM content.
When observers use an attentional template to search for a specific object, they are
essentially performing an any-sameness task in which they compare elements in the search
display with the template. Change detection, by contrast, does not require finding matches but
tasks are known to produce data patterns differing in many respects and are likely to involve
different cognitive mechanisms (for a review, see Farell, 1985). Hyun et al. (2009), for
example, found that any-sameness VWM tasks (tasks in which participants decide whether at
least one object remained the same between memory and test) yield much larger search slopes
(increases in RT with the number of elements) than the typical any-difference tasks (tasks in
which participants decide whether at least one object changed between memory and test).
This finding suggests that the target in any-sameness VWM tasks may not pop out.
Furthermore, Saiki (2016) recently employed an any-sameness VWM task with redundant
targets and found violations of the RMI. Together, ours and Saiki’s findings thus further
highlight the strong differences between cognitive mechanisms involved in any-sameness and
any-difference tasks (for a related discussion on detection vs. discrimination tasks, see
Lupiáñez, 2010, and Lupiáñez, Martín-Arevalo, & Chica, 2013).
Co-activation observed in visual search and the any-sameness VWM task suggests that
these tasks rely on a feature-blind master-saliency map that represents feature-contrast signals
combined across separate dimensions. Change detection, by contrast, might rely on
feature-specific maps. One possible account for the present, change-detection results may be that
feature maps representing the respective feature in the memory and test displays are compared
by subtraction (Figure 4). Accordingly, each of the resulting difference maps would contain
information only about changes in a single feature. The strong mean-RT redundancy gains
observed in the present task indicate that signals from several difference maps compete for
focal attention; and the absence of intertrial effects and of indices of co-activation indicates
that the difference signals are kept separate, rather than being integrated (in a weighted
fashion) at some superordinate level. The proposed account is consistent with dominant
models of early vision (Wolfe, 2007) and can explain the distinction between any-sameness
and any-difference tasks in a straightforward manner. While alternative accounts are
Awh et al. (2012; see also, e.g., Müller et al., 2003) recently proposed that search is
always guided by the same master (or priority) map which integrates stimulus-salience,
current-goal, and selection-history information. The absence of co-activation observed in the
present change-detection data indicates that change maps do not feed into any common
priority map, but are instead evaluated independently. The change maps would thus constitute
attention-guiding representations that complement the priority map in situations in which the
latter does not provide the information required for the task at hand.
References
Awh, E., Barton, B., & Vogel, E. K. (2007). Visual working memory represents a fixed
number of items regardless of complexity. Psychological Science,18, 622–628.
doi:10.1111/j.1467-9280.2007.01949.x
Awh, E., Belopolsky, A. V., & Theeuwes, J. (2012). Top-down versus bottom-up attentional
control: A failed theoretical dichotomy. Trends in Cognitive Sciences, 16, 437–443.
doi:10.1016/j.tics.2012.06.010
Brainard, D. H. (1997). The Psychophysics Toolbox. Spatial Vision, 10, 433–436.
doi:10.1163/156856897X00357
Bays, P. M., Wu, E. Y., & Husain, M. (2011). Storage and binding of object features in visual
working memory. Neuropsychologia, 49, 1622–1631.
doi:10.1016/j.neuropsychologia.2010.12.023
Desimone, R., & Duncan, J. (1995). Neural mechanisms of selective visual attention. Annual
Review of Neuroscience, 18, 193–222. doi:10.1146/annurev.ne.18.030195.001205
Downing, P. E. (2000). Interactions between visual working memory and selective attention.
Psychological Science, 11, 467–473. doi:10.1111/1467-9280.00290
Duncan, J., & Humphreys, G. W. (1989). Visual search and stimulus similarity. Psychological
Farell, B. (1985). 'Same'–'different' judgments: A review of current controversies in
perceptual comparisons. Psychological Bulletin, 98, 419–456.
doi:10.1037/0033-2909.98.3.419
Feintuch, U., & Cohen, A. (2002). Visual attention and coactivation of response decisions for
features from different dimensions. Psychological Science, 13, 361–369.
doi:10.1111/j.0956-7976.2002.00465.x
Found, A., & Müller, H. J. (1996). Searching for unknown feature targets on more than one
dimension: Investigating a 'dimension-weighting' account. Perception & Psychophysics,
58, 88–101. doi:10.3758/BF03205479
Hochberg, Y. (1988). A sharper Bonferroni procedure for multiple tests of significance.
Biometrika, 75, 800–802. doi:10.1093/biomet/75.4.800
Hoaglin, D. C., Iglewicz, B., & Tukey, J. W. (1986). Performance of some resistant rules for
outlier labeling. Journal of the American Statistical Association, 81, 991–999.
doi:10.1080/01621459.1986.10478363
Humphreys, G. W., & Müller, H. J. (1993). SEarch via Recursive Rejection (SERR): A
connectionist model of visual search. Cognitive Psychology, 25, 43–110.
doi:10.1006/cogp.1993.1002
Hyun, J., Woodman, G. F., Vogel, E. K., Hollingworth, A., & Luck, S. J. (2009). The
comparison of visual working memory representations with perceptual inputs. Journal of
Experimental Psychology: Human Perception and Performance, 35, 1140–1160.
doi:10.1037/a0015019
Kass, R. E., & Raftery, A. E. (1995). Bayes Factors. Journal of the American Statistical
Association, 90, 773–795. doi:10.1080/01621459.1995.10476572
King-Smith, P. E., Grigsby, S. S., Vingrys, A. J., Benes, S. C., & Supowit, A. (1994) Efficient
experimental evaluation and practical implementation. Vision Research, 34, 885–912.
doi:10.1016/0042-6989(94)90039-6
Krummenacher, J., & Müller, H. J. (2014). Visual search for singleton targets redundantly
defined in two feature dimensions: co-active processing of color-motion targets?Journal
of Experimental Psychology: Human Perception and Performance, 40, 1926–1939.
doi:10.1037/a0037560
Krummenacher, J., Müller, H. J., & Heller, D. (2001). Visual search for dimensionally
redundant pop-out targets: evidence for parallel-coactive processing of dimensions.
Perception & Psychophysics, 63, 901–17. doi:10.3758/BF03194446
Krummenacher, J., Müller, H. J., & Heller, D. (2002a). Visual search for dimensionally
redundant pop-out targets: Parallel-coactive processing of dimensions is location specific.
Journal of Experimental Psychology: Human Perception and Performance, 28,
1303-1322. doi:10.1037/0096-1523.28.6.1303
Krummenacher, J., Müller, H. J., & Heller, D. (2002b). Visual search for dimensionally
redundant pop-out targets: Redundancy gains in compound tasks. Visual Cognition, 9,
801–837. doi:10.1080/13506280143000269
Kuhl, B. A., & Chun, M. M. (2014). Memory and attention. In A. C. Nobre & S. Kastner
(Eds.), The Oxford Handbook of Attention (pp. 753-776). New York, NY: Oxford
University Press.
Liesefeld, H. R., Moran, R., Usher, M., Müller, H. J., & Zehetleitner, M. (2016). Search
efficiency as a function of target saliency: The transition from inefficient to efficient
search and beyond. Journal of Experimental Psychology: Human Perception and
Performance, 42, 821–836. doi:10.1037/xhp0000156
Loftus, G. R., & Masson, M. J. (1994). Using confidence intervals in within-subject designs.
Luck, S. J. (2012). Electrophysiological correlates of the focusing of attention within complex
visual scenes: N2pc and related ERP components. In S. J. Luck & E. S. Kappenman
(Eds.), The Oxford Handbook of ERP Components (pp. 329-360). New York, NY: Oxford
University Press.
Lupiáñez (2010). Inhibition of return. In A. C. Nobre & J. T. Coull (Eds.), Attention and Time
(pp. 17-34). Oxford Scholarship Online.
doi:10.1093/acprof:oso/9780199563456.003.0002
Lupiáñez, J., Martín-Arévalo, E., & Chica, A. B. (2013). Is Inhibition of Return due to
attentional disengagement or to a detection cost? The Detection Cost Theory of IOR.
Psicológica, 34, 221–252. Retrieved from https://www.uv.es/psicologica/
Miller, J. (1982). Divided attention: Evidence for coactivation with redundant signals.
Cognitive Psychology, 14, 247–279. doi:10.1016/0010-0285(82)90010-X
Mordkoff, J. T., & Yantis, S. (1993). Dividing attention between color and shape: Evidence of
coactivation. Perception & Psychophysics, 53, 357-366. doi:10.3758/BF03206778
Morey, R. D., Rouder, J. N., & Jamil, T. (2015). BayesFactor: Computation of Bayes factors
for common designs (Version 0.9.12-2). Retrieved from
https://cran.r-project.org/web/packages/BayesFactor/index.html
Müller, H. J., Heller, D., & Ziegler, J. (1995). Visual search for singleton feature targets
within and across feature dimensions. Perception & Psychophysics, 57, 1–17.
doi:10.3758/BF03211845
Müller, H. J., Reimann, B., & Krummenacher, J. (2003). Visual search for singleton feature
targets across dimensions: Stimulus- and expectancy-driven effects in dimensional
weighting. Journal of Experimental Psychology: Human Perception and Performance,
Nothdurft, H. (1993). The role of features in preattentive vision: Comparison of orientation,
motion and color cues. Vision Research, 33, 1937–1958.
doi:10.1016/0042-6989(93)90020-W
Nothdurft, H. (2000). Saliency from feature contrast: variations with texture density. Vision
Research, 40, 3181–3200. doi:10.1016/S0042-6989(00)00168-1
Olivers, C. L., Meijer, F., & Theeuwes, J. (2006). Feature-based memory-driven attentional
capture: Visual working memory content affects visual attention. Journal of Experimental
Psychology: Human Perception and Performance, 32, 1243–1265.
doi:10.1037/0096-1523.32.5.1243
Olivers, C. L., Peters, J., Houtkamp, R., & Roelfsema, P. R. (2011). Different states in visual
working memory: When it guides attention and when it does not. Trends in Cognitive
Sciences, 15, 327–334. doi:10.1016/j.tics.2011.05.004
Rangelov, D., Müller, H. J., & Zehetleitner, M. (2011a). Dimension-specific intertrial priming
effects are task-specific: evidence for multiple weighting systems. Journal of
Experimental Psychology. Human Perception and Performance, 37, 100–114.
doi:10.1037/a0020364
Rangelov, D., Müller, H. J., & Zehetleitner, M. (2011b). Independent dimension-weighting
mechanisms for visual selection and stimulus identification. Journal of Experimental
Psychology: Human Perception and Performance, 37, 1369–1382. doi:10.1037/a0024265
Rangelov, D., Müller, H. J., & Zehetleitner, M. (2012). The multiple-weighting-systems
hypothesis: Theory and empirical support. Attention, Perception, & Psychophysics, 74,
540–552. doi:10.3758/s13414-011-0251-2
Rangelov, D., Müller, H. J., & Zehetleitner, M. (2017). Failure to pop out: feature singletons
do not capture attention under low signal-to-noise ratio conditions. Journal of
Rangelov, D., Töllner, T., Müller, H. J., & Zehetleitner, M. (2013). What are task-sets: a
single, integrated representation or a collection of multiple control representations?
Frontiers in Human Neuroscience, 7, 524. doi:10.3389/fnhum.2013.00524
Rangelov, D., & Zeki, S. (2014). Non-binding relationship between visual features. Frontiers
in Human Neuroscience, 8:749. doi:10.3389/fnhum.2014.00749
Ratko-Dehnert, E. (2013). Distributional constraints on cognitive architecture: A statistical
evaluation. (Doctoral dissertation). Retrieved from
https://edoc.ub.uni-muenchen.de/15938
Reinhart, R. M. G., McClenahan, L. J., & Woodman, G. F. (2016). Attention’s accelerator.
Psychological Science, 27, 790–798. doi :10.1177/0956797616636416
Saiki, J. (2016). Location-unbound color-shape binding representations in visual working
memory. Psychological Science, 27, 178–190. doi:10.1177/0956797615616797
Shomstein, S., & Yantis, S. (2002). Object-based attention: Sensory modulation or priority
setting?. Perception & Psychophysics, 64, 41–51. doi:10.3758/BF03194556
Soto, D., Heinke, D., Humphreys, G. W., & Blanco, M. J. (2005). Early, involuntary
top-down guidance of attention from working memory. Journal of Experimental Psychology:
Human Perception and Performance, 31, 248–261. doi:10.1037/0096-1523.31.2.248
Soto, D., Hodsoll, J., Rotshtein, P., & Humphreys, G. W. (2008). Automatic guidance of
attention from working memory. Trends in Cognitive Sciences, 12, 342–348.
doi:10.1016/j.tics.2008.05.007
Töllner, T., Gramann, K., Müller, H. J., Kiss, M., & Eimer, M. (2008). Electrophysiological
markers of visual dimension changes and response changes. Journal of Experimental
Psychology: Human Perception and Performance, 34, 531–542.
Töllner, T., Zehetleitner, M., Krummenacher, J., & Müller, H. J. (2011). Perceptual basis of
redundancy gains in visual pop-out search. Journal of Cognitive Neuroscience, 23, 137–
Treisman, A., & Souther, J. (1985). Search asymmetry: A diagnostic for preattentive
processing of separable features. Journal of Experimental Psychology: General, 114,
285–310. doi:10.1037/0096-3445.114.3.285
Ulrich, R., Miller, J., & Schröter, H. (2007). Testing the race model inequality: An algorithm
and computer program. Behavior Research Methods, 39, 291–302.
doi:10.3758/BF03193160
Watson, A. B., & Pelli, D. G. (1983) QUEST: a Bayesian adaptive psychometric method.
Perception & Psychophysics, 33, 113–20. doi:10.3758/BF03202828
Wolfe, J. M. (1998). Visual search. In H. Pashler (Ed.), Attention (pp. 17–73). East Sussex,
UK: Psychology Press.
Wolfe, J. M. (2007). Guided search 4.0: Current progress with a model of visual search. In W.
Gray (Ed.), Integrated models of cognitive systems (pp. 99–119). New York, NY: Oxford
Footnotes
1
Adapting detection difficulty, of course, requires that orientation changes are sufficiently
difficult to detect, so that detection performance is not at ceiling (i.e., that the QUEST
threshold is clearly below 100% correct). We ascertained below-ceiling performance for
orientation changes in pilot tests.
2
In two pilot studies, we used only three or six items in a visual search task and observed
no pop-out (i.e., there was a clear effect of set size) for even a very strong orientation contrast
Table 1
Results for Each Experimental Condition (Change Type) and Split According to Intertrial
Sequence (Trial n-1 → Trial n). Numbers in Parentheses Indicate 95%-Within-Subjects
Confidence Intervals for the Main Effect of Change Type or Intertrial Sequence, Respectively,
According to Loftus and Masson (1994), or the Interquartile Range (For the Number of
Trials).
Median RTs [ms] Error rates [%] Trials
Change type
No change 669 (662–676) 28 (26–30) 264
Single/Color 606 (599–613) 24 (22–26) 132
Single/Orientation 631(624–638) 29 (27–31) 132
Redundant/Same location 575 (568–582) 12 (10–14) 132
Redundant/Different locations 573 (566–580) 10 (8–12) 132
Intertrial sequence
Single change → Single change
Dimension repetition 613 (605–621) 26 (25–27) 40 (34-43)
Dimension change 620 (612–628) 24 (23–25) 42 (39-47)
Redundant → Single 606 (598–614) 28 (27–29) 86 (83-93)
Single → Redundant 573 (565–581) 10 (9–11) 88 (83-95)
Table 2
Results for Each Target Type and Split According to Intertrial Sequence (Trial n-1 → Trial
n). Conventions as in Table 1.
Median RTs [ms] Error rates [%] Trials
Change type
No change 688 (679–697) 4.11 (3.50–4.72) 672
Single/Color 585 (576–594) 7.48 (6.87–8.09) 336
Single/Orientation 590 (581–599) 3.53 (2.92–4.14) 336
Redundant/Same location 532 (523–541) 1.10 (.49–1.71) 336
Redundant/Different locations 561 (552–570) 1.06 (.45–1.67) 336
Intertrial sequence
Single change → Single change
Dimension repetition 564 (558–570) 3.87 (3.24–4.50) 96 (89-102)
Dimension change 593 (587–599) 7.02 (6.39–7.65) 100 (97-106)
Redundant → Single 578 (572–584) 5.46 (4.83–6.09) 202 (192-2012)
Single → Redundant 537 (531–543) 1.20 (.57–1.83) 216 (200-226)
Figure 1. Illustration of the display sequence in Experiment 1 and the search display in
Experiment 2. In Experiment 1, participants reported whether any of the elements in the test
array differed from the memorized elements. The example depicts a redundant change at the
same location: both the color and the orientation of the upper left element changed in the test
relative to the memory array. In Experiment 2, participants reported whether a singleton target
was present. Here too, the example depicts a redundant target at the same location: both color
Figure 2.RT distributions for different change types in Experiment 1 (change detection
task). Upward-pointing triangles denote significant differences (Hochberg-corrected,
two-tailed p < .05) from redundant changes at the same location, whereas downward-pointing
triangles denote significant differences from redundant changes at different locations.
Figure 3.RT distributions for different target types in Experiment 2 (visual search task).
Diamonds denote significant differences (Hochberg-corrected, two-tailed p < .05) between
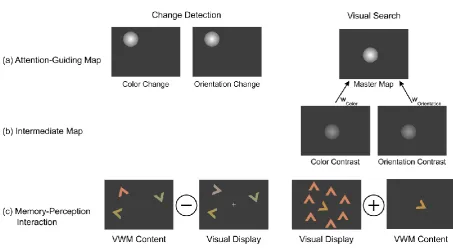
Figure 4. Mechanisms that potentially mediate pop-out in change-detection and
visual-search tasks, respectively. Signals from (a) attention-guiding maps direct attention to the
location of the highest saliency. The absence of intertrial effects and RMI violations in change
detection suggest that there is no (weighted) integration of change-contrast signals at some
superordinate, ‘master-map’ level. For visual search, the intertrial effects and RMI violations
support the notion that signals from different perceptual dimensions are (b) first processed
separately and then integrated as a weighted sum at the level of the supra-dimensional
saliency map. Change contrasts depend on (c) feature differences between memorized and
currently present items at the same location, whereas feature contrasts depend on local
differences between (nearby) items within a given display. The depicted visual-search display
is a cutout from the original display of Figure 1. Feature-contrast signals are potentially