© 2015, IRJET ISO 9001:2008 Certified Journal Page
1339
Km Monu1,Preeti Banger2, A.K Duggal31. M.E Scholar, Civil Engineering Department, National Institute of Technical Teachers Training and Research/ Punjab University, Chandigarh
2. M.E Scholar, Civil Engineering Department, National Institute of Technical Teachers Training and Research/ Punjab University, Chandigarh
3. Associate Professor, Civil Engineering Department, National Institute of Technical Teachers Training and Research/ Punjab University, Chandigarh
---
Abstract- InWarm Mix Asphalt (WMA) technology is technology bituminous mixes are prepared at temperature 20-30˚C lower than as in Hot Mix Asphalt (HMA). In this study Marshall samples of both WMA and HMA atfour different binder content are prepared and in WMA 1% of Zeolite is used. It is seen from the several research papers and studies that gyratory compactor is not used for WMA because it is insensitive to the compaction temperature. Marshall Hammer and vibratory compactor give more consistent results than gyratory compactor. We have taken four different percentages of bitumen with 3 samples at each bitumen percent. Total 48 samples were prepared. Test results showed that there is a considerable increase in Marshall Stability Value and optimum bitumen content remains unchanged for WMA. It is also seen that percent VMA, Flow value increase whereas density, VFB, Vb, Vadecreases.
Keywords- Zeolite, Marshall Hammer, vibratory compactor, VMA, VFB, Vb, Va, Flow value.
1.INTRODUCTION
:WMA is developed by adding chemicals such as Zeolites, asphalt emulsions waxes and water to the binder before mixing. According to a survey of US asphalt producers in 2012 about 25% of asphalt produced is Warm mix. It is seen that after adding certain chemicals or external agents mixing and compaction temperatures are reduce by 20-30◦C whereas workability increases. Benefits of using Warm Mix Asphalt technology are listed below:
(i) reduced environmental hazards (ii) lower emissions (iii) lower production of Green House gases (iv) lower fuel consumption (v) lower health hazard (vi)further, the additional cost of the chemical may be compensated by savings in fuel consumption and other indirect benefits (vii) extended construction time (viii) lower time consumption (upto 20-25% less time required) (ix) proximity to the site (x) similar or better performance (xi) reduced binder ageing.
2. EXPERIMENTAL
2.1
Material used
Aggregates available in a Hot Mix Plant near Chandigarh were selected. The proportion of aggregates of size 19mm, 10mm, 6.7mm, stone dust and cement are 10%, 26%, 45%, 16% and 3% respectively. The types of binder used in the study are VG 30 as conventional binder and CRMB 55 as modified binder.
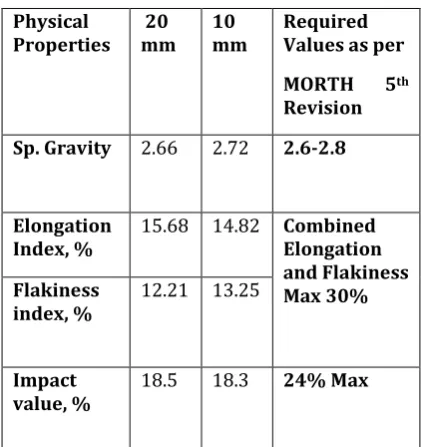
[image:1.595.309.520.451.675.2]Specific gravities of 20mm, 13.5mm, 6.7mm, stone dust and cement are 2.66, 2.72, 2.62, 2.65 and 3.115 respectively.
Table 1.1 Properties of Aggregates
Physical Properties 20 mm 10 mm Required Values as per
MORTH 5th Revision
Sp. Gravity 2.66 2.72 2.6-2.8
Elongation Index, %
15.68 14.82 Combined Elongation and Flakiness Max 30% Flakiness
index, %
12.21 13.25
Impact value, %
18.5 18.3 24% Max
© 2015, IRJET ISO 9001:2008 Certified Journal Page
1340
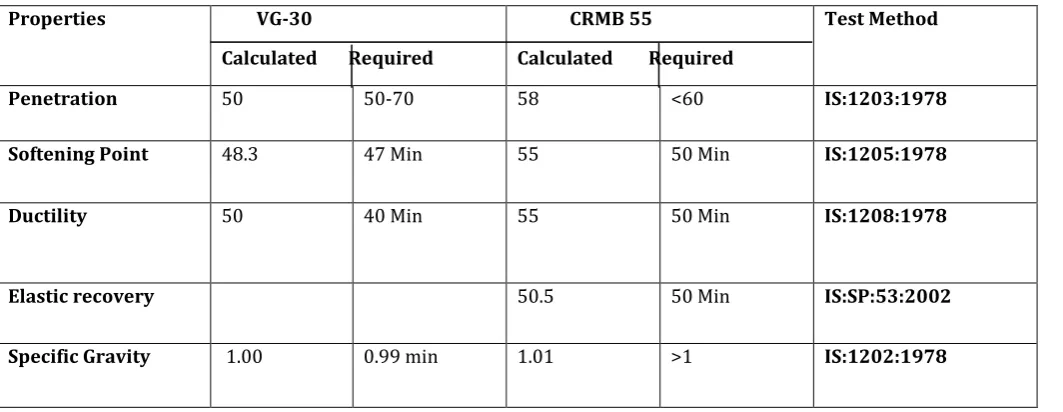
TABLE 1-2 Physical Properties of Bitumen
Properties VG-30
Calculated Required
CRMB 55
Calculated Required
Test Method
Penetration 50 50-70 58 <60 IS:1203:1978
Softening Point 48.3 47 Min 55 50 Min IS:1205:1978
Ductility 50 40 Min 55 50 Min IS:1208:1978
Elastic recovery 50.5 50 Min IS:SP:53:2002
Specific Gravity 1.00 0.99 min 1.01 >1 IS:1202:1978
3
. Mix Design
Design mix is done using job mix formula according to MORTH 5th revision (Ministry of Road Transport and Highway)
[image:2.595.29.526.498.733.2]Table 500-17. The different sizes of aggregates, i.e 20mm, 10mm, 6.7mm and stone dust are selected and the sieve analysis is done to obtain the individual gradation of these aggregates. Grading 2 is used. Then by trial and error method by using Microsoft excel, the desired gradation for DBM as shown in table 4-3. Plain bitumen of grade VG-30 and modifier CRMB 55 used for the study and the physical property of the aggregate should meet the requirement as given in MORTH 5th revision
TABLE 4-3
IS Sieve Size
% passing Required
% Passing 20mm
% Passing 10 mm
% Passing 6.7 mm
% Passing S.D / Girt
% Passing Cement
Grading of Mix
19mm 100 100 100 100 100 100 100
13.2mm 79-100 10.1 100 100 100 100 91.01
9.5mm 70-88 1 86.4 99.4 100 100 86.468
4.75mm 53-71 0 0.6 41.7 99.3 100 54.513
2.36mm 42-58 0 0 5.8 90.2 100 44.518
1.18mm 34-48 0 0 3 68.12 100 34.134
600µ 26-38 0 0 3 51.2 100 26.52
300µ 18-28 0 0 3 36.8 100 20.04
150µ 12-20 0 0 1.7 19.5 100 12.05
75µ 4-10 0 0 1.7 10.4 100 7.952
© 2015, IRJET ISO 9001:2008 Certified Journal Page
1341
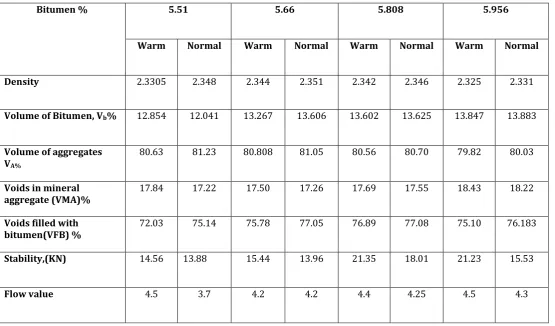
4.1)Experimental Results of different parameters of Marshall Stability Test for CRMB 55
TABLE 4-4
4.5.3 Comparison of Normal and Warm Mixes of CRMB
Bitumen % 5.51 5.66 5.808 5.956
Warm Normal Warm Normal Warm Normal Warm Normal
Density 2.3305 2.348 2.344 2.351 2.342 2.346 2.325 2.331
Volume of Bitumen, Vb% 12.854 12.041 13.267 13.606 13.602 13.625 13.847 13.883
Volume of aggregates VA%
80.63 81.23 80.808 81.05 80.56 80.70 79.82 80.03
Voids in mineral aggregate (VMA)%
17.84 17.22 17.50 17.26 17.69 17.55 18.43 18.22
Voids filled with bitumen(VFB) %
72.03 75.14 75.78 77.05 76.89 77.08 75.10 76.183
Stability,(KN) 14.56 13.88 15.44 13.96 21.35 18.01 21.23 15.53
© 2015, IRJET ISO 9001:2008 Certified Journal Page
1342
Fig.4-1 Variation of Density of HMA and WMA withrespect to Bitumen Content
[image:4.595.37.273.415.621.2]NOTE: Densities of warm mixes was observed to be decreased as compared to hot mixes i.e from 2.348 to 2.3305, 2.351 to 2.344, 2.346 to 2.342 and 2.332 to 2.325 at binder content 5.5115, 5.66, 5.808 and 5.956 respectively.
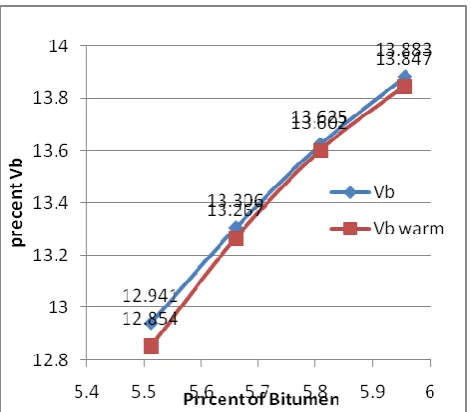
Fig. 4-2 Variation of Vb of HMA and WMA with respect
to Bitumen Content
NOTE- Vbwas observed to be decreased in warm mixes
as compared to hot mixesi.e from 12.941 to 12.854, 13.306 to 13.267, 13.625 to 13.602 and 13.883 to 13.847 at binder content5.5118, 5.66, 5.808 and 5.956 respectively.
Fig. 4-3 Variation of Vaof HMA and WMA with respect to Bitumen Content
NOTE- VA was observed to be decreased in warm mixes
as compared to hot mixesi.e from 82.8 to 81.23 to 80.63, 81.05 to 80.808, 80.7065 to 80.568 and 80.035 to 79.829 at binder content 5.5118, 5.66, 5.808 and 5.956 respectively.
© 2015, IRJET ISO 9001:2008 Certified Journal Page
1343
warm mixes as compared to hot mixes i.e from 17.221 to 17.844, 17.268 to 17.507, 17.556 to 17.692 and 18.223 to 18.437 at Binder content 5.5118, 5.66, 5.808 and 5.956 respectively.
Fig. 4-5 Variation of VFB of HMA and WMA with respect to Bitumen Content
[image:5.595.314.560.192.368.2]warm mixes as compared to hot mixes i.e from 75.14 to 72.035, 77.05 to 75.78, 77.608 to 76.89 and 76.183 to 75.104 at Binder Content 5.5118, 5.66, 5.808 and 5.956 respectively.
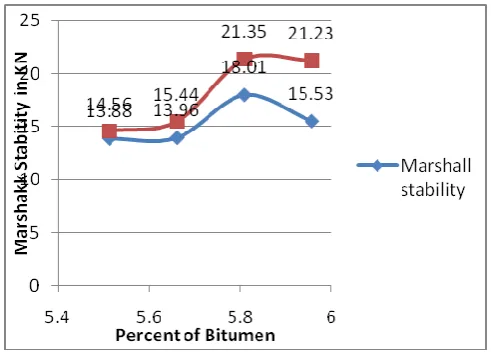
Fig. 4-6 Variation of Marshall Stability value of HMA and WMA with respect to Bitumen Content
NOTE- Marshall Stability was observed to have increased in warm mixes as compared to hot mixes i.e from 13.88 to 14.56, 13.96 to 15.44, 18.01 to 21.35, 15.53 to 21.23 at Binder Content 5.5118, 5.66, 5.808 and 5.956 respectively.
Fig. 4-7 Variation of Flow of HMA and WMA with respect to Bitumen Content
© 2015, IRJET ISO 9001:2008 Certified Journal Page
1344
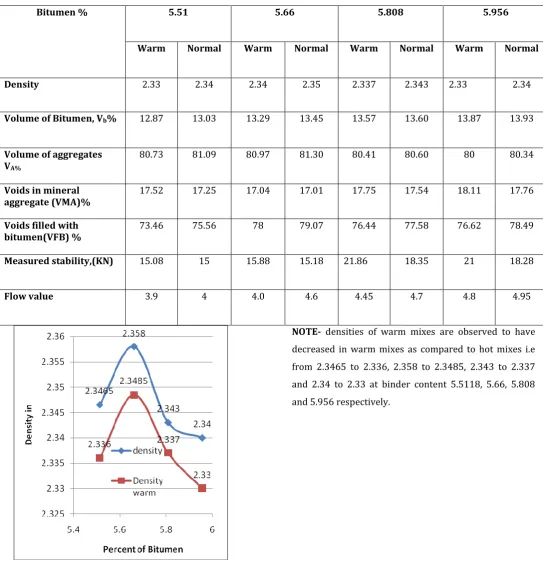
4.1) Experimental Results of different parameters of Marshall Stability Test for VG-30TABLE 4-4
3 Comparison of Normal and Warm Mixes of VG-30
Fig. 4-8 Variation of Density of HMA and WMA with
respect to Bitumen Content
NOTE- densities of warm mixes are observed to have
decreased in warm mixes as compared to hot mixes i.e
from 2.3465 to 2.336, 2.358 to 2.3485, 2.343 to 2.337
and 2.34 to 2.33 at binder content 5.5118, 5.66, 5.808
and 5.956 respectively.
Bitumen % 5.51 5.66 5.808 5.956
Warm Normal Warm Normal Warm Normal Warm Normal
Density 2.33 2.34 2.34 2.35 2.337 2.343 2.33 2.34
Volume of Bitumen, Vb% 12.87 13.03 13.29 13.45 13.57 13.60 13.87 13.93
Volume of aggregates VA%
80.73 81.09 80.97 81.30 80.41 80.60 80 80.34
Voids in mineral aggregate (VMA)%
17.52 17.25 17.04 17.01 17.75 17.54 18.11 17.76
Voids filled with bitumen(VFB) %
73.46 75.56 78 79.07 76.44 77.58 76.62 78.49
Measured stability,(KN) 15.08 15 15.88 15.18 21.86 18.35 21 18.28
© 2015, IRJET ISO 9001:2008 Certified Journal Page
1345
Fig. 4-9 Variation of Vb of HMA and WMA with respectto Bitumen Content
NOTE- Vbof Warm Mix is observed to be decreased when
compared to Hot Mix i.e 13.032 to 12.875, 13.459 to
13.292, 13.608 to 13.573 and 13.937 to 13.877 at binder
content 5.5118, 5.66, 5.808 and 5.956 respectively
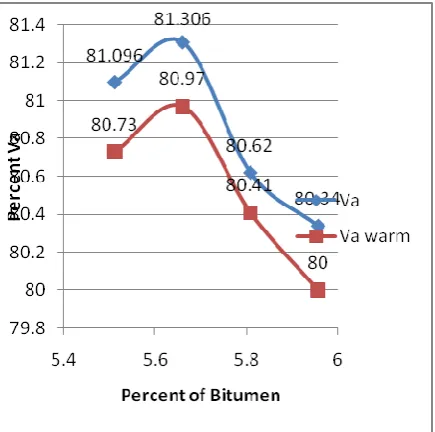
Fig. 4-10 Variation of Vaof HMA and WMA with respect to Bitumen Content
compared to Hot Mix i.e 81.096 to 80.73, 81.306 to 80.97, 80.62 to 80.41 and 80.34 to 80 at binder content 5.5118, 5.66, 5.808 and 5.956 respectively.
Fig. 4-11 Variation of VMA of HMA and WMA with
respect to Bitumen Content
NOTE- VMA of Warm Mixes is observed to have
increased when compared to Hot Mixes i.e 17.25 to
17.525, 17.01 to 17.042, 17.54 to 17.755 and 17.76 to
18.11 at binder Content 5.5118, 5.66, 5.808 and 5.956
[image:7.595.314.554.178.383.2] [image:7.595.38.256.447.663.2]© 2015, IRJET ISO 9001:2008 Certified Journal Page
1346
Fig. 4-12 Variation of VFB of HMA and WMA withrespect to Bitumen Content
NOTE- VFB of Warm Mixes is observed to have
decreased when compared to Hot Mixes i.e 75.53 to
73.466, 84.11 to 78.004, 77.58 to 76.44 and 78.49 to
76.626 at Binder Content 5.5118, 5.66, 5.808 and 5.956
respectively.
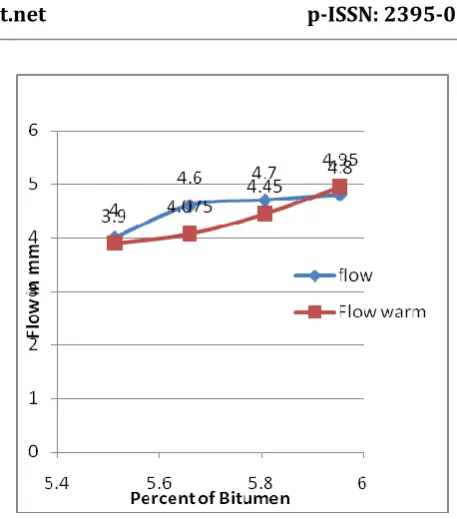
Fig. 4-14 Variation of Flow of HMA and WMA with respect to Bitumen Content
NOTE- flow of warm mix is observed to be decreased as compared to hot mixes i.e 4 to 3.9, 4.6 to 4.075, 4.7 to 4.45 and 4.95 to 4.8 at binder content 5.5118, 5.66, 5.808 and 5.956 respectively.
5 CONCLUSIONS:
Density of Warm Mix Asphalt samples is lower as compared to Hot Mix Asphalt.
Optimum binder content for Normal Mixes is found out to be 5.75 by comparing certain specifications from MORTH 5th revision it is
found out that Optimum Binder Content for Warm Mixes is same as that of Normal samples. It clearly indicates that there is no change in Optimum Binder Content for Warm Mixes
There is a considerable increase in Marshall Stability value of Warm Mix as compared to Hot Mix Asphalt. It concludes that Warm Mix sample have higher strength than Hot Mix samples.
Percent VFB was found to be decrease in warm mixes as compared to hot mixes
Percent VMA (Voids in Mineral
Aggregates) were found to be increased in warm mixes than hot mixes.
VA and VB were found to be decreased in
[image:8.595.308.537.65.325.2]warm mixes when compared to hot mixes.
[image:8.595.35.272.71.276.2] [image:8.595.38.250.485.678.2]