http://dx.doi.org/10.4236/eng.2016.86035
cSi Photovoltaic Modules, Main Degradation
Factors Case Study: La Puna (Argentina)
María Teresa Montero Larocca
1, Carlos Alberto Cadena
1, María Julia Luisa Tamasi
2 1INENCO,Instituto de Investigaciónen Energía No Convencional, Salta, Argentina2CNEA,Comisión Nacional de Energía Atómica, Salta, Argentina
Received 3 May 2016; accepted 26 June 2016; published 29 June 2016
Copyright © 2016 by authors and Scientific Research Publishing Inc.
This work is licensed under the Creative Commons Attribution International License (CC BY). http://creativecommons.org/licenses/by/4.0/
Abstract
This paper presents an analysis of the power loss of a set of photovoltaic modules exposed for more than fifteen years to solar radiation and other environmental factors. The study covered modules installed in 1989 and concluded with modules installed in 2004 (to 2009). Many of them were located in places high above the sea level and with high values of ultraviolet radiation. It is known that this power loss is caused by various factors: loss of optical properties of the protective glass, loss of transmittance of the encapsulation material (EVA), increase in series resistance, de-crease in shunt resistance as well as other factors not analyzed in this study. The contribution of each of these factors to the power loss is measured and discussed in this analysis.
Keywords
Degradation, Shunt-Series Resistance, Loss Transmittance
1. Introduction
When photovoltaic modules are installed, it is thought that their lifetime will exceed 20 years giving acceptable per-formance. However, environmental factors like extreme temperatures and radiation affect the performance of them.
The power loss of photovoltaic modules depends on a series of factors, especially the degradation in the ma-terials they are manufactured with. This mainly involves a loss of optical properties of the mama-terials of the transparent cover as a result of a diminution in the transmittance of the encapsulation layer. If the power loss is analyzed considering the degradation of electrical components of the equivalent circuit, the effect of the increase in series resistance (Rs) and the decrease in shunt resistance (Rsh) should be considered.
radia-tion on the flat side (front) of the modules was little under 4000 MJ∙m−2 and ultraviolet (UV) radiation was just over 180 MJ∙m−2. It should be highlighted that there had been peaks of more than 1200 Wm−2, and that mini-mum temperatures in winter could be as low as −25˚C and maxima in summer could exceed 30˚C with thermal oscillations between day and night as much as 40˚C.
The trials were carried out on two sets of samples: a sample of 13 modules grouped into two subsets. The first five modules corresponding to 12 - 27 Solarwatt model consisting of 36 cells mono crystalline Si 100 mm side, connected in series with a peak power of 43 W (on Standard operating conditions: 1000 W/m2 and cell tempera-ture of 25˚C). Four were exposed for more than 11 years to radiation and other effects of climate. The remaining never exposed since it was retained without use. These modules are bought together having all the same tech-nical characteristics (given by the manufacturer). The second composed of eight modules M55 model Arco S o-lar (36 mono crystalline Si cells, with a peak power of 53 W, under working conditions Standard). Six ofthem were mounted on a structure forming a PV generator and the remaining two were used to charge a battery bank. This subset was exposed another year more. The second set corresponded to tests more recently installed mod-ules and curves on four modmod-ules were taken to four years of use. In short, it has unused data modmod-ules, with up to five years and up to twelve, as shown in Table 1. No test results of the modules exposed to five years are shown, since values hardly differ from the new modules and are in the range of experimental error.
2. General Information
2.1. Transparent Cover
The encapsulation material of the modules, ethylene vinyl acetate (EVA), was assayed. EVA is a polymer that is especially chosen for its high transmittance, resistance to UV radiation, plasticity and excellent dialectical prop-erties. Although stable toward UV radiation, its transmittance was clearly affected by the extreme climatic fac-tors, which could be observed by the naked eye, as the panels had changed their color and become brownish.
2.2. Equivalent Circuit Module
Analysis of the degradation with regard to electricity was carried out using a single diode equivalent circuit model. This is a precise, reliable and easy-to-apply method to predict energy production of a photovoltaic mod-ule, because it allows the calculation of the operation parameters of the cell under any condition providing they are compared with those provided by the manufacturer, which are obtained under standard conditions [1].
2.3. Series Resistance
Series resistance is represented by the sum of diverse effects: electrical current in the base, the transmission de-vice, metal contacts of the cells, resistors of the interconnectors and in the interconnection junction boxes of the terminations. Even though the designers and manufacturers try to minimize series resistance losses, series resis-tance gradually increases as resistors are daily exposed to thermal oscillations. This results in a reduction in the outgoing voltage and in the fill factor (FF), and eventually reduces the performance of the device. Specialists have developed several methods to measure the series resistance, which can be graphical or empirical.
[image:2.595.158.472.605.723.2]Graphical methods use experimental current voltage (I-V) curves under different light conditions and in the dark. Empirical methods make suppositions in order to simplify the calculations, because there are parameters that are beyond the measuring threshold [2]-[7]. These suppositions can be divided into two groups according to
Table 1. Summary of tested modules.
age brand amount initial power
new 7 43, 50,53 W
<5 years Solartec 5 50
11 years Solarwatt 4 43
what analyses of several of them have shown: general suppositions, that are common to all, and specific ones, that are approaches carried out for each of them. The general suppositions, i.e. common ideal assumptions, are: all cells of a photovoltaic module are identical, and the drop in voltage in the cables that interconnect the mod-ules is insignificant; these general assumptions may be applicable to new modmod-ules, that have not yet been ex-posed to atmospheric agents and radiation, but in the case of modules that have been exex-posed to a certain extent these suppositions cannot be affirmed, as degradation does not occur uniformly. Therefore, application of em-pirical methods to clearly deteriorated modules is probably inadequate. Graphical methods are based on curves of modules under study and hence reflect their real performance, but they have as inconvenience that because they are graphical their grade of uncertainty is higher.
2.4. Shunt Resistance
The loss caused by high conductivity through the junctions or sides of the solar cell is represented by shunt re-sistance. This loss may be the result of damaged crystals or impurities within and close to the junction. These paths lead to derivation currents beyond the anticipated charge and the effect is detrimental to the performance of the photovoltaic device, especially at low radiation levels. At sufficiently low levels, shunt resistance reduces the voltage of the open circuit (Voc) and the form factor, barely affecting the short circuit current (Isc). Disre-garding Rsh in the actual crystalline silicon (cSi) cells is equivalent to disreDisre-garding an internal current compo-nent that does not exceed 1% of the Isc value under standard operation conditions [2]. The decrease in shunt re-sistance reduces the power and the fill factor of the module; a low rere-sistance for the device has a strong impact on its performance at reduced radiation levels [8].
3. Analysis: Encapsulation Material
A sample of the encapsulation material was taken in order to analyze the change that had occurred in the materi-al, and the following tests were carried out:
• Fourier Transform Infrared Spectroscopy (FTIR) • EVA transmittance
• X-ray diffraction
• Global transmittance of exposed EVA.
3.1. Fourier Transform Infrared (FTIR) Spectroscopy
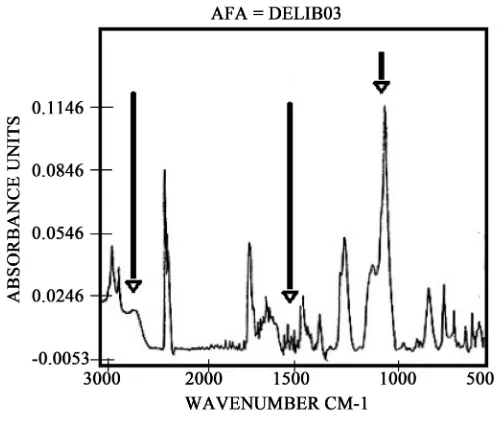
FTIR techniques are habitually used to follow the degradation effects after exposition to UV radiation in diverse materials. However, contrary to the methodology normally used (i.e. to obtain absorption or transmission spectra of the samples), in the current study we opted for the Multiple Internal Reflection (MIR) technique based on two important reasons: 1) the considerable thickness of the transparent layer leads to highly concentrated spectra which implicates a loss of definition in the peaks. It is not advisable to use any technique to diminish the width like cutting or cold or hot extension, as the effects produced by these techniques could superimpose those pro-duced by the radiation. Figure 1 shows a sample that has not been exposed. It should be mentioned that the damage caused by UV radiation is mainly superficial and by using the reflection technique on the surface, any alteration the material may have suffered will be more evident on the surface because it is found at a higher concentration. The same groups of peaks also appear in the exposed sample (Figure 2), but some changes come visible showing degradation products. The band corresponding to absorption of carbonyl groups has be-come wider, indicating other typical degradation products like those belonging to acidic groups that appear as small bands at lower frequencies (approximately 1718 cm−1). Appearance of acidic groups is confirmed by a wider band, characteristic of –OH groups, found near 3300 cm−1. Intense peaks observed in the 1200 - 1020 cm−1region that corresponds to stretching of the ester group (CO-OCH3) were modified by losing resolution, which coincides with observations in the carbonyl region and which proves a degradation process. Furthermore, the band at 1460 cm−1 changed size, indicating a variation in concentration of the terminal methyl groups which is probably caused by the rupture of the chains.
3.2. X-Ray Diffraction
Figure 1.MIR spectrum of unexposed sample.
Figure 2. MIR spectrum of exposed sample.
talline materials (polymers with an amorphous-crystalline proportion of more than 5% of the volume). It can be observed that the original material coincides with the side of the module that is unexposed to UV radiation, be-cause it is completely amorphous and does not present diffraction patterns (Figure 3). The diffract gram of the UV-exposed sample is also completely amorphous and hence it can be concluded that any effect caused by UV is not related to morphological changes or to any crystalline development in the material [9].
3.3. EVA Transmittance
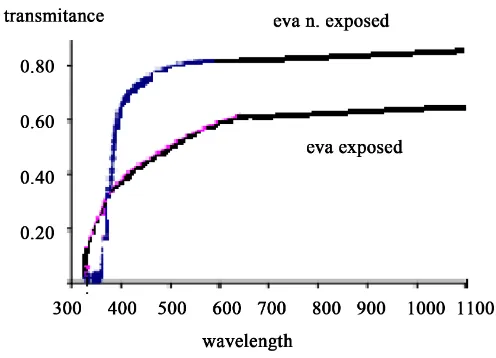
Total radiation of the solar spectrum as well as the response spectrum of deteriorated and non-deteriorated EVA samples, were measured with a LI-COR 1800 spectrometer. Transmittance curves of the EVA samples were constructed from the values obtained by spectrometry. The samples show that the spectral transmittance is low at short wavelengths increasing nearly linearly until 700 nm after which it is almost constant. Figure 4 shows these aspects.
[image:4.595.188.437.307.518.2]Figure 3.Diffract gram of unexposed (lower) and exposed (upper)
[image:5.595.188.441.84.225.2]samples.
Figure 4.Transmittances of the EVA samples.
3.4. Global Transmittance of Exposed EVA
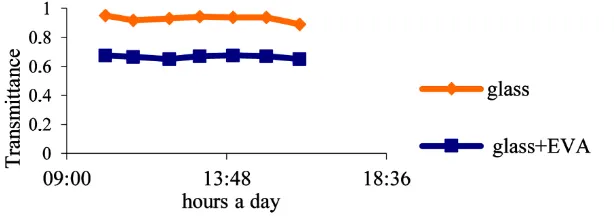
Radiation was measured on the flat side (front) of the module, measuring radiation that went through the glass of the module and radiation that passed through the glass-EVA bilayer. Measurements were carried out in the fragment of the module from where the silica wafer was extracted. The assays showed 95% transmittance for the glass and 67% for the glass-EVA combination [10]. Figure 5 shoes the variation in transmittance as a function of the time.
4. Determination of the Resistors of the Equivalent Circuit
4.1. Characteristic Curve under Light Conditions
[image:5.595.189.437.260.439.2]charge a set of batteries [11].
The first measurement that was performed was to determine their I-V characteristics. A summary of some of the characteristic parameters measured are given in Table 1 and Table 2.
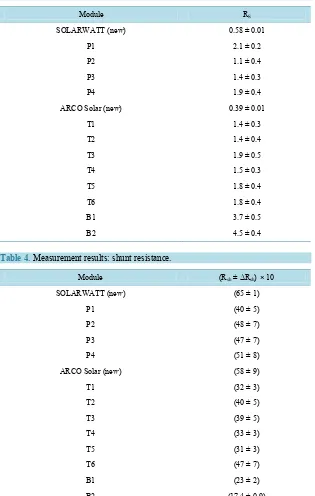
Table 3 and Table 4 present the values measured for series and shunt resistance.
4.2. Power Loss: Increase in Series Resistance
[image:6.595.164.471.287.396.2]With the series resistance of the new module as reference the power loss was determined by measuring the in-crease in resistance in each of the exposed devices. In terms of elements of a simple constant current circuit this is as if an extra series resistor had been incorporated and the equivalent of the two resistors were measured in each of the exposed modules. Figure 6shows the power loss expressed in W in the extra resistor that was in-stalled in the circuits of each of the modules. The additional resistance in the SOLARWATT modules (P) dissi-pated between 4.4 and 8.5 W, while that in the ARCO Solar devices (T) varied between 3.8 and 8.3 W and the extra resistance of the two ARCO Solar modules used in a set of batteries (B) dissipated between 18.5 and 22 W.
Table 5 shows that the largest decrease in shunt resistance in the group of SOLARWATT modules (P) was
Figure 5. Transmittance variation (plane perpendicular to radiation).
Table 1. Summary of the measured characteristic parameters (43 W).
Module Voc (V) Isc (A) Vm (V) Im (A) P (W) FF
P1 21.0 ± 0.2 2.4 ± 0.1 13.3 ± 0.1 2.3 ± 0.1 31 ± 2 0.61 ± 0.06
P2 21.0 ± 0.2 2.3 ± 0.1 13.0 ± 0.1 2.3 ± 0.1 29 ± 2 0.60 ± 0.06
P3 20.6 ± 0.2 2.3 ± 0.1 15.3 ± 0.1 2.0 ± 0.1 30 ± 2 0.63 ± 0.06
P4 21.0 ± 0.2 2.3 ± 0.1 16.1 ± 0.1 2.0 ± 0.1 31 ± 2 0.63 ± 0.06
[image:6.595.88.547.439.718.2]New 21.0 ± 0.2 2.9 ± 0.1 16.3 ± 0.1 2.7 ± 0.1 43 ± 2 0.72 ± 0.06
Table 2. Summary of the characteristic parameters measured (53 W).
Module Voc (V) Isc (A) Vm (V) Im (A) P (W) FF
T1 20.6 ± 0.2 2.4 ± 0.1 14.9 ± 0.1 2.3 ± 0.1 31 ± 2 0.63 ± 0.06
T2 21.3 ± 0.2 2.4 ± 0.1 15.3 ± 0.1 2.1 ± 0.1 32 ± 2 0.62 ± 0.06
T3 20.6 ± 0.2 2.4 ± 0.1 14.9 ± 0.1 2.1 ± 0.1 27 ± 2 0.53 ± 0.06
T4 21.3 ± 0.2 2.4 ± 0.1 15.3 ± 0.1 2.0 ± 0.1 27 ± 2 0.53 ± 0.06
T5 20.7 ± 0.2 2.3 ± 0.1 15.6 ± 0.1 2.0 ± 0.1 27 ± 2 0.56 ± 0.06
T6 20.6 ± 0.2 2.4 ± 0.1 14.9 ± 0.1 2.1 ± 0.1 27 ± 2 0.55 ± 0.06
B1 21.2 ± 0.2 2.4 ± 0.1 12.1 ± 0.1 1.9 ± 0.1 23 ± 2 0.46 ± 0.06
B2 21.6 ± 0.2 2.3 ± 0.1 1 ± 0.1 1.5 ± 0.1 20 ± 2 0.40 ± 0.06
Table 3. Measurement results: series resistance.
Module RS
SOLARWATT (new) 0.58 ± 0.01
P1 2.1 ± 0.2
P2 1.1 ± 0.4
P3 1.4 ± 0.3
P4 1.9 ± 0.4
ARCO Solar (new) 0.39 ± 0.01
T1 1.4 ± 0.3
T2 1.4 ± 0.4
T3 1.9 ± 0.5
T4 1.5 ± 0.3
T5 1.8 ± 0.4
T6 1.8 ± 0.4
B1 3.7 ± 0.5
[image:7.595.159.467.362.599.2]B2 4.5 ± 0.4
Table 4. Measurement results: shunt resistance.
Module (Rsh ± ΔRsh)× 10
SOLARWATT (new) (65 ± 1)
P1 (40 ± 5)
P2 (48 ± 7)
P3 (47 ± 7)
P4 (51 ± 8)
ARCO Solar (new) (58 ± 9)
T1 (32 ± 3)
T2 (40 ± 5)
T3 (39 ± 5)
T4 (33 ± 3)
T5 (31 ± 3)
T6 (47 ± 7)
B1 (23 ± 2)
B2 (17.4 ± 0.9)
about 39%. In the ARCO Solar T subgroup the most unfavorable value was 40%, very similar to that obtained for the SOLARWATT devices, whereas the ARCO Solar subgroup B showed a decrease of 66%. From these results it may be concluded that the shunt resistance had decreased between 40% and 70%.
Table 5. Decrease in power and form factor.
Module % P (W) 100-% P (W) % FF 100-% FF
P1 70 30 84 16
P2 68 32 83 17
P3 71 29 88 12
P4 71 29 87 13
S. (new) 100 --- 100 ---
T1 59 41 86 14
T2 59 41 84 16
T3 51 49 72 28
T4 50 50 71 29
T5 50 50 75 25
T6 51 49 74 26,17
B1 44 56 61 39
B2 37 63 53 47
[image:8.595.85.538.342.559.2]A.S. (new) 100 --- 100 ---
Table 6. Power loss measured through the decrease in shunt resistance. Module IRsh (mA) Rsh1(Ω) ISC (%) through Rsh PRsh (W) Ploss (W)
S. (new) 31.65 653.17 1.11 0.65
P1 50.00 397.80 2.08 0.99 0.34
P2 41.67 479.96 1.79 0.83 0.18
P3 41.67 472.28 1.80 0.82 0.17
P4 39.47 506.71 1.70 0.79 0.14
A.S. (new) 37.30 577.48 1.14 0.80
T1 63.29 317.33 2.66 1.27 0.47
T2 50.63 401.79 2.13 1.03 0.23
T3 51.28 393.15 2.11 1.06 0.23
T4 61.91 329.90 2.63 1.26 0.46
T5 63.83 313.33 2.78 1.28 0.47
T6 42.55 470.00 1.80 0.85 0.05
B1 89.74 225.79 3.75 1.82 1.02
B2 117.02 174.20 5.13 2.39 1.58
Figure 6. Power loss caused by the increase in series resistance of the modules. 0
5 10 15 20 25
Po
w
er
(W
)
Modules
[image:8.595.177.487.589.701.2]resistor had been connected to the original, giving as equivalent resistance the one that was measured and the power loss of the device is what dissipated the new resistor.
It can be observed that the current through the shunt resistor of a new device with mono crystalline silicon is about 1% of that of the short circuit current, as has been reported by Lorenzo (2006) and in the deteriorated modules this is about 5% in the most unfavorable case.
[image:9.595.155.476.387.534.2]As can be observed in Figure 7, as a result of the shunt resistance effect a new module loses about 0.65 to 0.80 W and a deteriorated device between 0.79 and 2.39 W.
Figure 8 shows the power loss of deteriorated devices compared with new modules. Therefore, the analysis was again carried out in a simple constant current circuit to measure the power loss due to the incorporation of another shunt resistor. The result will be an equivalent resistance that is identical to the measured resistance. As can be observed the loss oscillated between 0.14 and 1.58 W.
The first analysis that can be carried out is the variation in the characteristic parameters, reflected in the power loss and the form factor as shown in Table 5.
From the analysis in Table 5, it can be observed that the power loss of the set of modules studied oscillated between 30% and 62%. In the P group the amplitude in the percentage is rather small (29% - 32%) and this can be seen in the I-V graphs and, as has been mentioned before, degradation in the modules is quite similar. The second group (T/B) shows a different pattern. The power loss in the T devices varied between 41% and 50% and that of the B devices between 56% and 63%. As these percentages explain the total loss the modules have suf-fered as a result of the different types of degradation, the current analysis will try to quantify the contribution of each of the factors, as it is shown in Figure 9 and Figure 10.
The effect of the increase in series resistance, the diminution in shunt resistance, the degradation in the trans-parent cover as well as other unidentified degradations not analyzed in the current study will be expressed as a percentage of the total loss.
[image:9.595.160.475.570.705.2]Figure 7. Power loss in the shunt resistance of the modules.
Figure 9.Power loss caused by an increase in series resistance (compared with total power produced by an unexposed module).
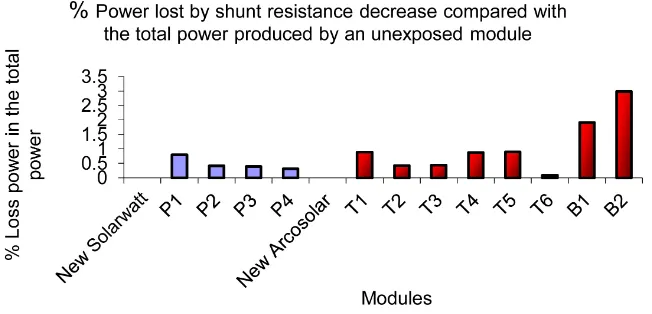
Figure 10. Power loss caused by a diminution in shunt resistance compared with the
to-tal power produced by an unexposed module.
4.3. Loss Caused by the Variation in the Resistance of the Equivalent Circuit
The first observation that can be made is that the power loss of the B devices as a result of the degradation in the resistors of the equivalent circuit is higher than that observed in the other devices (P and T). The power loss caused by the increase in series resistance is 23% compared with 10% for P and T devices.
These power losses are caused by important variations in the resistors of the equivalent circuit in the B mo d-ules, as the series resistance in this group increased about 1000% compared with about 300% for the P and T devices (Figure 11). Similarly, the shunt resistance decreased about 70% in the case of B devices and about 30% for the P and T modules (Figure 12).
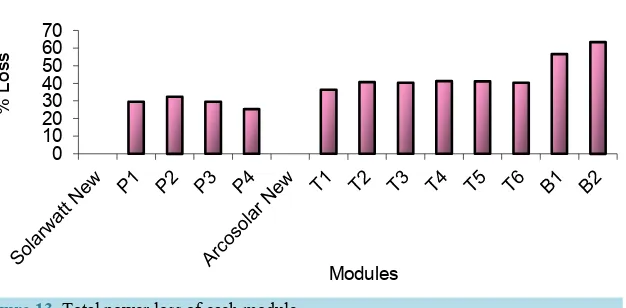
If the total loss of each module is analyzed, it can be seen that this is about 30% for P and T modules and 60% for B modules (Figure 13).
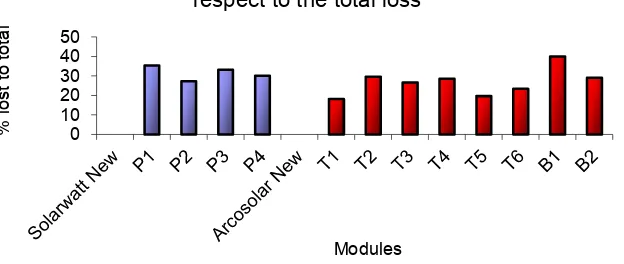
If the power loss caused by the variation in resistance is compared with the total power loss of each module it can be observed that the contribution of the increase in series resistance is about 30% (Figure 14). The different groups showed a similar pattern. The loss as a result of a decrease in shunt resistance showed a different pattern (Figure 15), with a contribution of 1.6% in the case of P and T devices and 4% for B devices.
4.4. Losses Caused by the Degradation in the Transparent Cover
If a comparison is made between the I-V characteristic curve of a new and deteriorated module under identical radiation and temperature conditions, it can be observed that the current of the short circuit proportionally de-creases with increasing degree of degradation of the cover. The effect on the voltage of the open circuit is not significant and this strengthens the following hypotheses generally formulated when working with photovoltaic devices that:
0 5 10 15 20 25
%
Los
s
by
inc
reas
ing
the
ser
ies
res
is
tanc
e
Modules
[image:10.595.153.479.269.426.2]Figure 11.Increase in series resistance (compared with the original resistance of a non-
[image:11.595.160.472.293.452.2]deteriorated module).
Figure 12.Decrease in shunt resistance (compared with the original resistance of a non-
deteriorated module).
Figure 13.Total power loss of each module.
• the current of the short circuit of a photovoltaic cell exclusively depends on the radiation following a linear function. This hypothesis supposes that power loss is reflected in the current of the short circuit, the temper-ature of the cell and the spectral distribution of the radiation. The error is less than 0.5% under authentic o p-eration conditions [2].
0 200 400 600 800 1000 1200
%
Inc
reas
e
of
R
s
Modules
% increase of series resistance
0 10 20 30 40 50 60 70
%
Los
s
Modules
[image:11.595.162.475.502.656.2]Figure 14.Contribution of increase in series resistance.
Figure15. Contribution of diminution in shunt resistance as a percentage of the total power loss.
• the voltage of the open circuit of a module depends exclusively on the temperature of its photovoltaic cells. This hypothesis suggests that effects of the light on the voltage of the open circuit are insignificant. The error is less than 1% [2].
Figure 16 graphically displays the power loss caused by degradation in the transparent cover for each module as a percentage of the total loss. What draws the attention is that the modules with the smallest loss belong to the B group with a contribution of about 57% of the total power loss.
4.5. Global Results
Figure 17 graphically shows the power loss that corresponds to each of the different degradation reasons as a percentage of the original power the modules should be able to provide.
It can be concluded that the factor that causes most of the power loss is the degradation in the encapsulation material, contributing between 20% and 30%. The increase in series resistance is the second most important factor causing a loss of about 10%, except for the B modules in which the loss is about 20%. The third factor assayed is the diminution in shunt resistance causing a loss of about 0.6% in P and T devices and 2.5% in B modules. Compared with the first two causes, this loss is not very significant. Figure 18 graphically displays the contribution of each of the degradation parameters assayed for each of the modules.
Special attention should be paid to analysis of the results obtained with the B modules. The power loss caused by the higher degree of degradation in the resistors of the equivalent circuit could be the result of a corrosion phenomenon in the interconnections.
In general terms it can be said that the decrease in transmittance results in a diminution in the current gener-ated because it is directly relgener-ated to the radiation received by the electrical energy producing cell. It can be ob-served that the power loss of the modules is strongly related to the change in optical properties of the materials
0 10 20 30 40 50
%
los
t t
o t
ot
al
Modules
Figure 16.Contribution of the degradation in the transparent cover as a percentage of
[image:13.595.157.473.325.474.2]the total power loss.
Figure 17.Losses compared with the non-deteriorated module.
[image:13.595.157.482.550.707.2]making up the cover, mainly to the loss of transmittance of the encapsulation material. Analysis of the I-V
curves measured both under light conditions and in the dark, reveals that the performance of all modules was
very similar. Degradation, analyzed considering the resistors of the equivalent circuit, showed values within the range that could be expected. Consequently, the pattern of the characteristic curves was similar within each group of modules (P, T and B) and between the two major groups (P compared with T/B). The shunt resistance decreased but compared with the other factors, the negative effect on the power (resulting in power loss) is not very significant.
As can be observed throughout the analysis the B modules deserve special attention. Their connection to bat-teries for a prolonged time seemed to have caused a considerable increase in the series resistance, which results in a notable loss of the power production that could be directly related to some kind of corrosion effect. The de-crease in shunt resistance was 70%, and the loss caused by this factor was 100% more than that of the other modules, but even so it is still insignificant compared with the other degradation factors. Another interesting de-tail revealed by the study is that the degradation in the cover is 20% less than that of the other modules. This is in agreement with a visual inspection as at a simple glance the covers showed a more bluish color which would indicate that the amount of radiation received by these modules was different from that received by the other modules. Besides, additional types of degradation that occurred in these modules should also be analyzed som e-thing that could not be determined in the current study. There were only two such modules in our study and there was no time to find another set of devices that had been working under different conditions; other analysis factors than those analyzed in the current study could be responsible for the degradation in the photovoltaic de-vices.
5. Conclusions
The power loss in photovoltaic modules in the Argentinian northwest caused by a prolonged exposure to espe-cially solar radiation cannot be left unconsidered. When considering the type of system to install, the degrada-tion factor should be taken into account. Our study (despite representing a very special case) reveals that the power loss of the modules is strongly related to the change in optical properties of the materials that constitute the cover, mainly to the loss of transmittance of the encapsulation material. It can be concluded that the most important factor causing power loss is the degradation in the encapsulation material. The increase in series re-sistance was the second most important factor, whereas the effect of the decrease in shunt rere-sistance was practi-cally insignificant compared with the loss caused by the other two factors mentioned.
Considering all factors, degradation of the encapsulating material is the most important (about 38%). Second-ly, it is the increase of the series resistance, which translates into a loss of about 20%. Other various factors that have not been studied represent around 12% and finally decreased parallel resistance of around 7%. Also, the decline in the first five years is negligible. However, in the most extreme environmental conditions, these mod-ules lost more than 25% of their initial potency after eleven years of work, and in some cases, at twelve directly ruined. The analysis in the modules that have been studied and the degradation of the encapsulating material that is due to their properties are strongly affected by radiation, especially ultraviolet.
References
[1] Duffie, J.A. and Beckman, W.A. (2006) Solar Engineering of Thermal Processes. 3rd Edition, Wiley-Interscience, New York, 747-775.
[2] Lorenzo, E. (2006) Electricidad Solar Fotovoltaica Vol. II “Radiación Solar y Dispositivos Fotovoltaicos”. 1ra Edición, Progensa, Madrid.
[3] Wolf, M. and Rauschenbach, H. (1963) Series Resistance Effects on Solar Cell Measurements. Advanced Energy Con-version, 3, 455-479. http://dx.doi.org/10.1016/0365-1789(63)90063-8
[4] Imamura, M.S., Helm, P. and Palz, W. (1992) Photovoltaic System Technology. Commission of the European Com-munities, Brussels and Luxenbourg, 86-92.
[5] Imamura, M.S., Brantzig, Y. and Dark, I.-V. (1972) Characteristics and Their Applications. Proceeding of 8th Interso-ciety Energy Conversion Engineering Conference, Las Vegas, August, 291.
[6] Green, M. (1982) Solar Cells. Prentice Hall, Kensigton, Capitulo 5, 95-98.
[8] Van Dyk, E.E. and Meyer, E.L. (2004) Analysis of the Effect of Parasitic Resistance on the Performance of Photovol-taic Modules. Renewable Energy, 29, 333-344. http://dx.doi.org/10.1016/S0960-1481(03)00250-7
[9] Montero, M.T. and Cadena, C. (2004) Como influye la degradación de la cubierta transparente en la pérdida de potencia de módulos FV. ERMA (Energías Renovables y Medio Ambiente), 14, 33-38.
[10] Montero, M.T. (2003) Evaluación y análisis del comportamiento eléctrico de paneles fotovoltaicos expuestos a la intemperie por más de 10 años. Tesis de Maestría, Universidad Nacional de Salta, Salta.
[11] Montero, M.T. and Cadena, C. (2008) Pérdida de potencia en módulos fotovoltaicos por degradación de sus parámetros eléctricos. AVERMA, 12, 439-445.