Munich Personal RePEc Archive
India’s PTAs and their Economic
Impacts: Quantitative Assessments using
a Partial Equilibrium Modeling
Framework
Raihan, Selim
South Asian Network on Economic Modeling (SANEM),
Department of Economics, University of Dhaka, Bangladesh
July 2009
Online at
https://mpra.ub.uni-muenchen.de/37899/
1
India’s PTAs and their Economic Impacts:
Quantitative Assessments using a Partial Equilibrium
Modeling Framework
Selim Raihan
2
India’s PTAs and their Economic Impacts:
Quantitative Assessments using a Partial Equilibrium Modeling Framework
Selim Raihan
I. Introduction
Proliferation of bilateral and regional trading arrangements has been a salient feature of global trade since the beginning of the 1990s. India is no exception to this trend. India’s impressive economic growth and fast-rising trade volumes have attracted many countries to negotiate bilateral and regional trading block with it. Average tariffs in India are considerably higher than that of the Western developed countries and are also higher than many developing economies. High tariffs and one of fastest growing urban middle class make India an ideal export destination for any country in the world. From India’s perspectives, bilateral and regional trading initiatives can also be beneficial if it can ensure market opening for its own exports, which often not possible through the multilateral trade negotiations. Large domestic market can also attract huge foreign investment in India with various spillover effects. Bilateral trade liberalization can help procure capital machinery and other raw materials at lower cost thereby contributing to Indian firms’ competitiveness. Furthermore, India is a major economic power in South Asia and highly values the bilateral relationship with its neighbours. In this respect, it has political commitment to promote economic growth through extended regional cooperation of which regional trading arrangement is an important component.
However, there is no guarantee that regional or bilateral trading arrangements will be beneficial to all the countries involved. In fact, the relevant international trade literature strongly suggests that the outcomes of regional arrangements can be ambiguous; some countries can gain while others may face adverse consequences. It may also happen that a member manages to expand its exports after the formation of regional/bilateral trading bloc, but loses out in terms of overall welfare effects and vice versa. Overall positive welfare effects can also be accompanied by large revenue losses, which are likely to have important implications for most developing countries. Another important issue is that, while under the unilateral (i.e. multilateral) liberalization schemes, a country gains (in terms of overall welfare effects) unambiguously, under the regional trading initiative this is not the case. Under regional/bilateral trading schemes, individual member countries’ overall welfare consequences are determined by the nature and magnitude of preferences that it can secure from its partner countries. Given all this, assessing the implications of regional trading arrangements is quite a challenging task.
3
The important feature of this paper is that it uses a partial equilibrium model to simulate for different scenarios under the three different PTAs mentioned above. This partial equilibrium model helps explore the impacts at a very disaggregate product level. Briefly, this paper investigates into the net trade, overall welfare and revenue effects of bilateral/regional liberalisation for India under various preferential trading scenarios.
The organization of the paper is as follows. After the brief introduction, Section II presents in details the methodology of the partial equilibrium modeling technique. Section II provides the simulation results for India – Sri Lanka bilateral FTA. Section IV presents the results of the simulation for SAFTA and finally Section V analyses the simulation results for India – Singapore bilateral FTA.
II. METHODOLOGY: SIMULATION EXERCISES THROUGH WITS/SMART PARTIAL EQUILIBRIUM MODEL
2.1. Rationale for a Partial Equilibrium Model
There is no denying that trade policy analysis is more robust when undertaken within a general equilibrium modeling framework. This can be seen as the first-best option as general equilibrium models, not only measure the first-round effects of simulated changes, but also the second-round effects which include inter-industry effects and macroeconomic adjustments. However, due to lack of data disaggregation in the GTAP modeling methodology, the partial equilibrium modeling framework lends itself as a second-best option.
The main distinction that should be noted at the outset is that as a partial equilibrium model, the inter-sectoral implications (second-round effects) of a trade policy change are not taken into account, as is the case in the general equilibrium model. Similarly, the inter-regional implications are also ignored in a partial equilibrium framework. The only point of convergence of the partial and general equilibrium models is that it is still possible within a partial equilibrium model to analyze the trade policy effects on trade creation and diversion, welfare and even on tariff revenues while holding everything else constant.
4 2.2. The WITS/SMART Model
For the purposes of this study, it is proposed that the WITS/SMART model will be the applied partial equilibrium framework. The World Integrated Trade Solution (WITS) brings together various databases ranging from bilateral trade, commodity trade flows and various levels and types of protection. WITS also integrate analytical tools that support simulation analysis. The SMART simulation model is one of the analytical tools in WITS for simulation purposes. SMART contains in-built analytical modules that support trade policy analysis such as effects of multilateral tariff cuts, preferential trade liberalization and ad hoc tariff changes. The underlying theory behind this analytical tool is the standard partial equilibrium framework that considers dynamic effects constant. Like any partial equilibrium model, it has these strong assumptions allowing the trade policy analysis to be undertaken a country at a time. In spite of this weakness, WITS/SMART can help estimate trade creation, diversion, welfare, revenue effects and effects on exports for those countries whose data is available. WITS database comes from various sources. The external trade statistics comprise of UN COMTRADE, UNCTAD TRAINS and the WTO Integrated Data Base (IDB). The tariffs data is derived from UNCTAD TRAINS, WTO IDB and WTO Consolidated Tariff Schedule Data Base (CTS). The non-tariff measures are compiled from UNCTAD TRAINS database.
The underlying analytics of the theory are clearly defined in Laird and Yeats (1986) and ECA (2000). The derivation begins with a basic trade model composed of simplified import demand and export supply functions and an equilibrating identity:
A simplified import demand function for country j from country k of commodity i:
= (1)
The export supply function of commodity i of country k can be simplified as:
= (2)
The equilibrium in the trade between the countries is the standard partial equilibrium equation:
= (3)
In a free trade environment, the domestic price of the commodity i in country j from country k would change with the change in an ad valorem tariff as follows:
+
= (4)
In order to get the price equation, differentiating (4) we obtain:
+ +
= (5)
5
=α (6)
Using this, one obtains the change in imports:
+ +
=α (7)
In the similar process one can obtain, with the elasticity of export supply function, the change in exports:
α
=
Using (7) one can calculate the trade creation effect:
γ α α
− +
= (8)
Where is the sum of trade created in millions of dollars over i commodities affected by
tariff change and α is the elasticity of import demand for commodity I in the importing country from the relevant trading partner. is the current level of import demand of the
given commodity i, while and represent tariff rates for commodity i at the initial and end periods respectively. According to the UNCTAD model, trade creation depends on the current level of imports, the import demand elasticity, and the relative tariff change and occurs when there is a shift from higher cost producer to lower cost producer as a result of elimination of tariffs on imports from the partner.
If γ approaches infinity, then equation 8 can be simplified as follows:
+ + − +
=α (9)
The elasticity of substitution is expressed as the percentage change in relative shares of imports from two different sources due to a 1 percent change in the relative prices of the same product from the two sources. Conceptually, the elasticity of substitution is a measurement of the ease with which various imports can be substituted for one another. Technically, it is measured as the slope of the import isoquant.
=
∑
∑
6
In this equation, k denotes imports from the RTA member countries and K denotes imports from the rest of the world.
Trade diversion occurs when an efficient producer from outside the free trade area is displaced by less efficient producers in the preferential area. Essentially, trade diversion depends on the current level of imports from RTA member countries and the ROW, the percentage change of tariffs facing imports from RTA member countries with those from ROW remaining unchanged, and the elasticity of substitution σ of the imports between the RTA member countries and ROW into the concerned country. In the SMART framework, the trade diverted to the RTA member countries can be expressed as:
σ σ
− +
+ +
+
− + +
= (11)
The strength of trade diversion depends on whether one assumes that goods are perfectly substitutable or whether goods are imperfectly substituted and whether calculations are made at official rates or on actual collected rates.
The WITS/ SMART framework has a very precise and elegant methodology for calculating revenue effects. The tariff revenue is the product of the tariff rate and the tariff base (value of imports). Thus, before the change in the ad valorem incidence of trade barriers, the revenue is given as:
∑∑
= (12)
After the change in tariff rate, the new revenue collection will be given by:
∑∑
= (13)
The revenue loss as a result of the implementation of any RTA is the difference between
and .
The WITS/SMART model estimation of welfare effects is quite simple. This is unlike the equivalent variations measurement in general equilibrium models. Essentially, the welfare effect is mainly ascribed to the consumer benefits in the importing country as a result of lower import prices. This allows them to substitute more expensive domestic or imported products with the cheaper imports that are affected by the relevant tariff reduction. Increased imports leads to a net welfare gain that can be thought as the increase in consumer welfare and is measured as follows:
7
The coefficient of 0.5 captures the average between the ad valorem incidence of the trade barriers before and after their elimination/reduction. Equation (14) assumes that the elasticity of export supply is infinite. If this is not the case, the import prices in the importing countries fall by less than the full reduction in trade barriers. Therefore, while the equation can be used to measure welfare effect, it is no longer a representation of consumer surplus alone but has some element of producer surplus (Laird and Yeats, 1986).
III. INDIA-SRI LANKA BI-LATERAL FTA
3.1. Overview of the Agreement
The Free Trade Agreement between India and Sri Lanka came into full existence from 1st March 2000. This FTA basically deals with the modalities of the Duty Free Import of the goods manufactured in Sri Lanka which exempts specified goods imported under Indo- Sri Lanka Free Trade Agreement from the Import Duty up to 100 percent. There was a clear business opportunity for manufacturers from India to set up unit in Sri Lanka so that the goods produced in Sri Lanka can be brought to India duty free availing the exemption provided in the Free Trade Agreement. Since there is no Excise Duty in Sri Lanka or Import Duty the goods produced there would be cheaper.
Under the agreement Zero duty on around 1,000 items has been provided by India with 50 per cent margin of preference on all items, except for those in the Negative List. Tariffs have been brought down to zero over a period of three years. Concessions on textile items have been restricted to 25 per cent. Four chapters under the textiles sector have been retained in the Negative List. India has retained less 429 items in its Negative List. These mainly include garments, petro-chemicals, alcoholic spirits and coconuts and coconut oil. Sri Lanka has 1180 items in its Negative List. Items in the Negative List do not enjoy tariff concessions.
Domestic value-addition requirements have been kept at 35 percent. If the raw-material/inputs are sourced from each other’s country, this is reduced to 25 percent within the overall limit of 35 percent. The criterion of ‘substantial transformation’ has been provided in the Rules.
3.2. Simulation Design and Results
Using the proposed methodology two simulations have been carried out, viz:
• Simulation 1.1: India-Sri Lanka BFTA: No negative list restriction
• Simulation 1.2: India- Sri Lanka BFTA: With negative list restriction
The results of the simulations are discussed in the following sections.
3.2.1. Simulation 1.1: India- Sri Lanka BFTA: No negative list restriction
8
[image:9.612.72.435.210.417.2]consequences for India are presented in Annex Table 1. The trade creation effect is caused by increase in exports from Sri Lanka that replaces domestic production. Figure 1 shows that the estimated trade creation for India is $350 million. Trade diversion, on the other hand, is the cost due to displacement of trade from a low cost source to a higher cost source. That is, it occurs when Sri Lanka replaces imports from the rest of the world taking advantage of the bilateral tariff preferences granted by India. The trade diversion effect is estimated to be about $62 billion. As trade creation effect is much larger than that of trade diversion, there is a net large positive trade effect for India, amounting to $291 million.
Figure 1: Trade effects of India-Sri Lanka BFTA with no negative list restrictions
The bilateral tariff reduction schemes contribute to rising trade between the two countries. The import from Sri Lanka to India is increased by $414 million, which is estimated to be 115 percent rise from the base (i.e. from a situation of no bilateral FTA). On the other side, the export from India to Sri Lanka increases by $110.5 million, which is just 14 percent higher than the base case. One reason for relatively small increase in India’s export to Sri Lanka could be due to initial low MFN tariffs maintained by Sri Lanka.
The welfare effect in this partial equilibrium model is driven by improved consumers’ welfare resulting from lower prices of goods imported under the bilateral FTA. The results suggest a net welfare gain of about $67 million for India.
Another important consideration is the impact of bilateral liberalization on tariff revenues collected by India. The higher the additional import is sourced from Sri Lanka, the higher will be the amount of forgone tariff revenues. Given the import surge of more than $400 million taking place in the aftermath of bilateral FTA, a sizeable revenue loss (of $110 million) occurs.
9
million of trade creation, which is about 37 per cent of total trade creation. Copper and related articles, certain nuclear reactor materials, articles of stone, plaster and cement, and animal and vegetable fats are the most important five products that together account for about two-thirds of the trade creation effects generated in India. The top 50 products (as provided in Annex Table 2) provide about 95 percent of total trade creation.
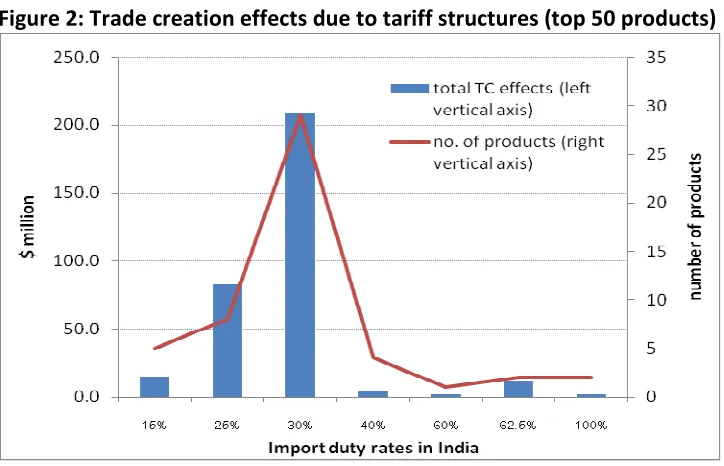
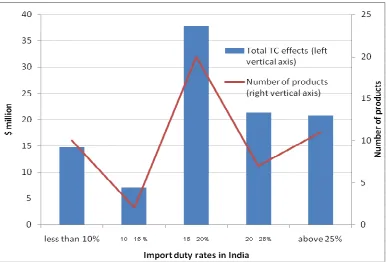
[image:10.612.73.435.261.494.2]Trade creation in this model depends on the nature of the products involved, initial imports and tariff structures. Figure 2 shows the distribution of trade creation effects by Indian tariff structures. It shows that of the top 50 trade creating lines, there are about 30 products each facing an import duty rate of 30 percent. These product lines account for about 60 percent of trade creation. The next most important trade creation effects arise from the abolition of tariff rate of 25 percent involving 8 commodities.
Figure 2: Trade creation effects due to tariff structures (top 50 products)
Annex Table 3 provides the information on top 50 products in terms of the source of trade diversion effects. The listed products combined together account for 41.03 percent of total trade diversion effects. Therefore, in comparison with the trade creation, diversion effects are much more widespread. This also implies that despite their overall small magnitude, tariff preferences under the bilateral deal provide Sri Lanka with some competitive advantage in a range of products.
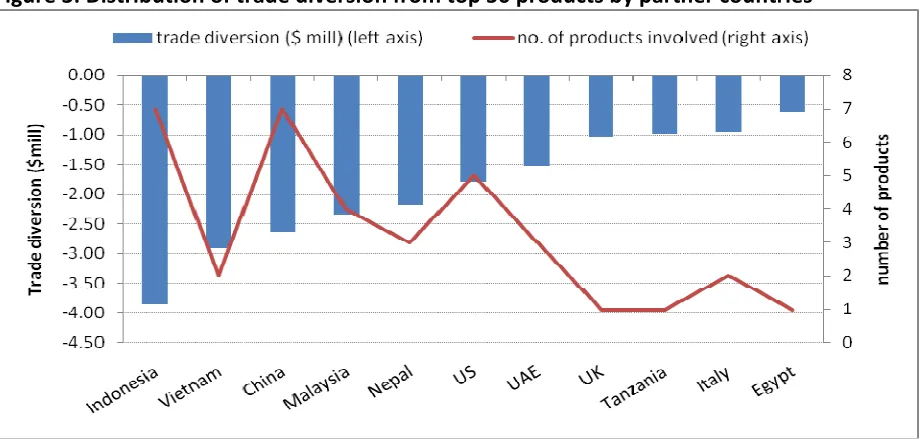
Figure 3 gives the distribution of trade diversion from top 50 countries across partners. It is found that in the first 50 items of trade diversion there are eight commodities in which
10
[image:11.612.75.537.126.347.2]considerably affected. Tariff preferences to Sri Lanka undermine export competitiveness of Nepal in four product lines, triggering trade diversion of $2.25 million.
Figure 3: Distribution of trade diversion from top 50 products by partner countries
One direct consequence of any bilateral trade arrangements is forgone tariff revenues as duty-free and/or reduced duty rate access of FTA partners’ goods are allowed. Simulation results show that bilateral FTA with Sri Lanka would cause a revenue loss of US$134 million. In terms of adverse revenue consequences, the top 50 products are identified in Annex Table 4. They account for 84.86 percent of the revenues forgone. Products classified as HS740319, HS09700, HS720449, HS740312, and HS090411 are the five most important products leading to revenue losses. These are mainly copper, beverage (coffee and tea), and iron and steel related products. According to the results, the above-mentioned 5 HS-digit products result in losses of $51 million, i.e. about 38 per cent of all revenues forgone.
11
Figure 4: Distribution of revenue losses over Import duty rates
The disaggregated data used in the empirical analysis also help identify the commodities that register largest increase in imports into and exports from India. Tables 1 and 2 list 50 such products respectively. In terms of imports from Sri Lanka to India, top 50 products account for 87.87 per cent of increase in total import rise under the bilateral FTA. Animal and vegetable fats (mainly vegetable oils), wood and paper products, copper and related products, and certain textiles and clothing items turn out to be major Sri Lankan export beneficiaries.
12
Table 1: ISFTA – List of 50 products with the largest increases in Imports from Sri Lanka to India
HS Code Import Before ($ ‘000) Import After (% ‘000) Change In Import ($ ‘000) % change from base
30613 Fish, crustaceans & aquatic 143.13 1390.46 1247.33 871.47
80111 Edible fruit, nuts, peel of 6165.77 7901.13 1735.36 28.15
90220 Coffee, tea, mate and 25.87 1414.11 1388.24 5366.43
90240 Coffee, tea, mate and 859.13 2293.19 1434.06 166.92
90411 Coffee, tea, mate and 7530.77 12381.89 4851.12 64.42
90700 Coffee, tea, mate and 19477.85 32574.62 13096.77 67.24
151110 Animal or vegetable fats 1371.17 2846.43 1475.27 107.59
151190 Animal or vegetable fats 1380.77 2940.00 1559.23 112.92
151620 Animal or vegetable fats 17372.14 34221.92 16849.78 96.99
230650 Food industry residues & 1440.66 3107.93 1667.27 115.73
392620 Plastics and articles thereof 144.56 1996.29 1851.73 1280.92
392690 Plastics and articles thereof 5772.91 10164.09 4391.19 76.07
400121 Rubber and articles thereof 2635.87 3955.33 1319.47 50.06
401110 Rubber and articles thereof 3549.13 4996.11 1446.99 40.77
420221 Leather articles; saddlery 43.54 1843.74 1800.20 4134.49
441111 Wood and articles of wood; 1283.42 6173.81 4890.38 381.04
441119 Wood and articles of wood; 1738.55 5255.14 3516.58 202.27
470790 Pulp of wood or of other 6430.61 8471.96 2041.35 31.74
481910 Paper & paperboard & 442.70 4710.59 4267.89 964.06
481930 Paper & paperboard & 406.29 1950.70 1544.41 380.13
520942 Cotton, including yarn and 462.27 1834.69 1372.43 296.89
600621 Knitted or crocheted fabrics 96.12 2067.13 1971.01 2050.61
600622 Knitted or crocheted fabrics 61.28 1326.36 1265.08 2064.29
620462 Apparel articles and 58.43 3133.36 3074.94 5263.05
680221 Articles of stone, plaster, 11645.70 30913.60 19267.90 165.45
690710 Ceramic products 298.16 1539.09 1240.93 416.20
690790 Ceramic products 850.24 3275.20 2424.97 285.21
690810 Ceramic products 296.24 7957.63 7661.39 2586.17
690890 Ceramic products 266.59 6864.18 6597.59 2474.82
691110 Ceramic products 525.88 4743.11 4217.24 801.94
710239 Natural or cultured pearls, 1592.52 2995.56 1403.04 88.10
720421 Iron and steel 889.26 2292.14 1402.88 157.76
720449 Iron and steel 14179.35 22874.70 8695.36 61.32
740120 Copper and articles thereof 36.11 1322.50 1286.39 3562.72
740312 Copper and articles thereof 30726.86 37412.44 6685.59 21.76
740313 Copper and articles thereof 1436.13 6604.33 5168.21 359.87
740319 Copper and articles thereof 58923.71 90653.54 31729.83 53.85
740322 Copper and articles thereof 1794.68 4012.88 2218.20 123.60
740721 Copper and articles thereof 374.21 1865.31 1491.10 398.47
741300 Copper and articles thereof 12039.50 132852.04 120812.55 1003.47
760110 Aluminum and articles 2594.16 4071.75 1477.59 56.96
760120 Aluminum and articles 7857.45 9950.34 2092.89 26.64
760511 Aluminum and articles 7155.34 17595.72 10440.38 145.91
790600 Zinc and articles thereof 837.30 6539.73 5702.43 681.05
800700 Tin and articles thereof 1484.78 3108.72 1623.94 109.37
842620 Nuclear reactors, boilers 18141.65 48851.70 30710.05 169.28
853931 Electric machinery 3234.14 4743.91 1509.77 46.68
854411 Electric machinery 5001.57 7354.34 2352.78 47.04
854419 Electric machinery 12336.31 16906.53 4570.22 37.05
854460 Electric machinery 998.44 2837.37 1838.93 184.18
[image:13.612.67.547.99.626.2]13
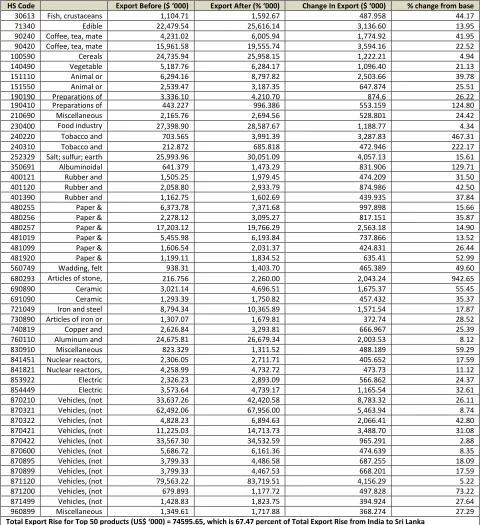
Table 2: ISFTA – Top 50 products with the Highest Increase in Exports from India to Sri Lanka (no sensitive list)
HS Code Export Before ($ ‘000) Export After (% ‘000) Change In Export ($ ‘000) % change from base
30613 Fish, crustaceans 1,104.71 1,592.67 487.958 44.17
71340 Edible 22,479.54 25,616.14 3,136.60 13.95
90240 Coffee, tea, mate 4,231.02 6,005.94 1,774.92 41.95
90420 Coffee, tea, mate 15,961.58 19,555.74 3,594.16 22.52
100590 Cereals 24,735.94 25,958.15 1,222.21 4.94
140490 Vegetable 5,187.76 6,284.17 1,096.40 21.13
151110 Animal or 6,294.16 8,797.82 2,503.66 39.78
151550 Animal or 2,539.47 3,187.35 647.874 25.51
190190 Preparations of 3,336.10 4,210.70 874.6 26.22
190410 Preparations of 443.227 996.386 553.159 124.80
210690 Miscellaneous 2,165.76 2,694.56 528.801 24.42
230400 Food industry residues &
27,398.90 28,587.67 1,188.77 4.34
240220 Tobacco and manufactured
703.565 3,991.39 3,287.83 467.31
240310 Tobacco and 212.872 685.818 472.946 222.17
252329 Salt; sulfur; earth 25,993.96 30,051.09 4,057.13 15.61
350691 Albuminoidal 641.379 1,473.29 831.906 129.71
400121 Rubber and 1,505.25 1,979.45 474.209 31.50
401120 Rubber and 2,058.80 2,933.79 874.986 42.50
401390 Rubber and 1,162.75 1,602.69 439.935 37.84
480255 Paper & 6,373.78 7,371.68 997.898 15.66
480256 Paper & 2,278.12 3,095.27 817.151 35.87
480257 Paper & 17,203.12 19,766.29 2,563.18 14.90
481019 Paper & 5,455.98 6,193.84 737.866 13.52
481099 Paper & 1,606.54 2,031.37 424.831 26.44
481920 Paper & 1,199.11 1,834.52 635.41 52.99
560749 Wadding, felt 938.31 1,403.70 465.389 49.60
680293 Articles of stone, plaster, cement,
216.756 2,260.00 2,043.24 942.65
690890 Ceramic 3,021.14 4,696.51 1,675.37 55.45
691090 Ceramic 1,293.39 1,750.82 457.432 35.37
721049 Iron and steel 8,794.34 10,365.89 1,571.54 17.87
730890 Articles of iron or 1,307.07 1,679.81 372.74 28.52
740819 Copper and 2,626.84 3,293.81 666.967 25.39
760110 Aluminum and 24,675.81 26,679.34 2,003.53 8.12
830910 Miscellaneous 823.329 1,311.52 488.189 59.29
841451 Nuclear reactors, 2,306.05 2,711.71 405.652 17.59
841821 Nuclear reactors, 4,258.99 4,732.72 473.73 11.12
853922 Electric 2,326.23 2,893.09 566.862 24.37
854449 Electric 3,573.64 4,739.17 1,165.54 32.61
870210 Vehicles, (not 33,637.26 42,420.58 8,783.32 26.11
870321 Vehicles, (not 62,492.06 67,956.00 5,463.94 8.74
870322 Vehicles, (not railway,
4,828.23 6,894.63 2,066.41 42.80
870421 Vehicles, (not 11,225.03 14,713.73 3,488.70 31.08
870422 Vehicles, (not 33,567.30 34,532.59 965.291 2.88
870600 Vehicles, (not 5,686.72 6,161.36 474.639 8.35
870895 Vehicles, (not 3,799.33 4,486.58 687.255 18.09
870899 Vehicles, (not 3,799.33 4,467.53 668.201 17.59
871120 Vehicles, (not 79,563.22 83,719.51 4,156.29 5.22
871200 Vehicles, (not 679.893 1,177.72 497.828 73.22
871499 Vehicles, (not 1,428.83 1,823.75 394.924 27.64
960899 Miscellaneous 1,349.61 1,717.88 368.274 27.29
14
3.2.2. Simulation 1.2: India- Sri Lanka BFTA: With Negative list restriction
Under this simulation, the liberalization scenario is considered after excluding the commodities that have been kept in the negative list. That is, these are the commodities on which liberalization commitment is not made.
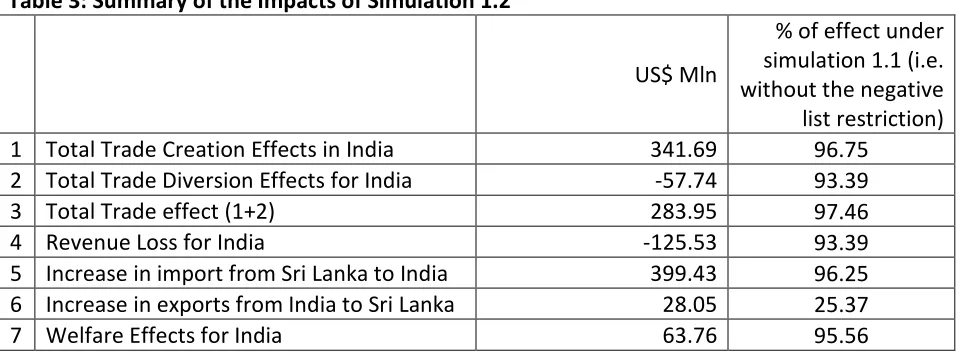
The summary of the results is presented in Table 3. Before getting into the results, it is important to mention that the results seem to suggest small differences in the indicators of interest between the two scenarios (i.e. with and without the negative list). More precisely, with the negative list restriction trade creation, diversion, revenue and welfare effects in India do not differ much with the scenario where there is no sensitive list. The only major exception is that with the consideration of the sensitive list India’s export rise to Sri Lanka gets restricted quite significantly (see Table 3).
[image:15.612.68.548.431.609.2]One possible reason for reduced export rise from India under this scenario is likely to be very restrictive nature of Sri Lanka’s negative list. It is also of interest to know why trade creation (and diversion as well) effects in India remain more or less unchanged between the two scenarios. This can be attributable to restrictive negative list of maintained by India. It is most likely that products that were highly restricted (either by high tariffs and/or by non-tariff measures) before the FTA had been kept in the negative list. If the previous restrictive regime had resulted in very limited trade in these goods, simulations of liberalized scenarios could generate low trade response. For example, if the initial trade barriers were prohibitive in nature, trade expansion could not be simulated.
Table 3: Summary of the Impacts of Simulation 1.2
US$ Mln
% of effect under simulation 1.1 (i.e. without the negative list restriction)
1 Total Trade Creation Effects in India 341.69 96.75
2 Total Trade Diversion Effects for India -57.74 93.39
3 Total Trade effect (1+2) 283.95 97.46
4 Revenue Loss for India -125.53 93.39
5 Increase in import from Sri Lanka to India 399.43 96.25
6 Increase in exports from India to Sri Lanka 28.05 25.37
7 Welfare Effects for India 63.76 95.56
15
These results are also comparable to the ones presented in the case of the simulation without the negative list restrictions.
The results on products triggering adverse revenue effects are placed in Annex Table 7. Of the $125 million lost revenue incurred under this scenario, 86.28 per cent is caused by 50 products. Finally Annex Tables 8-9 list the top 50 export products from Sri Lanka to India and vice versa under this scenario. These products account for about 90 per cent of the import rise from Sri Lanka and 71 per cent export rise from Sri Lanka.
IV. SOUTH ASIAN FREE TRADE AREA (SAFTA)
4.1. Overview of SAFTA
SAFTA has come into force from 1 July 2006, with the aim of reducing tariffs for intraregional trade among the 7 SAARC members. The Agreement on SAFTA has seven core elements: (i) trade liberalization programme; (ii) rules of origin, (iii) institutional arrangements, (iv) revenue compensation mechanism, (v) technical assistance for LDCs, (vi) safeguard measures and (vii) consultations and dispute settlement procedures.
As per Article 7 of the Agreement, tariffs on all products except the products under sensitive lists would be reduced to 0-5% within time frames agreed for LDCs and Non- LDCs. The Agreement stipulates that SAFTA Committee of Experts would review non-tariff barriers in its regular meeting with a view to eliminating them or making them non-restrictive.
The Agreement provides different timeframe for tariff reduction by LDCs and non-LDCs. Non-LDCs are required to reduce their tariffs for the products of Non-LDCs within a shorter period of time. Their tariffs applied on 1 January 2006 should be reduced to 0-5% among themselves within seven years (with one extra year for Sri Lanka). Non-LDCs are required to reduce tariffs on the products other than products under Sensitive Lists for LDCs to 0-5% within 31 December 2008. LDCs are required to reduce tariffs on the products other than the products under sensitive lists to 0-05% within 31 December 2015 as per following schedule:
The Agreement provides scope for maintaining of sensitive lists, which are not subject to tariff reduction programme. Although the Agreement maintains that sensitive list shall be different for LDCs and non-LDCs, only three countries namely Bangladesh, India and Nepal maintain different sensitive lists for LDCs and Non-LDCs. Besides, the LDCs maintain longer sensitive lists than the Non-LDCs. India has 865 products for non-LDCs and 744 products for LDCs in her sensitive list, whereas Sri Lanka maintains 1079 products for both LDCs and non-LDCs in her sensitive list.
4.2 Simulation Design and Results
Two simulations that have been carried out are as follows:
16
• Simulation 2.2: Full Implementation of SAFTA: With negative list restriction
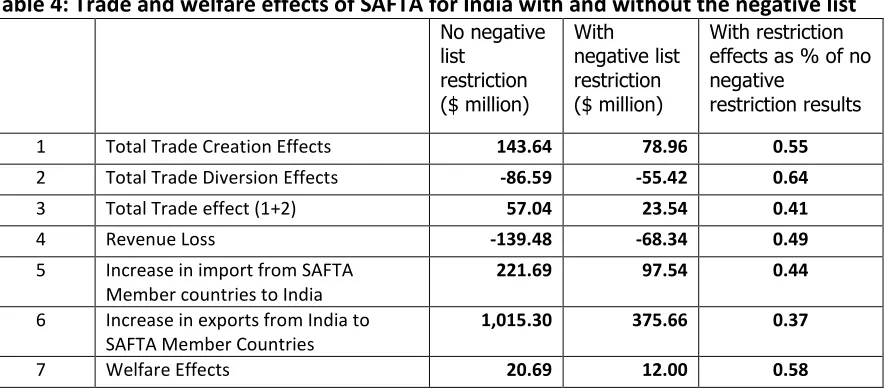
The main results concerning the key variables of interest are summarized in Table 4. The table also compares the results involving both the SAFTA liberalization scenarios. It is found that under both cases of with and without negative restrictions there are positive trade creation effects for India. When full SAFTA liberalization takes place, trade creation effects for India is estimated at $143 million. However, the limited liberalization (i.e. after excluding the commodities in the sensitive list) results in reduced trade creation of about $79 million. That is, trade creation with the negative list is 55 per cent of that of without any sensitive list restriction.
[image:17.612.77.522.342.538.2]Trade diversion effects under the full liberalization scenarios is estimated to be about $87 million while the corresponding figure for the scenario with the negative list is about $55 million. That is, the presence of sensitive list somewhat helps reduce the trade diversion effects. In other words, SAFTA member countries are not always the most efficient suppliers of the commodities kept in India’s restriction list. Net trade effect of SAFTA for India is positive and it is much more profound under the first scenario of ‘no negative list restriction’.
Table 4: Trade and welfare effects of SAFTA for India with and without the negative list
1 Total Trade Creation Effects 143.64 78.96 0.55
2 Total Trade Diversion Effects -86.59 -55.42 0.64
3 Total Trade effect (1+2) 57.04 23.54 0.41
4 Revenue Loss -139.48 -68.34 0.49
5 Increase in import from SAFTA Member countries to India
221.69 97.54 0.44
6 Increase in exports from India to SAFTA Member Countries
1,015.30 375.66 0.37
7 Welfare Effects 20.69 12.00 0.58
Table 4 also provides information on the revenues forgone due to preferences granted by India to other SAFTA members. In the absence of any sensitive list limitation revenue loss could be up to $139 million. However, because of the negative list included in SAFTA arrangement, the estimated revenue loss falls to $68 million.
17
India is the most important supplier within the SAFTA region and the regional integration arrangement provides an important opportunity for expansion of India’s exports further. Under full SAFTA liberalization, there is likely to be more than $1 billion worth of additional exports from India. But, given the restrictions imposed by partner countries under the shield of the negative lists, India’s export expansion is limited to only $376 million. Therefore, it seems that the sensitive lists of other SAFTA member countries are also quite stringent for India.
India registers overall positive welfare gains under both the scenarios. Under the first scenario of full liberalization, welfare gains are estimated to be $20.69 million, which is reduced to about $12 million given the presence of the sensitive list, restricting the scope of liberalization.
Annex Tables 10 and 11 provides the list of major products that lead to trade creation effects in India under SAFTA simulations 1 and 2, respectively. The listed 50 products in Annex Table 10 account for about 71 per cent of all trade creation effects under simulation 1. When the restrictions related to products apply, the identified 50 commodities in Annex Table 11 become the source of about 78 per cent of all trade creation. Under full liberalization animal and vegetable fats (HS 151620) from Nepal, edible fruits and vegetables (HS 080410) from Pakistan, organic chemicals (HS 2911736) from Pakistan, plastic articles (HS 392690) from Bangladesh and beverages (HS 220290) from Nepal turn out to be the five most important products triggering trade creation. A close investigation into Annex Tables 11 and 12 would reveal that the relative importance of the products in terms of trade creation is moderately changed as the liberalization is being restricted due to the India’s sensitive list.
18
Figure 5: Distribution of 50 products with the highest trade creation effects for India without the sensitive list
[image:19.612.75.526.432.677.2]19
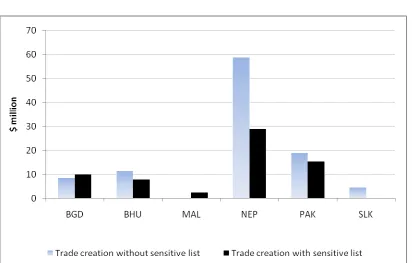
[image:20.612.73.488.159.422.2]Figure 7 shows the sources of trade creation in India by SAFTA partners. It shows that both with and without the sensitive list Nepal is the principal source of trade creation, followed by Pakistan. It is quite remarkable to find that when sensitive list is imposed, trade creation due to Nepal is halved from about $60 million to close to $30 million.
Figure 7: SAFTA – sources of trade creation by partners in India
20
Figure 8: SAFTA – distribution of trade creation without the negative list by members in India
Figure 9: SAFTA – distribution of trade creation with the sensitive list restrictions
[image:21.612.75.480.384.645.2]
21
about 55 per cent and 60 per cent of all trade diversion effects created by SAFTA preferences. It is found that edible fruits and nuts (HS 080410) from Iran, vegetables and agricultural products (HS 071390) from Myanmar, vegetables (HS 071320) from Australia and Iran, and processed vegetables (HS 071390) from Myanmar are the five commodities with the largest trade diversion effects both under the complete SAFTA liberalization and limited liberalization with sensitive list.
[image:22.612.74.492.310.580.2]As Annex Tables 12 and 13 capture sources of trade diversion by countries as well, it is possible to find out the rest of the world suppliers that are likely to be worst affected by SAFTA. Figure 10 summarises the information. It turns out that Iran, China, Myanmar, Australia, and Malaysia are amongst non-SAFTA countries from which supplies of different products are likely to be diverted. In other words, these countries produce a number of products more efficiently than SAFTA members, but preferences provided by India to its South Asian neighbours could replace the imports from them.
Figure 10: SAFTA – sources of trade diversion by India’s rest of the world partners
22
!
! !
! " #$% & #
' '
'
" $(
( )
* ! !
! "&$( %
+ ! ' !
! "($(
& #
' '
'
" $) % )
, ! - !
" $ (
% &
' !' !
!
" $ (
, - ! .
/ ! 0! !
1 ! !
0!
" $
%
+ ! '
! !
"($( (( %
2! ! ! '
0! 3 1
! " $(
%
! 3
! 3
4 "($ %
5 !
" $#
% ) , ! - ! " $& % 5 ! " $ %
%
' !' !
!
" $ ) (
, - . ! /
! / 1
- ! 1 .
! / !
" $
(
, - !
. / !
0! ! 1
! ! 0! " $ )%
2 !
! !
" $
%%
6 0
3 1! /
! ! !
" $ & #
5 ! - ! /
! !
! ' ! " !
-! ' ! !
" $
23
commodities in which India’s imports rise from SAFTA. Annex Tables 16-17 also indicate the source of supply of each of the commodities listed.
India’s export rise to different SAFTA countries is captured in Annex Tables 18 and 19. In general, the major export items from India are much more diverse than the imported products. In products such as beverages, apparels, and plastics, there are both imports and exports, suggesting the existence of intra-industry trade. However, the major broad commodities in which India register significant export rise include, sugar and salt, chemicals, mineral fuels, rubber, cotton, articles of iron, electric machinery and products, and heavy engineering products.
V. INDIA-SINGAPORE COMPREHENSIVE ECONOMIC COOPERATION AGREEMENT (CECA)
5.1. Overview of CECA
The Comprehensive Economic Cooperation Agreement (CECA) between Singapore and India came into effect on August 1 2005. The India-Singapore CECA has four key components: a free trade agreement (FTA) in goods; an arrangement for boosting trade in services, including financial services; a package to promote investment flows and provide mutual investment protection; and a new agreement for avoiding double taxation.
In CECA, tariff concessions are divided into three groups for the Singaporean goods which entering into India, as immediate elimination, phased elimination, and phased reduction. Immediate elimination group includes those goods which have tariffs until the CECA come into effect. For goods in the phased elimination and phased reduction groups will be phased over in five years and the rate of reduction will follow the Most Favored Nation (MFN) – margin of preference.
Singapore has entrusted to granting zero-tariff treatment on all imports from india as entry into force of the agreement, however, India granting MFN tariff structure for Singapore goods, for example, if any of the goods imposed 10 percent MFN tariff, at April 2009, it will be 5 percent depending on the 50 percent tariff reduction scheme.
Rules of Origin (ROO) confirm the authenticity of the goods of a particular country. According to the CECA, rules of origin indicates that only Singaporean or Indian goods benefiting from the tariff scheme. In India-Singapore CECA, ROO consists of 40 percent local content which actually applicable for 4 –digit level. This also includes the sole production pattern of Singapore and took them away from the general list. For each of these products specific ROO has been approved.
24
(a) List of Products for Early Harvest Program: On the originating goods of Singapore provided in this list, the duties shall be eliminated entirely and such goods will receive duty free entry into India from Singapore from 1st August 2005
(b) List of Products for Phased Elimination in Duty: On the originating goods of Singapore provided in this List, the duties shall be removed in five stages beginning from 1st August 2005 and such goods shall receive duty free entry into India from Singapore, effective 1st April 2009. The margin of preference offered by India has been indicated in the List.
(c) List of Products for Phased Reduction in Duty: On the originating goods of Singapore provided in this List, the duties shall be reduced in five stages beginning 1st August 2005 and such goods shall receive entry into India at concessional duties. The margin of preference offered by India has been indicated in the List.
(d) List of Products excluded from any concession in Duty: No concessions in duties shall be offered on goods provided in this List. Such goods whether originating or otherwise, shall enter into India from Singapore on the applied MFN duties.
5.2. Simulation Design and Results
Four Simulations are considered and they are as follows:
• Simulation 3.1: IND-SGP Bilateral FTA: Impact of Early Harvest
• Simulation 3.2: IND-SGP Bilateral FTA: Impact of Phased Elimination in Duty
• Simulation 3.3: IND-SGP Bilateral FTA: Impact of Phased Reduction in Duty
• Simulation 3.4: IND-SGP Bilateral FTA: Additional Impacts from the Removal of Sensitive List
The first simulation is quite straightforward as it considers the duty free access provided since 1st August 2005. The second simulation deals with a set of commodities for which tariffs were designed to be eliminated in five stages. Here the simulation is run to examine what happens when tariffs on the listed commodities have been brought down to zero for Singapore by India. The third simulation (Simulation 3.3) considers India’s commitment of phased duty reduction on a number of products originating in Singapore. To provide a meaningful scenario analysis, simulation 3 is designed to examine what happens if all duties are eliminated on these products. Finally, simulation 4 is carried out with a view to assessing the potential impacts of duty removal on sensitive items. Although no duty reduction commitment is intended for these products, the simulation experiment brings down the tariffs to zero on the items in the sensitive list.
25
the tune of about $59 million – is incurred. Overall, the welfare effect of the early harvest programme is positive and is estimated to be $13.56 million.
Table 6: Trade and welfare effects of India-Singapore FTA
! 0 -!
7-! !
-!
0
!
4 ! ! #$ # $ % $ ( $##
4 ! "# $(% "% $)& "#($(& "& $#
4 ! ! 8 $ ( &($ ) $(% $
"(%$ " $ "())$ ) " $ (
5 ! ! 5 ! #$ )$ # )&$%& #)$#
9 ! $() %$(( $(& #&$ (
When India eliminates all tariffs on the commodities kept under phased elimination (simulation 2), there is additional $177 worth of trade creation effects, or $60 million worth of net trade effects after deducting the resultant trade diversion effects. Imports from Singapore rise by $276 million. On the whole, this scenario is associated with a welfare gain of about $30 million for India.
In the case of third simulation the net welfare effect is found to be about $21 million with the net trade effect being about $68 million. However, what is most striking about this simulation is the significant loss in the tariff revenues. India stands to forgo more half a billion dollar worth of tariff revenue from the liberalization of this set of products. Singapore’s exports from this scenario increases only modestly by about $169 million. This therefore suggests that commodities under the phased reduction scheme are likely to be revenue sensitive. Liberalisation of these items also exerts the maximum welfare impact.
Finally, an additional welfare gain of about $48 million will be accrued to India from the liberalization of commodities that are kept in the sensitive list. Total trade effect, i.e. trade creation less trade diversion, is the highest for this category of products. On the whole, the results suggest that commodities kept under the sensitive list could be the most protected items and thus they promise significant trade and welfare gains for India.
26
[image:27.612.72.506.586.725.2]creation, 10-15% is the most important tariff bracket under the sensitive list (scenario 4), closely followed by phased reduction in duty (scenario 2).
Table 7: India-Singapore FTA – trade creation: value and number of commodities
! 0 -!
-!
! 0 -!
0
-! (:
$(#
; < " " "
(" : "
($&
; < " "
" (: $ ;#%< #%$ ;#)< &($ ;( < (%$& ;# <
(" : " " " "
" (: " " "
$ ;(<
! (: "
&$)
; < "
($) ;(<
Notes: Figures in parentheses ‘[ ]’ indicate the number of commodities involved. In each scenario only the top 50 commodities are considered. Details of the products are given in Annex Tables 20-23.
Ten most important individual trade creation items under each of the liberalization scenarios are listed in Table 8. These items are source of 92.4 per cent of trade creation in simulation 1, 62.7 per cent in simulation 2, 59% in simulation 3, and about 55 per cent in simulation 4. Organic chemicals (HS codes beginning with 29) and electric machinery, equipment and parts (HS codes with 85) appear to be the dominant sources of trade creation under the early harvest programme. In the case of phased elimination of duties, locomotives (HS 86), printed books and newspapers (HS 49), nuclear reactor, boiler and mechanical appliances (HS 84) and ships, boats and floating structures (HS 89) are most important. In simulation 3, HS 84 and HS 29 items overwhelmingly dominate the trade creation effects. Finally, when the sensitive list scenario is considered, the distribution of trade creation by broad commodity groups turn out to be quite diverse. Nevertheless, organic chemicals, iron and steel, mineral fuels, and articles of base metal appear to be important products.
! " # " # $% #
! 0 -!
-! ! 0 -! 0 4 ! ! 4 ! ! 4 ! ! 4 ! !
% ( # $)( &) % &$%% &# # #$) % ( # $
% &$ #% %$%) &# %# %$ ( # $
% ) &$) #% %% $) % $ % )$)#
#
&( % $(# &# &$) % #%% $ ( & # #$
(
27
)
&( ## $ ) % )$ &# # $# # $ (
&( %% $# &# #( ($ ) &# & $ ) % $
&
&(###% $%( &#( % #$ % ( $)& &# (& ($)
%
&( & $% % # #$ % )% $(& # #$%%
% # $& &% (% $% &# ) % $#% &# (& #$((
4 ! : 4 !
% $##: ) $)%: (%$ : (#$ #:
[image:28.612.73.507.71.172.2]
Information on trade diversion by disaggregated commodities is given in Annex Tables 24-27. Based on these tables, Tables 9 summarises the major products of trade diversion and the associated most efficient source countries which are adversely affected by the bilateral FTA deal that allows duty-free access of goods originating in Singapore. It is found that under different situations, supplying countries include both from developed such as the United States, France, Germany and developing countries such as China, Iran, Malaysia, etc.
Table 9: India-Singapore FTA: top 10 products causing trade diversions
early harvest phased elimination in duty phased reduction in duty sensitive list
HS Code Source Country Trade Diversion Effect ($ mill) HS Code Source Country Trade Diversion Effect ($ mill) HS Code Source Country Trade Diversion Effect ($ mill) HS Code Source Country Trade Diversion Effect ($ '000) 1 290250 Saudi
Arabia -14.28 290243 Malaysia -4.37 843143
United
States -2.75 720421
Nether- Lands -2.28 2
290250
United
States -3.47 890110 Cyprus -4.01 843041
United
States -1.10 390210 Saudi
Arabia -1.54 3
880330
United
States -1.90 890190 Norway -2.68 290230
Iran, Islamic
Rep. -0.97 271119
Saudi
Arabia -1.51 4
852990 China -1.21 890110 Panama -2.65 293499 China -0.96 291521 Malaysia -1.24 5
290250
Nether-
lands -1.01 890400 Japan -2.28 290230
Nether-
Lands -0.78 291532
United
States -0.85 6
880330 France -0.92 890190 Panama -2.06 290512
United
States -0.75 845710 Japan -0.79 7
850440 China -0.89 845229 China -1.98 290230
Korea,
Rep. -0.71 720449
United Arab
Emirates -0.79 8
290250 Pakistan -0.77 490700
United
States -1.87 290512
Taiwan,
China -0.60 390720
Korea,
Rep. -0.72 9
291612 Malaysia -0.74 843149
United
States -181 293499 Germany -0.53 720421
United
States -0.72 10
854449 China -0.69 890110 Malta -1.24 390530
United
States -0.51 720449
United
States -0.68
Top 10 as % of Total 54.51% Top 10 as % of Total 27.29% Top 10 as % of Total 21.28% Top 10 as % of Total 13.89%
Notes: ‘Source country’ is the most efficient producing country, export of which is affected by the bilateral preferences extended to Singapore, thereby causing the trade diversion. Description of the HS code can be found in Annex Table 24-27.
28
[image:29.612.67.502.188.421.2]effects under scenario 1 account for 99.81 per cent of all revenues forgone. The corresponding figures for scenario 2, 3, and 4 are respectively 85.36 per cent, 71.63 per cent, and 66.42 per cent. Annex Tables 28-31 also provide the required information on individual disaggregated item’s contribution to the revenues forgone. Table 10 reveals that apart from phased reduction of tariffs (scenario 3), even top 10 revenue-sensitive products have considerable share in lost revenues.
Table 10: India-Singapore FTA - products with largest revenue effects
! 0 -! 7-! !
!
7-!
=! =! =! =!
% ( " %$&) #% " $ &# # "#$&# )( # " $ &
% ) "#$ & &% " #$# % " $ && % ( "($)&
&( %% " $# &% % ")$ &# # " $ )(% ##% "#$##
&& " $ &% # "($&) % #%% " $ && % ( " $ %
&( ## " $ &# #% "($ ) % ( " $ #& % " $%
&(###% " $% % # "($ % ( " $()()# % " $))
% # " $ # #% %% "($ &( &% " $( ) ( ) " $%(
% ) # " $( &#( % "#$## &( " $# # % " $ &
% " $#& & #% " $%( % % " $ & &#( " $((
% % " $ # )% " $)% % " $ &&) % # " $#
4 ! :
!
&): )#: #: #:
[image:29.612.70.568.472.646.2]Note: Description of the HS code can be found in Annex Table 28-31.
Table 11: India-Singapore FTA – import rise of major broad products
HS Code
% increase
from base HS Code
% increase
from base HS Code
% increase
from base HS Code % increase from base
290110 88.12 860900 3223.29 841940 1947.85 870324 5139.95
853190 85.45 210390 1893.42 842649 324.04 851610 2802.93
410799 84.51 570320 1591.69 850220 253.58 741820 2262.51
282540 72.21 730840 928.46 850134 212.26 841581 1712.33
410449 70.54 30613 871.42 842410 191.79 350691 1269.67
851829 47.24 841810 504.56 481840 159.35 761090 1265.67
490600 46.33 841451 502.91 843041 127.71 240120 1132.39
853180 45.91 441520 350.84 842619 126.62 830241 850.01
391110 38.84 900220 318.95 842810 124.13 841583 827.01
291612 37.86 850164 316.75 841989 105.62 721230 620.86
Note: Description of HS codes can be found in Annex Tables.
29
Annex Tables 32-35, Table 11 provides a list of top 10 products under each of the scenarios simulated based on the percentage change in export of individual products at the HS 6-digit level. Singapore’s exports of organic chemicals (HS 29), electric machinery, equipment and parts (HS 85), leather and leather products (HS 41), and inorganic chemicals (HS 28) are likely to have expanded rapidly following the implementation of the early harvest schemes. With the tariff elimination scheme, the Singaporean exports that are expected to benefit most (in terms of percentage increase) are locomotives (HS 86), miscellaneous edible preparations (HS 21), and articles of iron and steel (HS 73). Nuclear reactors, boilers, and mechanical appliances (HS 84) and electric machinery, equipment and parts (HS 85) are predicted to be important Singaporean exports under the phased reduction of tariffs and, to some extent, also under the last scenario of the abolition of sensitive list.
VI. Concluding Remarks
This paper has made an attempt to assess economic impacts of three preferential trading arrangements involving India, namely India-Sri Lanka Free Trade Agreement, South Asian Free Trade Agreement (SAFTA), and India-Sri Lanka Free Trade Arrangement. Based on the nature of various arrangements under each of these preferential trading systems, suitable quantifiable scenarios have been constructed to assess the potential implications. The key variables that have been of interest in quantitative exercise include, trade creation, trade diversion, and net trade effects; overall welfare effects; and the potential implications for tariff revenues. Quantitative assessments in the paper have been undertaken by exploiting a partial equilibrium model and an associated database that provides information on India’s bilateral trade flows at a highly disaggregated level and protective structures as reflected in its tariff schedule.
The results suggest that in each case overall trade effects for India have been positive, i.e. in every case trade creation outweighs trade diversion. This paper has also investigated the sources of trade creation and at the same time has also identified the products causing trade diversion and their sources by rest of the world partners.
This paper provides the evidence of overall positive welfare effects for India in all the scenarios considered – although in some cases the resultant welfare effects turn out to be quite low.
This paper also provides estimates of tariff revenues forgone by India due to preferential treatment given to different partners. These estimates differ quite considerably and the paper has also identified the important revenue-sensitive individual commodities at a highly disaggregated level.
30