Munich Personal RePEc Archive
Technological regimes, Schumpeterian
patterns of innovation and firm level
productivity growth
Castellacci, Fulvio and Zheng, Jinghai
2010
Technological Regimes,
Schumpeterian Patterns of Innovation
and Firm Level Productivity Growth
Fulvio Castellacci and Jinghai Zheng
Department of International Economics,
Norwegian Institute of International Affairs (NUPI), Oslo, Norway
Abstract
The paper investigates the relationships between technological regimes and firm-level productivity performance, and it explores how such a relationship differs in different Schumpeterian patterns of innovation. The analysis makes use of a rich dataset containing data on innovation and other economic characteristics of a large representative sample of Norwegian firms in manufacturing and service industries for the period 1998-2004. First, we decompose TFP growth into technical progress and efficiency changes by means of data envelopment analysis. We then estimate an empirical model that relates these two productivity components to the characteristics of technological regimes and a set of other firm-specific factors. The results indicate that: (1) TFP growth has mainly been achieved through technical progress, while technical efficiency has on average decreased; (2) the characteristics of technological regimes are important determinants of firm-level productivity growth, but their impacts on technical progress are different from the effects on efficiency change; (3) the estimated model works differently in the two Schumpeterian regimes. Technical progress has been more dynamic in Schumpeter Mark II industries, while efficiency change has been more important in Schumpeter Mark I markets.
1. Introduction
The empirical literature studying the relationships between innovation and the
productivity performance of firms represents by now a huge and important body of
applied research. The field has recently experienced a surge of interest due to the
increased availability of firm-level data for a large number of countries.
Some of these firm-level datasets, such as those from the Community Innovation
Survey (CIS) in Europe, contain a rich variety of information on the innovative
activities and strategies of thousands of enterprises, making it possible to significantly
refine the measurement of inputs and outputs of the innovative process, as well as to
include a variety of other related factors.
Recent microeconometric studies on the innovation-productivity link have
increasingly made use of innovation survey data, and provided fresh empirical
evidence on the relationships between innovation input and output, on the one hand,
and between output and productivity, on the other (Crepon et al., 1998; Hall and
Mairesse, 2006).
In our view, a crucial proposition that may be useful to refine this type of empirical
approach is that the relationship between innovation and productivity may have a well
distinct nature in different types of markets and industrial sectors. In order to refine
our understanding of the innovation-productivity link, we need a theoretical approach
that takes into account the sector-specific nature of technological change (Dosi, 1988;
Malerba, 2002; Laursen and Meliciani, 2002).
The general idea we put forward is that, since firms in different industries of the
economy face a distinct set of opportunities, constraints and conditions, these
industry-specific characteristics play an important role to explain the enterprises’
of Castellacci (2007), we argue that firm-level productivity growth is related to the
characteristics that define the technological regime in which the enterprise operates
(Malerba and Montobbio, 2003; Park and Lee, 2006).
More specifically, we explore the idea that the sources and mechanisms of
productivity growth may be distinct in different types of sectoral market structure and
industrial dynamics conditions (Foster et al., 1998; Santarelli and Vivarelli, 2007). In
a Schumpeter Mark II regime, the oligopolistic and concentrated nature of the market
may make large incumbent innovators the dominant carriers of productivity growth.
In contrast, the dynamics of productivity in a Schumpeter Mark I pattern may be led
by an intense and turbulent process of competition where new innovators are more
productive than the exit firms they replace.
In exploring this main idea, it is crucial to distinguish and measure different sources
of productivity growth. We make use of frontier production function methods (data
envelopment analysis) to decompose the growth of total factor productivity (TFP) into
two distinct components: technical progress and technical efficiency (Färe et al. 1994;
Perelman, 1995; Zheng et al., 2003). The former is associated with changes in the
best-practice production frontier, whereas the latter with other productivity changes,
such as learning by doing, improved managerial practices, and change in the
efficiency with which an existing technology is applied.
After having identified and measured these two distinct components of TFP growth,
we will investigate (1) the role of technological regime-related factors to explain their
dynamics, and (2) how the relationship between technological regimes, technical
progress and efficiency change differs in the two Schumpeterian patterns of
The econometric study makes use of firm-level data for the Norwegian economy. The
rich dataset we make use of combines together information from three different
sources. Data for the estimation and decomposition of TFP are taken from a time
series database that provides information on several thousands of Norwegian
enterprises for the period 1998-2004. Data on innovative activities are from the Third
and the Fourth Community Innovation Survey for Norway, referring to the 1998-2000
(CIS3) and 2002-2004 (CIS4) periods respectively. These three data sources all
provide information on a very large sample of Norwegian enterprises in all
manufacturing and service industries.
The paper follows this outline. Section 2 briefly reviews the empirical literature that
provides the background and foundation for our study. Section 3 puts forward our
theoretical model and main hypotheses. Section 4 presents the results of an
econometric estimation of TFP growth, which identifies the separate contribution of
technical progress and efficiency changes to the overall productivity dynamics of
Norwegian firms. Section 5 shifts the focus to the determinants of these two
components, and estimates an empirical model that tries to explain them by means of
a set of variables measuring technological regimes and other firm-specific
characteristics. Section 6 summarizes the results and concludes the paper.
2. The literature on innovation and firm-level productivity growth
In recent years, thanks to the increased availability and diffusion of large enterprise
datasets, there has been a surge of interest in the measurement of productivity growth
and the study of its determinants at the firm level (Caves, 1998; Foster et al., 1998;
The measurement of firms’ productivity has for a long time been an engaging field of
applied research within industrial economics, which has produced a variety of models
and techniques to estimate TFP and its dynamics (Heshmati, 2003). One interesting
approach, in particular, has made use of frontier production function methods (e.g.
data envelopment analysis) to decompose the growth of TFP into two distinct
components, namely technical progress and technical efficiency (Nishimizu and Page,
1982; Färe et al. 1994).
Technical progress is associated with changes in the best-practice production frontier
of an industry, i.e. changes that are led by the introduction of a technology that is new
to a sector. By contrast, the growth of technical efficiency is related to improvements
in the ability with which firms are able to make an efficient use of already existing
techniques (i.e. previously introduced by other enterprises in the same industry), and
may be associated to diverse sources of productivity change such as, e.g., learning by
doing and improved managerial practices. The rationale and intuition of this method
are discussed in further details in section 4 below.
Besides decomposing the dynamics of TFP, this empirical literature has investigated
the determinants of these two distinct components, and tried to relate them to a variety
of characteristics of the firms and of the institutional and market conditions in which
they operate (e.g. Zheng et al., 1998; Zheng et al., 2003).
To the best of our knowledge, though, this type of firm-level studies has not yet
analysed the relationships between the innovative activities and strategies of
enterprises, on the one hand, and their performance in terms of technical progress and
technical efficiency. Does innovation increase productivity by pushing the
technological frontier further (technical progress), or by improving the efficiency with
innovative activities (strategies, expenditures) are more important to achieve increases
in each of the two components? These interesting questions, still unexplored in the
firm-level literature, motivate our study.
Perelman (1995) previously investigated these issues by focusing on the
industry-level of analysis. His empirical analysis estimates TFP components for eight sectors
and 11 OECD countries, and then studies the link between the productivity dynamics
and some key explanatory factors among which the R&D intensity of each industry.1
An interesting finding of this paper is that the R&D variable is shown to be positively
related to the technical progress component of TFP and negatively related to the
efficiency component. In the cross-country setting investigated by Perelman (1995),
the interpretation of this finding is that industries that invest more actively in R&D
activities are those that are closer to the world technology frontier and that
continuously push it further. Our research questions and empirical approach are quite
similar to Perelman’s, but the important difference is that we shift the focus of the
analysis to the firm-level and explicitly investigate – within each sector – the
relationships between the innovative activities and strategies of enterprises, on the one
hand, and the growth of their technical change and efficiency, on the other.
In approaching this research issue, the large empirical literature studying the
relationship between innovation and productivity growth provides us with a set of
important insights and well-established results, which are useful to give a more solid
foundation to our study. Applied studies on the impact of R&D activities on the
dynamics of productivity represent by now a huge and important body of empirical
research. The standard approach is to investigate the empirical relationship between
the growth of total factor productivity, on the one hand, and R&D expenditures and
1
R&D spillovers, on the other (Griliches, 1979; Los and Verspagen, 2004; Wieser,
2005).
Two recent developments in the innovation-productivity literature have particularly
attracted the attention of scholars in the last few years. The first is the greater
availability of innovation enterprise-level data for a large number of countries. Some
of these firm-level datasets, such as those from the Community Innovation Survey
(CIS) in Europe, contain a rich variety of information on the innovative activities and
strategies of thousands of enterprises, making it possible to significantly refine the
measurement of inputs and outputs of the innovative process and to include a variety
of other related factors.
A second interesting development has been the progressive refinement of the
traditional R&D productivity model. The current mainstream approach analyses
innovation survey data by making use of the so-called CDM model (named after the
authors of the seminal paper in this tradition, Crepon, Duguet and Mairesse, 1998).
The CDM empirical model emphasizes the distinction between inputs and outputs of
the innovative process, and points out that it is the innovative output that affects the
productivity performance of firms, rather than their R&D activities (inputs) as
commonly assumed by previous works.
This CDM type of studies typically estimates three equations: one for the
determinants of innovation inputs (e.g. measured by total innovation intensity), one
for the link between innovation input and output (measured by turnover from new
products), and one for the impact of innovation output on productivity (labour
productivity or TFP).
Besides the conceptual distinction between these different stages of the innovative
possible problems created by the existence of sample selection bias in the context of
firm-level data from innovation surveys. This problem typically arises because many
of the questions on innovation strategies and activities in the CIS survey are only
answered by firms that are innovative, whereas non-innovative enterprises skip those
parts of the questionnaire that are not relevant for them. CDM econometric models
control for and correct this type of selection-bias (e.g. by means of a generalized Tobit
model, or the Heckman two-step procedure) and estimate an additional equation for
the firms’ propensity to innovate.
The results of these econometric studies are largely consistent with each other and
provide fresh empirical evidence on the existence of a positive link between
innovation input and output, on the one hand, and innovation output and productivity,
on the other. These relationships have been found to hold in large CIS-based samples
of firms in various European countries (Cainelli et al., 2006; Crespi et al., 2006;
Duguet, 2006; Hall and Mairesse, 2006; Lööf and Heshmati, 2006; Parisi et al., 2006;
Van Leuwen and Klomp, 2006). A few studies with availability of CIS data for more
than one country have also presented comparative exercises (e.g. pooled regressions
with data for different economies) that seem to indicate that the estimated relationship
between input, output and productivity is quite similar across different countries in
Europe (Lööf et al., 2001; Janz et al., 2003; Griffith et al., 2006).
Despite the merits of this recent approach, it is however also important to point out
one possible limitation of it. From a theoretical point of view, this
input-output-performance approach is rooted in a linear understanding of the innovative process
that, despite its appeal and analytical power, does not provide a realistic
conceptualisation of the relationships and complex feedback mechanisms between the
characteristics of the market in which they operate. Industry-specific factors, be they
technological or economic, exert a considerable influence on the innovative strategies,
opportunities and constrains faced by enterprises in different markets (Von
Tunzelmann et al., 2008). The relationship between innovation and productivity, in
our view, may have a well distinct nature in different types of markets and industrial
sectors. In order to refine our understanding of the innovation-productivity link, we
need a theoretical approach that takes into account the sector-specific nature of
technological change.2
3. Theoretical model and main hypotheses
The model that we make use of is based on the notion of technological regime. A
technological regime may be defined as the technological environment in which
innovative activities take place in each sector of the economy (Nelson and Winter,
1982; Winter, 1984 and 2006). A set of industry-specific characteristics defines such a
technological environment, providing opportunities and constraints for firms that seek
to undertake innovative activities. These industry-specific features refer in particular
to the following main characteristics (Cohen and Levin, 1989; Malerba and Orsenigo,
1995; Lee and Lim, 2001).3
2
Another possible drawback of the CDM model approach refers more specifically to the empirical strategy that is commonly adopted to investigate the link between innovation and productivity. Despite the conceptual relevance of the distinction between innovation input and output, it is admittedly difficult to empirically estimate the relationship between them in the context of cross-sectional data such as those based on the CIS surveys. The lack of a reasonable time lag between input, output and productivity performance challenges the validity of this type of measurement exercises, which would arguably require a longer time span or a panel comprising different waves of the CIS survey. This type of refinements, based on the analysis of CIS panel data, is now possible thanks to the increasing availability of data from different waves of the innovation surveys, and it currently represents an important new avenue of research in the CDM model tradition.
3
Cumulativeness conditions. These define the extent to which technological activities
and performance build upon the accumulated stock of knowledge and technical
competencies of each firm (Cefis and Orsenigo, 2001).
Level of technological opportunities. Technological opportunities are commonly
defined as the likelihood that technological activities and expenditures lead to an
innovative output, i.e. the pace and intensity of technological progress (Breschi et al.,
2000). Innovative intensity is achieved, in addition to the internal R&D investments
of a firm, also by the acquisition of external knowledge from other actors, e.g.
expenditures for the acquisition of machinery, software and R&D services from
specialized consultants.
External sources of opportunities. A complementary aspect is the ability of firms to
recognize, imitate and exploit the pool of advanced knowledge that is available in the
economic environment. External sources of opportunities may be used when firms are
able to engage in interactions and cooperations with other agents in the innovation
system, such as their suppliers, users, competitors, private R&D labs, Universities and
other public research institutes (Laursen and Meliciani, 2002; Reichstein and Salter,
2006).
Appropriability conditions. Firms typically make use of a variety of instruments to
protect the results of their innovative activities from imitation (Dosi et al., 2006).
Appropriability means can roughly be distinguished into formal (e.g. patents and
trademarks) and informal means (e.g. process secrecy and know-how, and the
In a nutshell, the main insight of this approach is that the innovative strategies and
activities of enterprises greatly vary across sectors because industries differ
fundamentally in terms of the properties of their technological regimes (Malerba and
Montobbio, 2003; Park and Lee, 2006). Our theoretical approach is rooted in this
recent line of research, and tries to bring it one step further.
The general idea we put forward is that, since firms in different sectors of the
economy face a distinct set of opportunities, constraints and conditions, these
industry-specific characteristics play an important role to explain the enterprises’
technological and productivity performance.
In particular, in line with the recent work of Castellacci (2007), we argue that the
growth of productivity of a firm is related to the characteristics that define the
technological regime in which the enterprise operates. More specifically, we may
expect the productivity performance of an enterprise to be related to the
cumulativeness of its innovative process, its level of technological opportunity, its
ability to exploit external sources of opportunity, and the effectiveness of its
appropriability strategy.
Hypothesis 1. The characteristics of technological regimes are important
determinants of the productivity growth of firms.
This general hypothesis may be sharpened and refined by looking at two interrelated
and more specific aspects. The first is the distinction between the two distinct sources
of productivity growth pointed out in the previous section, i.e. technical progress and
technological regimes may have different impacts on these two components of TFP
growth.
In particular, since the technical progress component measures upper shifts in the
technological frontier due to the introduction of techniques that were not previously
available in an industry, we may expect it to be related to the degree of
cumulativeness of technological change and to the level of technological opportunities
(both aspects reflecting firms’ commitment to, and intensity of, internal R&D
activities; see also Perelman, 1995). By contrast, the efficiency change component,
which accounts for improvements in the ability with which firms are able to make an
efficient use of already existing technologies, may arguably be related to firms’
efforts to exploit external sources of knowledge (e.g. R&D purchase, consultancy
services, etc.) rather than to their capability to internally create radically new
technologies. In short, we put forward the following
Hypothesis 2. The impacts of technological regime-related factors on technical
progress are different from the effects on efficiency change.
A second aspect that it is important to look at in order to sharpen our theory is the
type of market structure and industrial dynamics that characterize each industry. The
empirical literature on technological regimes has previously investigated the
relationships between technological regimes and the characteristics of market
structure and industrial dynamics in different sectors of the economy. Several recent
works in this field have in particular focused on differences in terms of concentration
or stability in the population of innovative firms (Malerba and Orsenigo, 1995 and
1996; Breschi et al., 2000; Van Dijk, 2000).
These studies have shown that the properties of technological regimes may explain
the existence of the innovation patterns originally pointed out by Schumpeter (1934
and 1943). The first, the Schumpeter Mark I, is characterized by high ease of entry in
the market, low concentration of innovative activity, and a turbulent population of
new and old innovators with a significant role played by small firms. Creative
destruction (Schumpeter, 1934) is the main feature of this regime (also defined
‘entrepreneurial’ or ‘widening’). The second, the Schumpeter Mark II pattern, is
characterized by high barriers to entry for new innovators, high concentration of
innovative activity, and a stable population mainly formed by large and
well-established firms. Creative accumulation (Schumpeter, 1943) is the distinctive feature
of such a regime, also defined ‘routinized’ or ‘deepening’.
The stylised distinction between Schumpeter Mark I and II and its relationship to the
properties of technological regimes suggest a further refinement of our framework. It
is reasonable to conceive, we argue, that the relationship between technological
regime-related factors and productivity growth that our model explores will be
different in the two Schumpeterian patterns of innovation. The reason is that the
mechanism that links innovative activities, technical progress and efficiency changes
may indeed work differently in distinct types of market structures.
In the Schumpeter Mark II regime, high cumulativeness and appropriability
conditions create strong technological entry barriers for new innovators. Productivity
growth in this type of market may be assumed to be, to a large extent, the result of a
continuous process of knowledge accumulation by well-established oligopolistic
economies of scale and the persistence and cumulativeness of innovative activities.
Incumbents continuously push the technological frontier further, so that, on average, it
is technical progress that represents the dominant source of productivity dynamics for
the industry.
In a Schumpeter Mark I pattern, on the other hand, low cumulativeness and
appropriability conditions tend to facilitate the continuous entry of new innovative
firms. In this context, productivity growth is more likely to be related to the process of
creative destruction that continuously characterizes a turbulent market, where new
innovators are more productive than the exit firms they replace. In a highly
competitive market, the ability of firms to make efficient use of rapidly changing
production techniques becomes a crucial factor. For this type of industry, therefore,
efficiency improvements may be expected to constitute a more relevant mechanism of
productivity growth.
Hypothesis 3. The relationship between technological regimes, technical progress and
efficiency changes works differently in different Schumpeterian patterns of
innovation. In particular:
• Hypothesis 3a. Technical progress is greater in the Schumpeter Mark II than in
the Schumpeter Mark I pattern.
• Hypothesis 3b. Efficiency change is greater in the Schumpeter Mark I than in the
Schumpeter Mark II pattern.4
4
4. A decomposition of TFP growth
The first part of our empirical investigation focuses on total factor productivity and
decomposes its growth by means of data envelopment analysis. The results of this
decomposition exercise will then be used in the next section as dependent variable in
a regression analysis that studies the link between innovation and productivity
performance.
We make use of frontier production function methods to study the dynamics of
productivity of Norwegian firms. This first part of the analysis is based on the
Tidsseriebase dataset, containing information on value added, labour and capital
investments (deflated by means of industry-level indexes) for a large sample of
Norwegian enterprises in all manufacturing and service industries for the period
1998-2004. The number of observations in the dataset varies between around 4000 and
6000 firms for each of the years in the time span.
The Malmquist Index model is based on the non-parametric deterministic production
frontiers estimated via data envelopment analysis (DEA; Färe et al. 1994). This
approach allows decomposing the dynamics of TFP into technical progress and
technical efficiency change. The former is associated with changes in the best-practice
production frontier, and the latter with other productivity changes, such as learning by
doing, improved managerial practices, and change in the efficiency with which an
existing technology is applied.
The main intuition of the method is the following.5 For each industry, the DEA
methodology follows the following steps: (1) it identifies the best-practice firms, i.e.
the enterprises that have the highest output (value added) for any given level of input
(capital and labour); these best-practice firms define the empirical production frontier
of the industry (in year t); (2) the DEA then calculates the level of technical efficiency
for all firms in the industry, which is also a measure of how distant an enterprise is
from the best-practice frontier of its sector (i.e. a measure of the technology-gap); (3)
by comparing the production frontier and the technical efficiency levels of each firm
between year t and t+1, it is then possible to calculate the growth rate of technical
progress (i.e. shifts in the empirical production frontier) and the growth rate of
technical efficiency (i.e. the extent to which a firm has got closer to the frontier over
time). The overall growth rate of TFP (Malmquist index) is defined as the geometric
average of these two components.
The DEA represents a useful method to decompose the dynamics of total factor
productivity. In the context of the analysis of innovation and technological change,
this empirical methodology may be particularly interesting for the following reasons.
First, at the firm-level, it provides a measure of the extent to which each enterprise
has been able to introduce technologies that are new to its market (thus pushing the
technological frontier further) and/or making a more efficient use of techniques
already available in the industry (i.e. previously introduced by other firms). Secondly,
at the industry-level, aggregating this type of firm dynamics gives an interesting
indication of the overall productivity trajectory of each sector, i.e. whether it has been
characterized, on average, by shifts in the technological frontier or rather by a process
5
of catching up where many enterprises have improved their technical efficiency over
time.
Thirdly, from a theoretical point of view, the DEA method is rather eclectic and
flexible, since it does not impose any strong a-priori assumptions on the data. In fact,
DEA is a non-parametric method that does not assume any specific functional form
for the production function. Quite on the contrary, by distinguishing the most
productive from the less efficient firms, the technique lets the data speak, and it
explicitly recognizes firm heterogeneity as a major characterizing feature of each
industry. Thus, while the distinction between shifts in the production frontier
(technical progress) versus movements towards the frontier (efficiency change) was
originally rooted in a mainstream production function approach, its application within
a non-parametric DEA context is actually quite consistent with an evolutionary
economic environment where heterogeneous firms continuously compete by trying to
imitate existing technologies and by introducing new ones.6 Besides these three
advantages of the method, there are also some possible drawbacks. We discuss these
econometric issues in the Appendix.
We have applied this productivity decomposition method to our large sample of
Norwegian enterprises in all manufacturing and service industries for the period
1998-2004. First we have run the DEA for each industry (defined at the 3-digit level) and
6
each year; then, we have calculated the annual growth rates of TFP and of its two
components. Table 1 reports the results of these estimations for the two sub-periods
1998-2001 and 2002-2004, i.e. the dynamics of TFP, and its decomposition into the
technical progress and the efficiency change components. The various rows of the
table present averages by sector of firm-level productivity growth.7 For interpreting
these results, it should be noticed that values greater (lower) than 1 indicate positive
(negative) growth of TFP (and of its two components).
< Table 1 here >
Looking at the Malmquist TFP index, the table indicates that the growth of total factor
productivity has been positive for most of the sectors. The country average is
significantly higher in the second period (10.16%) than in the first one (around
4.36%). The sectors that have experienced the most rapid pace of TFP growth are
quite diverse, and belong to both manufacturing and services and to both high- and
medium-low-tech branches of the economy: food and beverages, leather and
footwear, basic metals, motor vehicles, other transport equipment, recycling, radio
and TV, wholesale trade, air transport and telecommunication. This would suggest
that the process of technological transformation has not only played a relevant role for
the most technologically advanced branches of the economy, but also for some of the
mature sectors that have traditionally constituted a stronghold of the Norwegian
industrial system (Von Tunzelmann and Acha, 2005).
7
The table reports the average TFP growth for each industry at the 2-digit level in order to save some space, although, as specified above, our DEA estimations have been carried out for each 3-digit level
Shifting the focus to the two components of TFP growth, the table suggests that the
dynamic pattern of productivity has mostly been obtained, in both sub-periods, by
means of technical progress rather than through improvements in technical efficiency.
On average, the technical progress component has grown by nearly 18% in the first
and 26% in the second period. The growth rate has been particularly high for
industries such as electrical, radio and TV, furniture, recycling, sea transport,
telecommunication, and computing and software. These are industries that have
experienced a high pace of technical progress accompanied by a significant decrease
(negative growth) of the efficiency change component.8
Technical efficiency has on average decreased by nearly 8% in the first period and 7%
in the second. Different sectors have however contributed quite differently to the
negative average performance of the efficiency change component, and some
industries have indeed experienced efficiency increases in at least one of the two
sub-periods (e.g. mining and quarrying, food and beverages, textiles, leather and footwear,
basic metals, electrical, motor vehicles, other transport equipment, wholesale trade,
air transport, telecommunication).
Summing up, our decomposition exercise indicates that in the period 1998-2004: (1)
TFP growth has mostly been obtained through technical progress, whereas technical
efficiency has on average decreased; (2) behind this aggregate pattern, the
performance of different sectors (and of firms in different industries) has been quite
diverse. What are the factors that may explain the diverging dynamics followed by
technical progress and efficiency, and to what extent can this be accounted for by the
8
characteristics of technological regimes and the related patterns of market structure
and industrial dynamics that characterize different sectors?
5. The link between innovation, technical progress and efficiency
In order to answer this question, the second part of our empirical analysis makes use
of innovation data and merges them with the TFP data discussed in the previous
section. Data on innovative activities are from the Third and the Fourth Community
Innovation Survey for Norway, referring to the 1998-2000 (CIS3) and 2002-2004
(CIS4) periods respectively. CIS data provide information on a large and
representative sample of Norwegian enterprises in all manufacturing and service
industries. By merging the CIS3, CIS4 and the TFP data previously estimated from
the Tidsseriebase dataset, we are left with a two-period cross-sectional sample,
containing around 1000 firms in the first (CIS3) and 1650 firms in the second period
(CIS4).
5.1 CIS data, indicators and descriptive analysis
We make use of the following indicators, all of which are available in both periods
and have identical definition in the two waves of the innovation survey.
Firm-specific factors
• Employment (log): Number of employees (log), a standard measure of firm size.
• Product life: a variable indicating the average length of the firm’s product cycle.
• Export intensity: export divided by total turnover, in 2001 and 2004.
• Market location: a categorical variable that indicates whether a firm sells its
products and services in local, national, European or other international markets.
• TFP level: level of total factor productivity, average of the period.
Technological regimes factors
• Cumulativeness: Continuous R&D: a dummy variable that indicates whether a
firm is continuously engaged in R&D activities (rather than being an occasional
innovator).
• Level of technological opportunities: We make use of three indicators to
measure the intensity of a firm internal R&D effort as well as its acquisition of
external R&D and other types of specialized knowledge. (1) R&D intensity
(internal R&D expenditures, share of total turnover); (2) Other external
knowledge (acquisition of software and other external knowledge, share of total
innovation costs); (3) R&D purchase (expenditures for the purchase of R&D,
• External sources of opportunities: a set of dummy variables indicating whether
a firm regards the following actors as important sources of information for their
technological activities: other sources in the same firm (S-Internal); other firms in
the same group (S-Group); suppliers; users; competitors; consultants; private
R&D labs; Universities; public research institutes.
• Appropriability conditions: Two dummy variables that indicate whether each
firm has made use of the following (formal and informal) appropriability modes:
trademark; patent; secrecy; complex design.
Other innovation-related variables
• Effects of innovation: Three dummy variables indicating whether each firm
states that technological change has led to the following effects and results:
increasing market shares or entering new markets (E-Market orientation);
increasing the productive capacity (E-Productive capacity); decreasing the labour
costs (E-Labour costs).
• Hampering factors: A set of dummy variables indicating whether a firm
considers the following factors as important obstacles to its innovative activities:
high costs (H-Costs); lack of qualified personnel (H-Personnel); lack of
information on technology (H-TechInfo); lack of other information (H-OtherInfo).
Table 2 presents some descriptive evidence on the variables measuring firm-specific
the CIS3 and the CIS4 dataset. As customary in this type of analysis based on CIS
data, the table reports these descriptive statistics separately for the innovative and
non-innovative sample (the distinction is applied by means of an “innovator dummy”
variable that takes value 0 if a firm has had no innovation costs at all, and 1
otherwise).
The differences between the innovative and non-innovative samples are evident in
both periods, and their statistical significance is shown through the results of a
non-parametric Mann-Whitney U test. In particular, firms in the innovative sample are
characterized by higher TFP levels, greater firm size and group structure, shorter
product life cycle, higher export intensity and greater relevance of international
commercialisation markets.
This descriptive evidence, which is consistent with what previous studies based on
CIS firm-level data have found for other countries, provides one first relevant
indication for the econometric study that we intend to undertake. Given the significant
differences between innovative and non-innovative firms in our sample, selection-bias
may occur in our econometric estimations. This is due to the fact that in the CIS
questionnaire non-innovative enterprises do not answer the questions on innovative
activities, strategies and performance, and are therefore excluded from the regressions
studying the links between innovation and productivity growth. For this reason, in
order to take into account this type of sample selection problem, the estimations that
we will present make use of a Heckman two-step procedure, as standard in the CDM
econometric approach (see section 2).
Next, we present some descriptive evidence on the differences between the
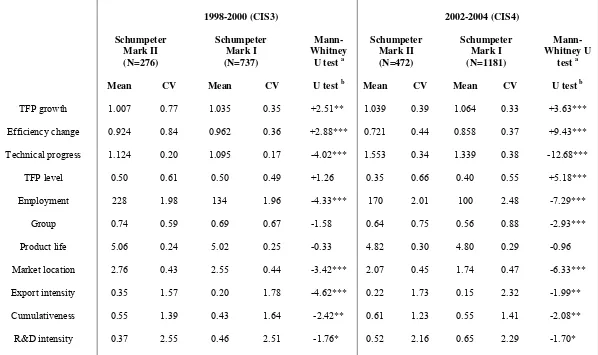
characteristics of firms in distinct Schumpeterian regimes. Table 3 reports the mean
and the coefficient of variation (CV) of firms in the two distinct types of market
structure and industrial dynamics that are typically labelled Schumpeter Mark I and
Schumpeter Mark II.
The distinction between Schumpeter Mark I and II regimes, while clear from a
conceptual point of view, is not easy to apply in empirical analyses, since there exist
no well-established criteria to decide whether each sector of the standard industrial
classification belongs to one or the other regime. Previous empirical studies in the
field, however, have carefully analysed this aspect and provided a list of industries
belonging to each Schumpeterian regime (Malerba and Orsenigo, 1995, p. 58; Breschi
et al., 2000, p. 400; Van Dijk, 2000, pp. 192-194; Marsili and Verspagen, 2002, pp.
814-815; Castellacci, 2008b). In addition, the recent paper by Castellacci et al. (2009)
has investigated this issue by means of a factor and cluster analysis exercise applied to
a large number of indicators on market structure and industrial dynamics of
Norwegian firms in all manufacturing and service industries. Our division of sectors
into Schumpeter Mark I and II regimes follows therefore these previous empirical
works.9
For both periods, table 3 reports the results of a non-parametric Mann-Whitney U test
that investigates the differences between firms in the two Schumpeterian regimes. The
test confirms that enterprises differ significantly when they operate in distinct market
and industrial dynamics conditions. Firms in the Schumpeter Mark II pattern have on
9
average higher R&D intensity and greater cumulativeness of technological change,
and they also tend to be larger and more oriented to international markets.
While this confirms the basic characteristics of the Schumpeter Mark I and II
distinction, a more novel indication is provided by the analysis of their differences
with respect to the variables measuring productivity dynamics. The technical progress
component of TFP growth proves to be significantly more dynamic for firms in the
Schumpeter Mark II regime, whereas the efficiency change component is higher for
enterprises in the Schumpeter Mark I type of markets. Considering the joint effects of
these two components of productivity, the growth of TFP has been slightly larger for
firms in the Schumpeter Mark I than in the Schumpeter Mark II pattern (3.5% against
0.7%, and 6.4% versus 3.9%).
This finding is, in our view, quite interesting, and it provides empirical support for the
third hypothesis that we have previously put forward (see section 3, hypotheses 3a
and 3b). Our interpretation of this result is that the mechanism of productivity growth
differs in the two Schumpeterian regimes. While Schumpeter Mark II markets are
characterized by an oligopolistic structure where large incumbent innovators
continuously and cumulatively push the technological frontier further (technical
progress), firms in Schumpeter Mark I industries must devote a significant effort to
make an efficient use of already available techniques (efficiency change), which is a
crucial requirement to survive in competitive and turbulent markets.
5.2 Model specification and estimation results
In the analysis of the links between innovation and productivity growth, we employ a
model specification and estimation strategy able to take into account the two issues
highlighted by the descriptive evidence presented in section 5.1. The first, the possible
problem of selection-bias, is tackled by making use of the Heckman two-step
methodology. The second, the differences between firms in the Schumpeter Mark I
and Mark II patterns, is taken into account by estimating a piecewise linear regression
version of the model (i.e. by including constant and slope dummies to control for
differences among the two regimes).
The Heckman two-step estimation method corrects for the possible presence of
selection-bias that is caused by the exclusion of non-innovative firms (which, as
previously shown, are significantly different from enterprises in the innovative
sample). In line with the CDM model approach (see section 2), the first step of the
procedure estimates a selection equation, which investigates the factors explaining the
probability that a firm is an innovator. The second step studies the links between
innovation and productivity growth, including, among the other regressors, also the
inverse Mills ratio that corrects for the sample selection bias.
The dependent variable in the selection equation is an “innovator dummy” variable
(taking value 0 if a firm has had no innovation costs at all, and 1 otherwise). The
explanatory factors are firm-specific indicators that are typically used in recent CDM
applied works (Hall and Mairesse, 2006). Nearly all of these factors turn out to be
significant in the first-step regression presented in the tables. The probability of being
an innovator increases with firm size, its group structure, its international market
orientation, and it decreases with the length of the product life (suggesting that the
the probability of being an innovator is positively related to the four dummy variables
measuring different types of hampering factors in the innovative process, i.e. high
costs, lack of qualified personnel, lack of technical information or other types of
information. The positive sign of this estimated relationship is not surprising and it is
consistent with previous works, suggesting that innovative firms have a greater
awareness of the main factors that hamper their innovative activities.
The second-step equation studies the relationships between innovation and the two
distinct components of TFP growth. We therefore estimate two distinct (second-step)
equations. The first relates the growth of technical progress to the set of explanatory
variables that have been presented in section 5.1, namely the characteristics of
technological regimes and a set of other firm-specific factors. The second equation
makes use of the same set of explanatory variables to explore their impact on the
growth of efficiency.
Our choice of including the same set of explanatory variables in the two (second-step)
equations may be justified on the following grounds. In principle, there is no reason to
assume that the same factors will explain equally well both technical progress and
efficiency change, and our hypothesis 2 does in fact argue that we should expect the
technological regimes variables to have distinct effects on the two components of
productivity growth. However, there exists no clear prior knowledge, i.e. previous
analytical models or empirical results, indicating what type of innovative activities
(strategies, expenditures) may be more important to explain one productivity
component or the other. Therefore, in an exploratory fashion, we include the same set
of explanatory variables in the two equations in order to see whether there is any
important difference in the working of the technological regime model for the two
For each of these two equations, we estimate three different specifications: the first
includes dummies for all manufacturing and service industries; the second includes,
instead of the whole set of industry dummies, a constant dummy for firms in
Schumpeter Mark II sectors; the third specification includes, in addition, a set of slope
dummies for enterprises in Schumpeter Mark II sectors.10 All the regressions also
include a time dummy that controls for differences between the two sub-periods.
Results for the determinants of technical progress are presented in table 4, whereas
those for efficiency change are reported in table 5.
Table 4 provides basic support for our technological regime model, and indicates that
the statistical precision of many of the estimated coefficients is higher in the versions
of the model that control for differences between the two Schumpeterian patterns of
innovation (reported in the last two columns). Among the firm-specific factors,
technical progress is positively related to firm size, the ‘part of a group’ dummy
variable (in the Schumpeter Mark II), and the international location of markets (only
in the Schumpeter Mark I). It is instead negatively related to the length of the product
life, which has a much stronger effect in the Schumpeter Mark II than in the Mark I
pattern.
Besides, the level of TFP turns out to have a high negative estimated coefficient, and
this inverse relationship between TFP level and technical progress appears to be even
more pronounced in the Schumpeter Mark II regime. A possible interpretation of this
finding may point to the existence of a (short-run) trade-off between the efforts and
10
investments that are necessary for searching for radically new technologies, on the
one hand, and the achievement of technical efficiency, on the other. Enterprises that
devote substantial efforts to the introduction of technical progress may find it harder
to achieve a full exploitation of other advanced techniques already available in the
market (e.g. because they focus on internal rather than external opportunity sources).
Relatedly, the negative estimated relationship between TFP level and technical
progress does also indicate that it is not always the same best-practice firms that
introduce new technologies; enterprises below the frontier do also manage to catch up
and shift the industry frontier over time (Aghion et al., 2005). This is more clearly the
case in the Schumpeter Mark II regime, our results indicate, since this is a type of
markets where oligopolistic innovators (be they best-practice or below the frontier)
compete with each other by continuously introducing new technologies.
Shifting the focus to the technological regime explanatory variables, we observe that
the coefficient of the cumulativeness dummy variable is positive, as expected, but
when we control for differences between the Schumpeter Mark I and II, it turns out to
be negative for the latter. Regarding the variables measuring the levels of
technological opportunity, the R&D intensity turns out to be positive, and the variable
measuring the acquisition of software and other external knowledge has a quite strong
positive effect on technical progress.11 Among the external sources of opportunity
dummy variables, only internal sources and competitors on the same market have a
significant estimated coefficient (in at least some of the regressions). The dummies
measuring formal and informal appropriability means are instead not significant at
conventional levels.
11
The last group of regressors measure other aspects of the innovative process, such as
hampering factors and effects of innovation. These variables provide some additional
interesting indications on the nature and performance of innovative activities of
Norwegian firms. The lack of qualified personnel is negatively related to productivity
growth, while the lack of technical information is negatively (positively) related to it
in the Schumpeter Mark II (Mark I) regime. On the other hand, the variables
measuring the firm ability to increase market shares and entering new markets and the
expansion of its productive capacity have both a positive effect on technical progress.
Last, the time dummy confirms that technical progress has been stronger in the second
than in the first period (see section 4, table 1), while the Schumpeter Mark II constant
dummy indicates that technical progress has been significantly more rapid for firms in
the Schumpeter Mark II than in the Schumpeter Mark I. This provides further
empirical support for the third hypothesis put forward in section 3 (see hypothesis 3a).
< Table 4 here >
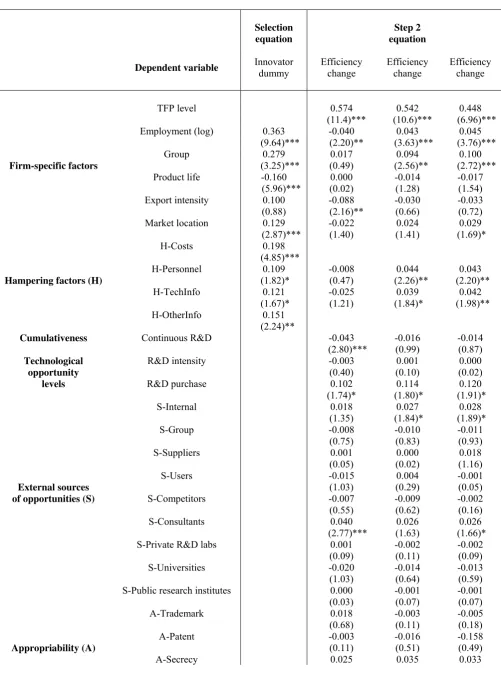
Table 5 presents the results of the estimations exploring the determinants of the
efficiency change component of TFP growth. First, looking at the set of firm-specific
indicators, efficiency improvements are positively related to firm size, the ‘part of a
group’ dummy variable, and the international market orientation of the enterprise.
These results are in line with previous studies exploring the determinants of efficiency
change at the enterprise level (Zheng et al., 2003).
The main difference as compared to the results in table 4 refers to the TFP level
variable. This turns out to be positively related to the dynamics of technical
efficiency, representing mechanisms such as learning by doing, improvements in
managerial practices and the acquisition of external knowledge, grows in a cumulative
way because it builds upon existing levels of knowledge stocks, human capital and the
absorptive capacity of a firm. In other words, this result indicates that firms that are
characterized by higher efficiency levels are also better able, over time, to implement
advanced techniques that are available in the industry (i.e. previously introduced by
other innovating firms), whereas enterprises that are too distant from the frontier are
less successful in this respect. Table 5 also suggests that this type of cumulative
catching up mechanism within each industry is stronger in the Schumpeter Mark II
regime, because this type of market is characterized by a greater polarization between
best-practice versus distant-from-frontier firms: the former (oligopolistic producers
that dominate the market) continuously improve their technical efficiency, while the
latter are not able to keep up with the rapidly moving technological frontier.
Secondly, some of the effects of the technological regime related variables do also
differ. The purchase of R&D from external specialized providers seems to be an
important channel to improve technical efficiency, whereas the internal R&D and
cumulativeness variables are not significant in the two model specifications that
control for differences between the Schumpeterian regimes. Among the external
sources of opportunities, internal sources and consultants turn out to be relevant
channels to achieve efficiency improvements.
Thirdly, the group of variables measuring other aspects of the innovative process also
shows some interesting differences vis-à-vis the determinants of technical progress.
The hampering factors indicators are in fact both positively related to efficiency
change, a possible interpretation being that when there exist significant obstacles to
devote resources to the improvements of its technical efficiency. As for the variables
measuring the effects of innovation, efficiency growth is positively related to the
market orientation of the firm and to its ability to save on labour costs. It is also
negatively linked to increases in the firm’s production capacity, since a higher
productive capacity makes it more difficult for an enterprise to achieve a full
utilization of it in the short run, thus lowering technical efficiency.
Finally, looking at the Schumpeter Mark II constant dummy, this indicates that
efficiency change has been significantly more rapid for firms in the Schumpeter Mark
I than in the Schumpeter Mark II. This provides further support for the third
hypothesis put forward in section 3 (see hypothesis 3b).
< Table 5 here >
6. Conclusions
The paper has analysed the dynamics of productivity of Norwegian firms in the period
1998-2004, and it has investigated the relationships between TFP growth and
technological regimes. The empirical analysis has proceeded in two steps. First, we
have employed data envelopment analysis in order to decompose the growth of TFP
into two distinct components, technical progress and efficiency change. Then, we
have explored the determinants of these two components by estimating a model that
links technological regime-related factors and a set of other firm-specific
Our main results can be summarized as follows. First, the productivity decomposition
exercise indicates that in the period 1998-2004 TFP growth has mostly been obtained
through technical progress, whereas technical efficiency has on average decreased.
The technological regime type of model that we have put forward to investigate the
determinants of these two distinct components appears to perform reasonably well in
the econometric estimations, and provides basic support for the first of our theoretical
hypotheses (see section 3, hypothesis 1).
Specifically, both components of productivity growth are significantly related to the
level of technological opportunities (as measured by the acquisition of external
knowledge), other sources of opportunities within the same firm, the ability of the
enterprise to increase market shares and entering new markets, as well as a set of
other firm-specific characteristics such as size, export orientation and the average
length of the product cycle.
Secondly, the econometric results also indicate that some of the explanatory variables
in the model have different effects on the two distinct components of productivity
growth. This provides support for the second hypothesis put forward by our
theoretical framework (see section 3, hypothesis 2).
In particular, internal R&D efforts and the cumulativeness of R&D activities are
important factors for the dynamics of technical progress but not for efficiency change.
Among the external sources of opportunity, competitors on the same market are
important for technical progress, whereas interacting with the consultants seems to
constitute a more relevant factor to achieve efficiency improvements. Increases in the
productive capacity of the firm are, quite obviously, positively related to technical
progress but negatively linked to the efficiency component. Last, the level of TFP
change), thus possibly suggesting a possible trade-off in the short-run between the
efforts devoted to the introduction of new technologies and the achievement of high
efficiency in the utilization of existing techniques.
Thirdly, the empirical results also provide support for the idea that the relationships
between technological regimes, technical progress and efficiency changes work
differently in different Schumpeterian patterns of innovation (see section 3,
hypothesis 3). In the piecewise linear regression version of our econometric model,
many of the explanatory variables turn out to have different estimated coefficients in
the Schumpeter Mark I and in the Schumpeter Mark II regimes. This is particularly
the case in the technical progress equation, where several regressors significantly
differ among the regimes (e.g. cumulativeness, group structure, length of the product
life, market location, lack of technological information as a main hampering factor).
These results also indicate that the technical progress component of TFP growth has
proved to be significantly more dynamic for firms in the Schumpeter Mark II regime
(hypothesis 3a), whereas the efficiency change component has been higher for
enterprises in the Schumpeter Mark I type of markets (hypothesis 3b).
Our interpretation of this result is that the mechanism of productivity growth differs in
the two Schumpeterian regimes. While Schumpeter Mark II markets are characterized
by an oligopolistic structure where large incumbent innovators continuously and
cumulatively push the technological frontier further (technical progress), firms in
Schumpeter Mark I industries must pay close attention to make an efficient use of
already available techniques (efficiency change), which is a crucial requirement to
Appendix: Empirical model and econometric issues
In order to analyse the relationship between TFP growth and innovation, we follow a
two-step empirical strategy. The first step estimates TFP growth and decomposes it
into two components: technical progress and efficiency change (see section 4). The
second step uses these two components as dependent variables, and relates them to a
set of innovation variables by means of a Heckman selection econometric model (see
section 5).
A1. Step 1: the DEA empirical model
Data envelopment analysis (DEA) is a nonparametric method to estimate the
production frontier and efficiency levels of a number of observed units (Farrell,
1957). In our paper (see section 4), we estimate the production frontier and efficiency
of n firms belonging to each sector j for each period t.
In each industry, the production process may be described as follows. The n
enterprises produce the output Yit (where Yit ≥ 0) by using m inputs Xit (in our
empirical exercise m equals 2, capital and labour). The production setΩt is defined as
the set of physically attainable combinations (Xt;Yt), i.e. such that Xt can produce Yt.
For each firm i, the Farrell output measure of efficiency Εt(Xit;Yit) indicates the
distance between the enterprise and the production frontier in its industry. If
Εt
(Xit;Yit) = 1 the firm is output-efficient (i.e. it is a best-practice unit), otherwise it
lies below the production frontier.
Given this efficiency measure, the Malmquist productivity index for firm i (Färe et al.,
1994; Färe and Grosskopf, 1996) can be defined as:
where the numerator measures the efficiency change that the firm would need in order
to achieve the combination (Xit+1;Yit+1) in the next period (t+1) given the technology
available in the current period (t). Given Mit and Mit+1, the Malmquist productivity
change index measures the growth of TFP between period t and t+1:
ΔMi (t; t+1) = {[Εt(Xit+1;Yit+1) / Εt(Xit;Yit)] • [Εt+1(Xit+1;Yit+1) / Εt+1(Xit;Yit)]}½ (2)
This growth index can be decomposed into two parts:
ECi (t; t+1) = [Εt+1(Xit+1;Yit+1) / Εt(Xit;Yit)] (3)
TPi (t; t+1) = {[Εt(Xit+1;Yit+1) / Εt+1(Xit+1;Yit+1)] • [Εt(Xit;Yit) / Εt+1(Xit;Yit)]}½ (4)
The first component measures the change of efficiency of firm i whereas the second is
the technical progress component. These two components represent the dependent
variables of our empirical study. However, since the production set Ωt is unknown, we
need an estimation of it before being able to calculate the efficiency measures and
productivity components that have been defined here.
Simar and Wilson (2000) point out three general assumptions that are sufficient to
specify a data generating process (DGP) for estimating the production set Ωt: (1) free
disposability and convexity of the production set; (2) i.i.d. sampling: the n
observations are generated by i.i.d. random variables with a given probability density
function f(Xt;Yt); (3) Εt(Xit;Yit) is differentiable in both inputs and output for all
observations. In short, given these assumptions, the DGP is defined as: Ρ = Ρ (Ωt;
The DEA estimator of the production frontier, ΩtDEA, is obtained as the solution of the
following linear programming problem:
Ωt
DEA = { (Xt;Yt) |
y ≤∑ (ηi • Yi)
x ≥∑ (ηi • Xi)
∑ηi = 1
ηi≥ 0; i = 1, …, n } (5)
Plugging ΩtDEA into Et(Xit;Yit), we obtain EtDEA(Xit;Yit), i.e. the DEA estimator of
efficiency for a given firm i in period t. By using these estimated efficiency levels, we
can then obtain estimates of the two productivity growth components defined above,
efficiency change and technical progress: ECiDEA (t; t+1) and TPiDEA (t; t+1).
A2. Econometric issues and possible limitations of the DEA approach
Issue I: Sensitivity of efficiency estimates to the sampling variation of the frontier
Simar and Wilson (1998; 2000) point out that the DEA estimates of efficiency levels
may be sensitive to the sampling variation of the production frontier. They therefore
propose a bootstrap procedure that can be used for the inference process in relation to
DEA estimates.
The general idea of this bootstrap procedure is to simulate the DGP and apply the
DEA estimator to each simulated sample. The obtained estimates will tend to
reproduce the sampling distribution of the DEA estimator, and can therefore be used
steps: (1) generate K samples Sk* (k = 1, …, K); (2) for each k, calculate the pseudo
estimates ΩktDEA* and EktDEA*(Xit;Yit); (3) use the empirical distribution of
EktDEA*(Xit;Yit), for k = 1, …, K, for constructing confidence intervals for
EtDEA(Xit;Yit). Notice, however, that this bootstrap procedure is effective if we make
use of a good estimator of the data generating process Ρ = Ρ (Ωt; f(Xt;Yt)), which will
not necessarily be the case in many empirical exercises.
An important econometric result is provided by Banker (1993), who demonstrates
that, under rather general conditions, the DEA estimator is consistent. In short, the
intuition of Banker’s result can be summarized as follows. For each observation i, the
estimated efficiency level is determined independently on the efficiency levels
estimated for all other units. Hence, if the DEA is represented as a MLE model, the
likelihood function is maximized in correspondence to the DEA estimator. In other
words, the DEA estimator provides a MLE of the frontier and it is therefore a
consistent estimator (for details and a proof of this result see Banker, 1993). For the
specific exercise carried out in this paper, this result is important: since we are using a
large and representative sample of Norwegian firms in each sector, the consistency
property of the DEA estimator suggests that we can rely on the validity of our
efficiency estimates.
Issue II: Super-efficient outliers
Cazals et al. (2002) and Simar (2003) observe that DEA estimates could be very
sensitive to the presence of super-efficient outliers (i.e. observations that lie
substantially above the other production units). It is therefore important to check for
the presence of outliers and make sure that the DEA estimates are carried out without
inspection of outliers. Specifically, after obtaining a first set of DEA efficiency
estimates for each industry, we have identified the units whose single-input
productivities (i.e. the productivity with respect to either capital or labour) lie
substantially above those for the other firms. We have then singled out and deleted
these outliers and repeated the DEA estimations without them.
Simar (2003) has recently proposed an alternative outliers detection procedure based
on the concept of order-m frontier of Ω. Cazals et al. (2002) define the order-m
frontier of Ω, Ωm, as the expected value of the maximum of m random variables
generated by the DGP P. m is a trimming parameter, i.e. a fixed integer (1 ≤m ≤ n)
such that, as the parameter increases, Ωm tends to the true frontier Ω. If some observed
point remains above Ωm even when m increases, then this observation is a possible
outlier and needs to be inspected more carefully.
Simar’s method of outliers detection consists of the following steps: (1) for each
observation, compute the leave-one-out efficiency score of the order-m frontier (i.e.
the efficiency score obtained by deleting that specific observation); (2) repeat step 1
for several increasing values of m, and report all results (for each observation and
different values of m) in a table; (3) focus on those observations for which the values
of the order-m efficiency scores are substantially smaller than 1; (4) delete these
super-efficient outliers and repeat the DEA estimations without these observations.
A3. Step 2: the Heckman selection model
The second step of our empirical analysis (see section 5) uses the two productivity
growth components estimated through DEA as dependent variables, and relates them
to a set of innovation variables by means of a Heckman selection econometric model.