Munich Personal RePEc Archive
Heat impact on schoolchildren in
Cameroon, Africa: potential health
threat from climate change
Dapi N., Léonie and Rocklov, Joacim and Nguefack-Tsague,
Georges and Tetanye, Ekoe and Kjellstrom, Tord
Umea Centre for Global Health Research, Umea University, Sweden
29 November 2010
Online at
https://mpra.ub.uni-muenchen.de/27335/
Heat impact on schoolchildren in
Cameroon, Africa: potential health
threat from climate change
Le´onie N. Dapi
1*, Joacim Rocklo¨v
1, Georges
Nguefack-Tsague
2, Ekoe Tetanye
2and Tord Kjellstrom
1,3,41Department of Epidemiology and Global Health, Umea˚ University, Umea˚, Sweden;2Department of Public Health, University of Yaounde´ I, Yaounde´, Cameroon;3National Center for Epidemiology and Population Health, Australian National University, Canberra, Australia;4International Health,
University of Tromso, Tromso, Norway
Background:Health impacts related to climate change are potentially an increasing problem in Cameroon,
especially during hot seasons when there are no means for protective and adaptive actions.
Objective: To describe environmental conditions in schools and to evaluate the impact of heat on
schoolchildren’s health during school days in the Cameroon cities of Yaounde´ and Douala.
Methods: Schoolchildren (N285) aged 1216 years from public secondary schools completed a questionnaire about their background, general symptoms, and hot feelings in a cross-sectional study. In Yaounde´, 50 schoolchildren were individually interviewed during school days about hourly symptoms (fatigue, headache, and feeling very hot) and performance. Lascar dataloggers were used to measure indoor classroom temperatures and humidity.
Results: There was a significant correlation between daily indoor temperature and the percentages of
schoolchildren who felt very hot, had fatigue, and headaches in Yaounde´. A high proportion of schoolchildren felt very hot (48%), had fatigue (76%), and headaches (38%) in Yaounde´. Prevalences (%) were higher among girls than boys for headaches (58 vs 39), feeling ‘very hot overall’ (37 vs 21), and ‘very hot in head’ (21 vs 18). Up to 62% were absentminded and 45% had slow writing speed. High indoor temperatures of 32.58C in Yaounde´ and 36.68C in Douala were observed in school.
Conclusions: Headache, fatigue, and feeling very hot associated with high indoor air temperature were observed among schoolchildren in the present study. Longitudinal data in schools are needed to confirm these results. School environmental conditions should be improved in order to enhance learning.
Keywords: heat;fatigue;headache;very hot;indoor temperature;Cameroon;schoolchildren
Received: 10 September 2010; Revised: 6 November 2010; Accepted: 6 November 2010; Published: 29 November 2010
H
ealth impacts related to climate change have been given increasing attention during recent years. Negative impacts of heat exposure on human health and performance have been known for several decades (15). In low income countries and in Cameroon, there are increasing problems of heat-related ill-health, especially during hot seasons when there are no means for protective and adaptive actions such as air conditioning and water supply (57). Heat exposure can affect physical and mental capacity and lead to heat exhaustion or heat stroke in extreme cases (8). The main factor underlying these effects is an increase in core body temperature (hyperthermia) (2, 8). When body tempera-tures exceed 398C, acute heat disorders (e.g. heat stroke)may occur. Above 40.68C, life-threatening severe hyper-pyrexia starts to occur and can lead to death (2, 810).
The human body functions and performs optimally at a core body temperature of around 378C (5). For the body to maintain this temperature and sustain heat balance, it uses thermoregulatory system processing signals from the hypothalamus in the central nervous system and then regulates the cardiovascular system, kidneys, and water content in the intravascular system, interstitial places, and cells by hormones and behavioral response actions (e.g. removing clothing). However, the need for thermoregulation is highly affected by six factors (1). These are: ambient air temperature, radiant tempera-ture, air humidity, air movement (wind speed), clothing,
and metabolic heat generated by physical activity. The most important physiological regulatory mechanism for thermoregulation is sweating. With massive sweating, there is dehydration and loss of fluids and salts. Dehydration affects physical and mental performance at losses of as little as 1% (1, 11). Studies performed in climate chambers and actual classrooms found reading speed, reading comprehension, and multiplication per-formance of schoolchildren to be poorer with tempera-tures of 27308C (12). An increase in air temperature has a negative effect on health and work performance (11, 13
15). Increased temperatures and low outdoor air supply rates can also cause ‘sick building syndrome’ symptoms such as headaches, difficulty in concentrating, fatigue, and lethargy (11, 16, 17). In a previous study on Cameroon schoolchildren, we found that headache, fatigue, dizziness, and malaria were the most prevalent health problems (18). As climate change brings increases in temperature, these problems may increase. Mental performance and attendance at school may also be affected by heat in schools.
To our knowledge, there is no study on daily heat exposure and the impact of heat on Cameroon school-children. The aim of the present study is to describe environmental conditions in schools and evaluate the impact of heat on schoolchildren’s health during school days in Yaounde´ and Douala.
Methodology
Settings
Data were collected in Yaounde´ and Douala. Yaounde´ is the capital city of Cameroon and has more than two million inhabitants and a land area of 297 km2. Douala is located in the coastal zone of the central province, the economic center of Cameroon, and is one of the hottest cities. Douala has more than three million inhabitants (and is the most densely populated area in Cameroon), and contains most of the urbanized and industrial areas of the country. The main diseases in Douala and Yaounde´ are malaria, respiratory diseases, diarrheal diseases, HIV/AIDS, tuberculosis, hypertension, obesity, and cardiovascular diseases. Houses are made of cement blocks, bricks, or shaped stones with a roof of cement, zinc, or tile (19). Household furnishings and belongings are characterized by cooking with gas (45%) or an open fire using wood, ownership of televisions, radios (81%), mobile phones (10%), and cars (19). About 22% of the population uses a water closet, electricity coverage is 97%, and a water supply in the home is 90%. The school attendance rate is 94% in Yaounde´ and Douala (20).
Weather and climate in the study regions
Cameroon is experiencing climate change characterized by increased temperatures during dry seasons and early
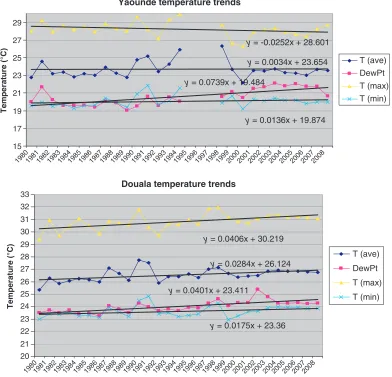
rains (with droughts and flooding). This problem is exacerbated in the north and southwest provinces and cities of Yaounde´ and Douala as compared to other provinces and cities. The temperature trends on Fig. 1, assembled by Kjellstrom and Lemke for this project from the US NOAA global climate website (http://www.noaa. gov/), show that both average temperature and average dew point (absolute humidity) increased consistently during the last 30 years at the two main Cameroon city airports. The linear equations show increase per year. Thus, 0.02848C per year is equivalent to 2.88C per century. In Yaounde´, data are missing for certain years and the trends are more varied. However, except for the maximum temperature temperatures continue to increase (Fig. 1). These data show annual trends and to get a better understanding of the actual heat stress during the hottest periods, monthly and daily data would be required. In Douala, the increasing dew point combined with the increasing temperature means a significant increase in heat stress.
School and classroom description
The school day is from 7:30 am to 15:30 pm with two breaks; a morning break is from 10:15 to 10:30 am and a lunch break is from 12:30 pm to 13:30 pm. On Wednesdays, schools close at 12:30 pm. Classrooms have no water supply, electricity, air conditioning, or fans. Each classroom has windows. Sometimes, windows are uncon-ventionally made by creating box-like openings in one wall section. The floors and walls are made of cement blocks and the roof is made of cement or tile. The desks are made of planks and placed in rows of six columns. Students sit three to a desk. The boys wear a uniform of trousers and shirts and girls wear dresses. The uniforms are made of cotton. Boys have short haircuts and girls have braided hair. The schoolyard has tap water.
Study population
Boys and girls, aged 1216 years, were recruited from three public secondary schools randomly selected in Yaounde´ and Douala. Two schools were randomly selected from Yaounde´ (school 1, school 2) and one was randomly selected from Douala (school 3). Two second grade classrooms were randomly selected from the two schools in Yaounde´. Two second grade classrooms were randomly selected from the school in Douala. All students from each classroom who were present at the time of data collection were included. In total, 285 schoolchildren completed the study. Permission to carry out the study was obtained from the school headmasters and each of the schoolchildren prior to study conduct. Ethical permission was obtained from the medical faculty of the University of Yaounde´, Cameroon.
Le´onie N. Dapi et al.
2
(page number not for citation purpose) Citation: Global Health Action 2010,
Data collection
Cross-sectional data were collected. The questionnaire was written in French by study personnel. Study person-nel consisted of one public health expert, two nurses, and four university students. Most of the study personnel were trained during a previous study about school-children’s nutrition. The others were trained a week before the present study. Interviews were performed only during breaks, lunch, or after school. We could not interview all of the schoolchildren each day due to time constraints and absence of those who went out for lunch, breaks, to drink water, or left for home before the interviews were conducted. Moreover, the study team was not large enough to interview all schoolchildren each day/ hour. However, interview speed and skills improved during data collection. Each interview lasted for about 45 min.
All schoolchildren (n285) in Yaounde´ (n174) and Douala (n111) completed the questionnaire about their
background (age, sex), general symptoms, and hot feeling. The background questionnaire was done at the beginning of the week and the general questionnaire/hot feeling was done at the end of the week. In Yaounde´ (school 1, March 1519, 2010; school 2, March 2226, 2010), 50 of 174 students were individually interviewed about hourly symptoms and performance. Some school-children were excluded because of missing data. A Lascar datalogger was used to measure indoor temperature, dew point, and humidity in the school 1 classroom (from 7:38 am to 15:38 pm) March 1519, 2010 and from March 2226, 2010 in the classroom for school 2 (from 7:34 am to 14:34 pm) in Yaounde´. The datalogger was fixed in one roof corner of the classroom. In school 3, a Celsius thermometer was used to measure the daily indoor temperature and relative humidity in classrooms from March 2226, 2010 in Douala (school 3). In addition, outdoor temperatures were measured using a Celsius thermometer in Douala and Yaounde´. The thermometer
Yaounde temperature trends
y = -0.0252x + 28.601
y = 0.0034x + 23.654
y = 0.0739x + 19.484
y = 0.0136x + 19.874
15 17 19 21 23 25 27 29
19801981198219831984198519861987198819891990199119921993199419951996199719981999200020012002200320042005200620072008
19801981198219831984198519861987198819891990199119921993199419951996199719981999200020012002200320042005200620072008
Temperature (°C)
T (ave) DewPt T (max) T (min)
Douala temperature trends
y = 0.0406x + 30.219
y = 0.0284x + 26.124
y = 0.0401x + 23.411
y = 0.0175x + 23.36
20 21 22 23 24 25 26 27 28 29 30 31 32 33
Temperature (°C)
T (ave)
DewPt
T (max)
[image:4.595.103.495.74.451.2]T (min)
was placed across the shadow of a window with an outside cable (in the shadow) to measure outdoor temperatures. The body weight of each student in light clothing and no shoes was measured to the nearest 0.1 kg using an electronic scale (Seca model 826, Bradford, UK) in the morning in Yaounde´. An 8 hour (from 7:30 am to 15:30 pm) symptoms and school performance interview was recorded for Monday, Tuesday, Wednesday, and Thursday in Yaounde´ (school 1 and school 2). The interview recall for Friday should have been done on Saturday but as there is no school on Saturday we had to omit these. The students were asked to recall all symptoms that they felt and school performance under-taken during the previous day from 7:30 am to 15:30 pm. This interview recall was about symptoms (i.e. fatigue, headache), hot feeling (i.e. hot, very hot), and school performance (i.e. writing speed, level of understanding, absentmindedness) from 7:30 am to 15:30 pm during the previous day. We have previously used the same method for 24-h dietary recall to collect information about food consumption (21). Individual interviews lasted about 45 min and were conducted at the school. Body temperature (8C) of the schoolchildren was also measured in Yaounde´.
Data analysis
Data were analyzed using SPSS version 15 and Microsoft Excel 2007. Descriptive statistics by school and week (Yaounde´ and Douala) were done for fatigue, hot/very hot, fever, vertigo, headache, nausea, thirst, malaria, and fever. Scatter plots, linear regression, and correlation (with Pearson correlation coefficient) were used to
investigate the relationship between indoor air tempera-ture and the percentage of schoolchildren who felt very hot, had fatigue, and had headaches in Yaounde´. Daily (Monday to Friday) and hourly (7:30 am to 15:30 pm) indoor air temperature, humidity, and dew point in Yaounde´ (week 1 and week 2) were computed. The percentage of schoolchildren performance in Yaounde´ was computed and included writing speed, lack of understanding, and absentmindedness. Outdoor air tem-perature in Yaounde´ and Douala as well as indoor air temperature and humidity in Douala was described.
Results
The mean ages were 12.791.4 years in school 1, 13.39
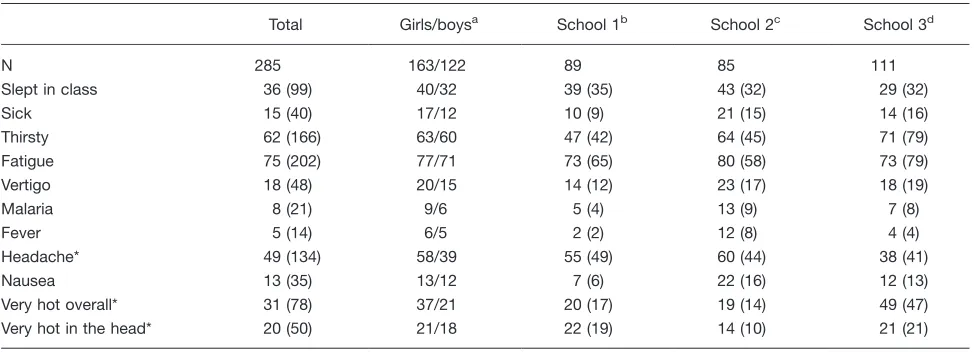
[image:5.595.55.542.474.650.2]1.2 years in school 2, and 12.991.3 years in school 3. Girls were heavier than boys, with mean weights (kg) of 49.999.2 vs 45.198.3 in school 1, and 46.899.3 vs 44.797.6 in school 2. Overall, the mean body tempera-ture was 37.68C; 30 children had a body temperature of at least 388C in Yaounde´. Table 1 describes the character-istics of the schoolchildren during the 2-week study period in Yaounde´ and Douala. School 1, school 2, and school 3 are three different groups of schoolchildren. Up to 75% of the children reported fatigue, more than 60% were thirsty, and 49% had a headache. More than a third slept in class, 31% felt very hot overall, and 20% felt very hot in the head. Prevalences (%) were higher among girls vs boys for sickness (17 vs 12), thirst (63 vs 60), fatigue (77 vs 71), vertigo (20 vs 15), malaria (9 vs 6), headache (58 vs 39), very hot overall (37 vs 21), very hot in head (21 vs 18), and sleeping in class (40 vs 32) although
Table 1. Characteristics (percentage in%, with number in brackets) of schoolchildren
Total Girls/boysa School 1b School 2c School 3d
N 285 163/122 89 85 111
Slept in class 36 (99) 40/32 39 (35) 43 (32) 29 (32)
Sick 15 (40) 17/12 10 (9) 21 (15) 14 (16)
Thirsty 62 (166) 63/60 47 (42) 64 (45) 71 (79)
Fatigue 75 (202) 77/71 73 (65) 80 (58) 73 (79)
Vertigo 18 (48) 20/15 14 (12) 23 (17) 18 (19)
Malaria 8 (21) 9/6 5 (4) 13 (9) 7 (8)
Fever 5 (14) 6/5 2 (2) 12 (8) 4 (4)
Headache* 49 (134) 58/39 55 (49) 60 (44) 38 (41)
Nausea 13 (35) 13/12 7 (6) 22 (16) 12 (13)
Very hot overall* 31 (78) 37/21 20 (17) 19 (14) 49 (47)
Very hot in the head* 20 (50) 21/18 22 (19) 14 (10) 21 (21)
a
Percentage (%) of girls vs boys. bSchool 1, week 1: March 15
19, 2010 in Yaounde´. cSchool 2, week 2: March 22
26, 2010 in Yaounde´. dSchool 3, week 2: March 22
26, 2010 in Douala.
*Significant differences between boys and girls (P0.010; 0.014; 0.027, for headache, very hot overall, and very hot in the head, respectively).
Note. School 1, school 2, and school 3 are three different groups of schoolchildren. Le´onie N. Dapi et al.
4
(page number not for citation purpose) Citation: Global Health Action 2010,
significant only for headache (P0.010), very hot overall (P0.014), and very hot in head (P0.027). Prevalences of all symptoms except for very hot overall and very hot in head were higher during week 2, school 2 (March 22
25) than week 1, school 1 (March 1518) in Yaounde´ (Table 1).
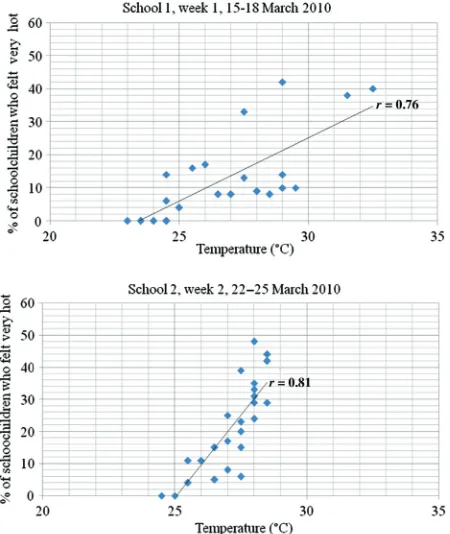
Figs. 24 show that there was a significant and positive correlation between indoor air temperature and the percentages of schoolchildren, who felt very hot, had fatigue, and had headaches in schools 1 and 2 in Yaounde´. School 1 and school 2 are two different groups of schoolchildren. The correlation coefficient was strong for very hot (PB0.001), fatigue (P0.002), and headache (P0.001) in school 1, week 1 and strong for very hot (PB
0.001), weak for fatigue (P0.037), and headache (P
0.267) in school 2, week 2. During the day, percentages of very hot, fatigue, and headaches increase linearly with indoor air temperature in Yaounde´ (Figs. 24). Compar-ing the slopes of Figs. 24 between schools indicate heterogeneity in the association of temperature and symptoms.
The within day comparisons (between 12:30 am and 15:30 pm) indicated that feeling very hot and a headache
was associated with indoor temperature and more pre-valent on the hottest days especially during week 1, school 1 (r0.72 and 0.53, very hot and a headache, respectively, school 1).
The highest proportion of students who felt very hot (48%) was observed on March 24 in Yaounde´. The highest proportions of fatigue (76%) and headache (38%) were observed on March 18 and 23, respectively, in Yaounde´.
The proportion of schoolchildren with poor perfor-mance increases during the day. Up to 62% were absent-minded, 45% had slow writing speed, and 25% did not understand the lessons in Yaounde´.
The indoor air temperatures, humidity, and dew points in Yaounde´ are presented in Fig. 5. The indoor air temperatures, humidity, and dew points are presented from Monday to Friday for week 1, school 1 (from 7:38 am to 15:38 pm) and week 2, school 2 (from 7:34 am to 15:34 pm) in Yaounde´. Daily indoor air temperature
[image:6.595.60.285.357.624.2]Fig. 2. Scatter plot showing the relationships between the temperature and the percentage of schoolchildren who felt very hot in Yaounde´. The lines are fitted linear regressions with xtemperature in degrees Celsius andypercentage (%) of schoolchildren who felt hot from Monday to Thursday between 7:30 and 15:30, r is the Pearson correlation coefficient between temperature and very hot (PB0.001, school 1 and school 2). School 1 and school 2 are two different groups of schoolchildren.
Fig. 3. Scatter plot showing the relationships between the temperature and the percentage of schoolchildren who had fatigue in Yaounde´. The lines are fitted linear regressions with
increases from morning to afternoon. In contrast to humidity, the dew point increases parallel to indoor air temperature. The highest indoor temperature during school hours was 32.58C in Yaounde´ and 36.68C in Douala. The highest relative humidity in Yaounde´ was 87% during week 1 and the lowest was 55.3% and occurred during week 2. In Douala, the highest relative humidity was 85% and the lowest 53%. In Yaounde´, the highest dew point was at 25.38C during week 1 and the lowest was at 17.88C during week 2. Daily outdoor air temperature increases from morning to afternoon, with the highest temperatures of 33.68C in Yaounde´ and 35.68C in Douala.
Discussion
The present study is both important and needed since data on the impact of heat on self-reported and measured health in Cameroon is largely missing, especially among schoolchildren. Our study is one of the first to provide data on indoor air temperature in schools and on the health impact of heat on schoolchildren in Cameroon. Temperature inside the classroom was very high during the
[image:7.595.319.538.69.343.2]present study and was found associated with health symptoms such as fatigue, headaches, and feeling very hot. Symptoms of heat exhaustion, including headache, vertigo, fatigue, very hot, slept in class, and thirst were observed among our schoolchildren. These were particu-larly present during the afternoon and around noon when indoor air temperature and dew point were high. In fact, most people feel comfortable when the indoor air tem-perature is between 20278C with relative humidity ranges from 3560% (22). In this study, the indoor air tempera-ture exceeded 278C every afternoon. Most of the time, the temperature in Yaounde´ was close to 308C with an increasing dew point. In Douala, temperatures were greater than 328C with a high relative humidity close to 70%. This explains why the children felt hot/very hot and reported headaches and fatigue as well as other symptoms. Exposure to high temperature has been associated to illnesses and high morbidity in many studies (1, 8, 10, 23). A high proportion of our schoolchildren reported that they felt very hot. This is probably because there was no ventilation, no adequate roof, windows, and wall in the
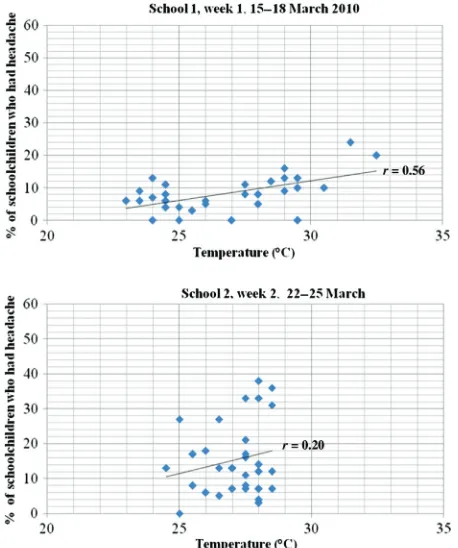
[image:7.595.58.287.70.344.2]Fig. 4. Scatter plot showing the relationships between the temperature and the percentage of schoolchildren who had headaches in Yaounde´. The lines are fitted linear regressions with xtemperature in degrees Celsius andypercentage (%) of schoolchildren who had headaches from Monday to Thursday between 7:30 and 15:30 and r is the Pearson correlation coefficient between temperature and headache (P0.001, school 1 andP0.267, school 2). School 1 and school 2 are two different groups of schoolchildren.
Fig. 5. Datalogger of indoor air temperature, humidity, and dew point by hours from Monday to Friday from 7:30 to 15:30 in classrooms in Yaounde´. Temperature, dew point (an index of absolute humidity), and humidity (percentage relative humidity) are given by hours from Monday to Friday. The lines are fitted linear regressions withxhours: 7:30 to 15:30 and ythe level of each variable in degrees
Celsius and in percentage of relative humidity. School 1 and school 2 are two different groups of schoolchildren. Vertical lines within the figures indicate the days.
Le´onie N. Dapi et al.
6
(page number not for citation purpose) Citation: Global Health Action 2010,
classrooms. Furthermore, most of the time doors and windows were closed. Sometimes the roof was made of tiles and the tiles were damaged. Moreover, there were more than 80 children in a classroom and their uniforms and shoes were not appropriate for the heat. In addition, schoolchildren do not always drink fluids when they are thirsty because there is no water supply inside the class-room. In fact, the children are forced to sit in the classroom during lessons. They cannot go out for fresh air. The health impact of heat, as described in the present study, has been reported in many other studies (1, 2, 4, 8, 24). Warm environments were related to headaches, feeling bad, and lethargy in a review by Wyon (14). Recently, Parsons described how fatigue, heat stroke, and death were related to extreme heat (25).
A gender difference was observed in the present study. Girls reported a higher prevalence of headaches and feeling very hot overall and in the head than boys did. Girls are probably more vulnerable to high indoor air temperature because of menstruation and body composi-tion. Boys sometimes removed their shirts and rinsed their heads when it was hot (although only during breaks). The girls did not do this. The boys’ short haircuts might be protective, while girls have plaited and tight hairstyles. Also, girls had tight uniforms whereas boys had roomy uniforms. Sometimes girls have extra clothes/tee-shirt under their uniform. Girls were heavier than boys, and this might partially explain why they felt very hot more often than the boys did. Gender differences due to heat have been related to adverse health problems in other studies (23).
The higher prevalence of very hot overall and in the head among schoolchildren during week 1 compared to week 2 (Table 1), as well as the difference between week 1 and week 2 in Yaounde´ regarding the relationship between indoor temperature and very hot, fatigue, and headaches among schoolchildren, could be due to the fact that school 2 experienced almost no changes in indoor temperature between days in contrast to school 1. This difference could also be due to the higher number of girls in school 1 (56 girls vs 33 boys) compared to school 2 (47 girls vs 38 boys), since more girls felt very hot than did boys.
Body temperature exceeded 378C in some school-children. This was probably due to extremely high indoor air temperatures, especially during week 1. This likely caused thermal stress. The healthy human body main-tains a temperature of approximately 378C (5). Higher temperatures can cause malfunction of body systems (2, 5, 8), and vulnerability to heat is linked to intrinsic changes in the regulatory system (1, 4, 8). Several studies have reported excess mortality due to heat waves. In 1995, a 13.5% excess in deaths due to heat was reported among children aged 0 to 15 years in London (2, 26, 27).
In the present study, many schoolchildren were absent-minded, had low writing speed, and did not understand
the lessons especially in the afternoon and around noon probably because of indoor air temperatures of more than 328C in classrooms in Yaounde´. High indoor air temperatures and dew points were related to headache, fatigue, and feeling hot and this might have had negative effects on school performance. In fact, the speed of school work decreases for each 18C increase in indoor air temperature (28). Some classroom studies in the 1960s found that reading speed, reading comprehension, and multiplication performance of schoolchildren were poorer at temperatures of 27298C (29). Also, more recent studies found that warm environments affect work performance by increasing spelling, reading, typing, grammatical errors, and a difficulty in thinking clearly and concentrating (11, 14). Creative thinking was worse at 308C than at lower temperatures in a study of office work (3). Longitudinal data analysis studying hourly and daily symptoms, body measurements, and indoor air temperature measures between days in schools are needed to confirm these results and to disentangle trends within and between days from the association between indoor temperature and health status as well as to properly adjust for confounding factors.
Conclusions
Adverse symptoms such as headache, fatigue, and feeling very hot was found associated with high indoor air temperatures among schoolchildren in Cameroon. Poor school performance was also observed among our schoolchildren during the warmest period of the day. Adequate environmental actions including good ventila-tion, open doors and windows, and water supplies are needed in schools that experience high heat.
Acknowledgements
We acknowledge the schoolchildren who participated in the study and the school headmasters. We thank the study personnel who collected the data. Additionally, we thank Dr. Olof Cronberg for consultation of the manuscript and Dr. Anne Nafzigen for editing the manuscript. Funding for this study was from the Umea˚ Centre for Global Health Research, Umea˚ University, Sweden. The Umea˚ Centre for Global Health Research is supported by FAS, the Swedish Council for Working Life and Social Research (Grant No. 2006-1512). The authors report no conflict of interest. LND planned and executed the study, analyzed the data, and prepared the initial, revised, and final versions of the manuscript. TK and JR participated in the initial, revised, and final versions of the manu-script. ET participated in the initial version of the manuscript and GNT participated in the statistical analyses.
Conflict of interest and funding
References
1. Parsons K. Human thermal environment. The effects of hot, moderate and cold temperature on human health, comfort and performance, 2nd ed. New York: CRC Press; 2003.
2. Hajat S, O’Connor M, Kosatsky T. Heath effect of hot weather: from awareness of risk factors to effective health protection. Lancet 2010; 375: 85663.
3. Witterseh T, Wyon DP, Clausen G. The effects of moderate heat stress and open-plan office noise distraction on SBS symptoms and on the performance of office work. Indoor Air 2002; 14: 718.
4. Kjellstrom T, Holmer I, Lemke B. Workplace heat stress, health and productivity. An increasing challenge for low and middle-income countries during climate change. Global Health Action 2009; 2. DOI: 10.3402/gha.v2i0.2047.
5. Kjellstrom T. Climate change, direct heat exposure, heat and well-being in low and middle-income countries. Global Health Action 2009. DOI:10.3402/gha.v3i0.2120.
6. Intergovernmental Panel on Climate Change (IPCC). Climate change: impact, adaptation and vulnerability. Cambridge: Cambridge University Press; 2007.
7. UNEP/Ministry of Environment and Forestry, Cameroon. Country case study on climate change impacts and adaptation assessment. Vol. 2. Cameroon: UNEP, Nairobi, and Ministry of Environment and Forestry, Cameroon; 1998.
8. Leithead CS, Lind AR. Heat stress and heat disorders. London: Cassell; 1964.
9. Bouchama A, Knochel JP. Heat stroke. New Engl J Med 2002; 346: 197888.
10. WHO. Climate change and health, Fact sheet No 266, January 2010. Available from: http://www.who.int/mediacentre/fact-sheets/fs266/en/ [cited 30 September 2010].
11. Wargocki P, Wyon DP, Matysiak B, Irgens S. The effects of classroom air temperature and outdoor air supply rate on the performance of school work by children. In Proc. of the 10th International conference on Indoor Air Quality and Climate, Indoor Air, Beijing, China, 49 September 2005, pp. 36872. 12. Fisk W, Seppanen O. Providing better indoor environmental
quality brings economic benefits. Published in Proceedings of Climate 2007 Well Being Indoors. Helsinki, FINVAC. 13. Pilchet JJ, Nadler E, Bush C. Effect of hot and cold temperature
on performance: a meta analysis review. Ergonomics 2002; 15: 68398.
14. Wyon D. The effects of air quality on performance and productivity. Indoor Air 2004; 4: 91101.
15. Code A, Drummond P. Temperature effects on emotional experiences and body language. Thesis. Murdoch University, Australia, 2008.
16. Krogstad AL, Swanbeck G, Barrega˚rd LS, Rynell KB. Prospective study of indoor climate problems at different
temperatures in offices in Swedish. Goteborg, Sweden: Volvo Truck Corporation; 1991.
17. Wargocki P, Sundell J, Bischof W, Brundrett G, Fanfeg PO, Gyntelberg F, et al. Ventilation and health in nonindustrial indoor environments. Report from a European Multidisciplin-ary Scientific Consensus Meeting. Indoor Air 2001; 12: 11328. 18. Dapi NL, Janlert U, Stenlund H, Nouedoui C, Haglin L. Socioeconomic and gender differences in adolescents nutritional status in urban Cameroon, Africa. Nutr Res 2009; 9: 3139. 19. Ministry of Economy and Finance, Cameroon. Living
condi-tions and poverty in Cameroon in 2001.
20. National Institute of Statistics, Cameroon. Evolution of poverty in Cameroon between 1996 and 2001.
21. Dapi NL, Ho¨rnell A, Janlert U, Stenlund H, Larsson C. Energy and nutrient intake in relation to sex and socioeconomic status among school adolescents in urban Cameroon, Africa. Publ Health Nutr 2010 (In press).
22. NOAA National Weather Service. Heat. Available from: http:// www.nws.noaa.gov/om/heat/index.shtml [cited 1 October 2010]. 23. Tawatsupa B, Lim L, Kjellstrom T, Seubsman SA, Sleigh A. The Thai cohort study. The association between overall health, psychological distress, and occupational heat stress among a large national cohort of 40913 Thai workers. Global Health Action 2010; 3. DOI:10.3402/gha.v3i0.5034.
24. WHO. Climate change and human health; 2005. Available from: http://www.who.int/globalchange/summary/en/index3.html [cited 30 September 2010].
25. Parsons K. Maintaining health, comfort and productivity in heat waves. Global Health Action 2009; 2. DOI: 10.3402/ gha.v2i0.2057.
26. Climate Change Impacts Review Group (CCIRG). Review of the potential effects of climate change in the United Kingdom. London: HMSO; 1996.
27. Department of Health. The health effects of climate change in the UK. London: HMSO; 2002.
28. Wargocki P, Wyon DP. Research report on effects of HVAC on student performance. ASHRAE 2006; 48: 228.
29. Wyon DP. Studies of children under imposed noise and heat stress. Ergonomics 1970; 15: 598612.
*Le´onie N. Dapi
Department of Public Health and Clinical Medicine Epidemiology and Global Health
Umea˚ University, Umea˚ SE-901 85, Sweden Tel:46 907852496 Fax:46 90138977
Email: leonie.dapi.nzefa@epiph.umu.se Le´onie N. Dapi et al.
8
(page number not for citation purpose) Citation: Global Health Action 2010,