http://dx.doi.org/10.4236/ijmpcero.2016.52015
How to cite this paper: Chen, R.W., Zhou, Y. and Wen, B.X. (2016) Clinicopathological and Prognostic Significance of Circu-lating Tumor Cells in Patients with Head and Neck Cancer: A Meta-Analysis. International Journal of Medical Physics, Clinical Engineering and Radiation Oncology, 5, 138-149. http://dx.doi.org/10.4236/ijmpcero.2016.52015
Clinicopathological and Prognostic
Significance of Circulating Tumor Cells
in Patients with Head and Neck Cancer:
A Meta-Analysis
Ruiwan Chen1, Yu Zhou2, Bixiu Wen1*
1Department of Radiotherapy, The First Affiliated Hospital, Sun Yat-sen University, Guangzhou, China 2Department of General Surgery, Guangdong General Hospital, Guangzhou, China
Received 26 December 2015; accepted 20 May 2016; published 23 May 2016
Copyright © 2016 by authors and Scientific Research Publishing Inc.
This work is licensed under the Creative Commons Attribution International License (CC BY).
http://creativecommons.org/licenses/by/4.0/
Abstract
Purpose: The aim of the study was to evaluate the association between clinicopathological and prognostic significance and circulating tumor cells (CTCs) in patients with head and neck cancer. Methods: We searched PubMed, MEDLINE, BioMed, and EMbase databases for studies that as-sessed the association between clinicopathological and prognostic significance and CTCs in pa-tients with head and neck cancer. Studies obtained from search strategy were screened using pre-specified criteria, and necessary data were retrieved for meta-analysis. Results: Seventeen studies with 816 patients were eligible for combined analysis. Presence of CTCs in peripheral blood was significantly associated with N stage (OR 0.50, 95%CI [0.30, 0.81], n = 10, P = 0.005). Pa-tients in the high-CTC group were significantly associated with poorer disease-free survival (DFS; HR = 1.73, 95%CI [1.01 - 2.96], P = 0.050) and poorer overall survival (OS; HR = 2.53, 95%CI [1.37 - 4.69] P = 0.003). Further analyses indicated strong prognostic powers of CTCs in non-RT-PCR group and pre-treatment group. Conclusion: Our meta-analysis indicates that presence of CTCs is associated with higher N stage and poorer prognosis in patients with head and neck cancer. The potential for further clinical application may be needed for further investigation.
Keywords
Circulating Tumor Cells, Head and Neck Cancer, Clinicopathological Characteristic, Prognosis, Meta-Analysis
vessels and sheltered subsets with metastasis-initiating ability [3]. CTCs have been detected in various cancers and the relationship between CTCs, and clinicopathological and prognostic significance have been reported in breast cancer [4][5], gastric [6] and colorectal cancer [7]. However, there still remains controversial regarding clinical significance of CTCs in patients with H&N cancer.
The aim of this study was to use a meta-analysis to comprehensively investigate the relationship between the presence of CTCs and clinicopathological significance of CTCs in H&N cancers, and to explore its potential prognostication impact.
2. Methods
2.1. Search Strategy
PubMed, Embase, the Science Citation Index, Cochrane databases and the Ovid Database were systematically searched for studies investigating the tumor clinicopathological and prognostic relationship between CTCs and H&N cancer, with no restrictions on language, place of publication or date of publication (up to November 2015). The main search terms used were “circulating tumor cells”, “disseminated tumor cells”, “head and neck cancer”, “nasopharyngeal”, “nasal”, “oral”, “oropharyngeal”, “hypopharyngeal”, “laryngeal”, and “larynx”.
2.2. Eligibility Criteria
To make our analysis reliable, we screened the titles and abstracts for all searched papers, and full text was pe-rused for potential eligible studies according to the following inclusion criteria: 1) containing patient cases of H&N cancer; 2) measuring the presence of CTCs in peripheral blood (PB); 3) investigating the clinicopatholog-ical and prognostic significance of CTCs in H&N cancer patients with at least one of the outcome measures of interest. Studies were excluded in our study: 1) duplicated publications; 2) no outcomes of interest that were provided or can’t be calculated for prognostic evaluation.
2.3. Data Extraction
Two reviewers (Chen RW and Zhou Y) independently evaluated each papers and extracted data, and any disa-greements were resolved via discussion, with a third investigator if necessary. The following information was extracted: first author, publication year, population characteristics (i.e., country, number, sex and age), tumor clinicopathological characteristics (i.e. anatomical sites, pathologic differentiation and TNM stage), sampling times (preoperative or postoperative), detection methods (RT-PCR array, Non-RT-PCR array including Cell Search system or immunocytochemistry), CTCs positive rate, detection markers, endpoints and survival data. For studies with multiple markers or detect methods, each of the cohorts was considered an independent data set. However, for those studies with multiple sample times (i.e. pre-treatment and intra/post-treatment), we use data from pre-treatment samples because those data were usually dependent from various treatment regimens.
2.4. Statistical Approaches
Cochrane Collaboration, 2012). To evaluate the association between CTCs and clinicopathological characteris-tics, the estimated odd ratios (ORs) were extracted from enrolled publications. To statistically assess the prog-nostic significance (DFS and OS), we extracted the estimated hazard ratios (HRs) and associated 95% CIs when available. If the HR and its variance were not reported directly in the original study, these values were calculated from available reported data using software designed by Tierney JF [8]. When HRs was presented by both un-ivariate and multun-ivariate analyses, the multun-ivariate ones were employed due to adjustment for confounding fac-tors. Heterogeneity among the studies was tested using the χ2 test and I2 statistic. A value of I2 < 25%, within 25% - 50% or more than 50% was regarded as low, moderate, or significant heterogeneity, respectively. The random-effects mode was explored to perform the analyses, because this model obtained more conservative re-sults than the fixed-effect model [9]. A two-sided P < 0.05 was considered statistically significant. Furthermore, subgroup analyses were made to explore the inherent heterogeneity. Lastly, the potential publication bias was evaluated using the funnel plot. All of the studies included in this research were assessed by referring to the Newcastle-Ottawa quality assessment scale (NOS) for cohort studies.
3. Results
3.1. Baseline Characteristics
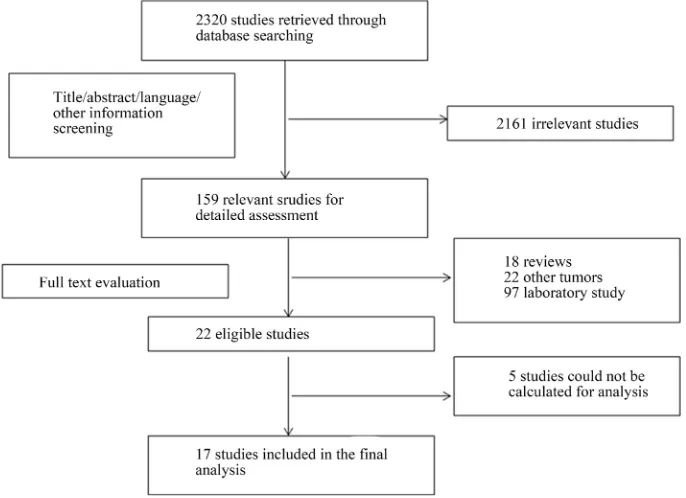
The primary literature research initially yielded 2320 articles. After screening the titles, abstracts, language and other information, 2161 studies were excluded and 159 potential studies were reviewed further. An additional 137 studies were then excluded which were reviews (n = 18), laboratory studies (n = 97) or studies of other tu-mors (n = 22). Upon detailed evaluation of the remaining 22 studies, 5 studies had to be excluded because the outcome of interest could not be calculated. Finally, a total of 17 articles were considered to be appropriate for the meta-analysis (Figure 1).
[image:3.595.143.486.457.706.2]The eligible 17 studies comprising 816 patients diagnosed as head and neck squamous cell carcinoma were published between 1999 and 2014 [10]-[26]. RT-PCR arrays were used to evaluate CTCs status in 6 studies, Cell Search system in 6 studies and immunocytochemistry (ICC) and other methods in the remaining studies. One study from the United Kingdom applied both RT-PCR and ICC and compared the agreement between these two methods, which was considered as two independent cohorts in the analysis. The samples for CTCs array were collected pre-treatment in 14 studies, only 2 studies [11][21] were collected post-treatment and 1 study not reported. The main characteristics of the included studies are summarized in Table 1. The quality of the in-
cluded studies was evaluated with the NOS and is summarized in Table 2.
3.2. Correlation between CTCs and Clinicopathological Parameters
3.2.1. T Stage and CTCs
A total of 10 studies reported the relationship between CTCs and T stage included in this meta-analysis. The χ2 test showed low to moderate heterogeneity among the studies (T1 vs. T2-4: P = 0.27; I2 = 19%; T1-2 vs. T3-4: P = 0.14; I2 = 35%). The data suggested modest association in CTCs and T stage [T1 vs. T2-4: OR 1.24, 95%CI (0.48, 3.21), n = 10, P = 0.66; T1-2 vs. T3-4: OR 0.70, 95% CI (0.31, 1.58), n = 9, P = 0.39] (Figure 2).
3.2.2. N Stage and CTCs
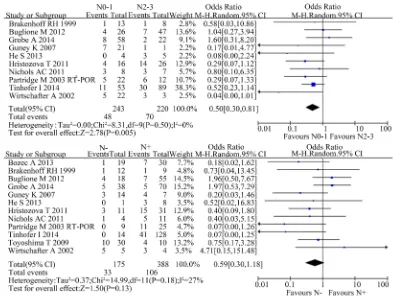
A total of 10 studies reported the difference of CTCs in N stage in this meta-analysis. Considering different combination of N stage, we divided into two situations: N negative vs. N positive and N0-1 vs. N2-3.
When considering N0-1 vs. N2-3, there were 10 studies included and the χ2 test showed no significant hete-rogeneity among the studies (P = 0.50; I2 = 0%). The result suggested that the presence of CTCs was signifi-cantly correlated with advanced N stage [OR 0.50, 95%CI (0.30, 0.81), n = 10, P = 0.005].
When considering N negative vs. N positive, there were 12 studies included and the χ2 test showed moderate heterogeneity among the studies (P = 0.18; I2 = 27%). The result suggested a trend of association in CTCs and N stage without statistical significance [OR 0.59, 95%CI (0.30, 1.18), n = 11, P = 0.13] (Figure 3).
3.2.3. Clinical Stage and CTCs
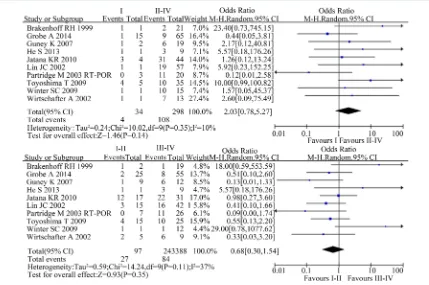
[image:5.595.88.538.407.684.2]A total of 10 studies reported the difference of CTCs in the clinical stage in this meta-analysis. The χ2 test showed moderate heterogeneity among the studies (I vs. II-IV: P = 0.35; I2 = 10%; I-II vs. III-IV: P = 0.11; I2 = 37%). The result suggested no statistically association in CTCs and clinical stage [I vs. II-IV: OR 2.03, 95%CI (0.78, 5.27), n = 10, P = 0.14; I-II vs. III-IV: OR 0.68, 95%CI (0.30, 1.54), n = 10, P = 0.35](Figure 4).
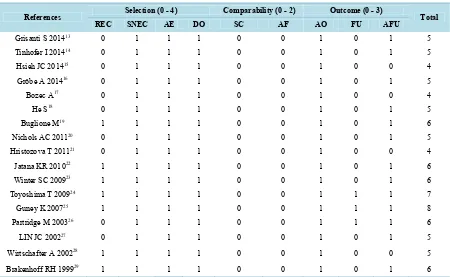
Table 2.Assessment of study quality using the Newcastle-Ottawa scale.
References Selection (0 - 4) Comparability (0 - 2) Outcome (0 - 3) Total
REC SNEC AE DO SC AF AO FU AFU
Grisanti S 201413 0 1 1 1 0 0 1 0 1 5
Tinhofer I 201414 0 1 1 1 0 0 1 0 1 5
Hsieh JC 201415 0 1 1 1 0 0 1 0 0 4
Gröbe A 201416 0 1 1 1 0 0 1 0 1 5
Bozec A17 0 1 1 1 0 0 1 0 0 4
He S18 0 1 1 1 0 0 1 0 1 5
Buglione M19 1 1 1 1 0 0 1 0 1 6
Nichols AC 201120 0 1 1 1 0 0 1 0 1 5
Hristozova T 201121 0 1 1 1 0 0 1 0 0 4
Jatana KR 201022 1 1 1 1 0 0 1 0 1 6
Winter SC 200923 1 1 1 1 0 0 1 0 1 6
Toyoshima T 200924 1 1 1 1 0 0 1 1 1 7
Guney K 200725 1 1 1 1 0 0 1 1 1 8
Partridge M 200326 0 1 1 1 0 0 1 1 1 6
LIN JC 200227 0 1 1 1 0 0 1 0 1 5
Wirtschafter A 200228 1 1 1 1 0 0 1 0 0 5
Brakenhoff RH 199929 1 1 1 1 0 0 1 0 1 6
Figure 2. Estimated odds radios (OR) for T stage. (a) Forest plot of the relationship in T1 group relative to T2-4 group; (b) Forest plot of the relationship in T1-2 group relative to T3-4 group.
[image:6.595.115.510.398.694.2]Figure 4. Estimated odds radios (OR) for total stage. (a) Forest plot of the relationship in I-II stage group relative to III-IV stage group; (b) Forest plot of the relationship in I stage group relative to II-IV stage group.
3.2.4. Other Clinical Parameters and CTCs
The difference between CTCs and age, sex, alcohol abuse, smoking history, anatomical sites and tumor grades was not statistically significant (data not shown).
3.3. Correlation between CTCs and Treatment Outcomes
3.3.1. DFS and CTCs
There were 5 studies presenting relationship between CTCs and DFS with only 1 study which gave the HR and 95%CI for DFS directly [11], and other 4 studies with HR and 95%CI of DFS which were calculated using the survival curves and the P values [19][21][23] The χ2 test showed low heterogeneity among the above studies (P = 0.43; I2 = 0%). The combined pooled HR of the above studies by a random-effects model was 1.73 (95%CI 1.01 - 2.96, P = 0.050), indicating that high CTCs level was significantly associated with a poor DFS in patients with H&N cancer (Figure 5(a)).
3.3.2. OS and CTCs
Similarly, HR and 95%CI for OS was directly extracted from the above 2 articles [10][11], and HRs and 95%CI for the remaining 1 study [23] was calculated using the survival curves and the P values. The χ2 test showed moderate heterogeneity among the above studies (P = 0.16; I2 = 43%). The pooled HR with a random-effects model was 2.53 (95%CI 1.37 - 4.69, P = 0.003), suggesting a significant lower OS in H&N cancer patients with CTCs positivity (Figure 5(b)).
3.4. Subgroup Analysis
3.4.1. Detect Methods: RT-PCR and Non-RT-PCR
Figure 5. Estimated hazard ratios (HR) for DFS and OS. (a) Forest plot of disease-free survival (DFS) in all patients; (b) Forest plot of overall survival (OS) in all patients.
14.30, P = 0.06) and OS (4.02, 95%CI 1.70 - 9.51, P = 0.002) were relatively higher than the RT-PCR group.
3.4.2. Sampling Time: Pre- and Post-Treatment
The relationship between T/N stage and the time of CTCs detection remains no statistical significance in both subgroups. In pre-treatment group, the HR and 95%CI for DFS and OS were 3.03 (95%CI 1.38 - 6.63, P = 0.0006) and 3.19 (95%CI 1.73 - 5.90, P = 0.0002) respectively. However, if the sampling time was post treat-ment, the HR and 95%CI for DFS and OS were 1.05 (95%CI 0.50 - 2.20, P = 0.09) and 1.36 (95%CI 0.60 - 3.10, P = 0.46), respectively. The more detailed data are shown in Table 3.
3.4.3. Sensitivity Analysis and Publication Bias
There was no obvious publication bias seen in this meta-analysis (Figure 6(a), Figure 6(b)).
4. Discussion
Comprehensive multidisciplinary strategies have widely been applied in the primary treatment of locally ad-vanced H&N cancer. Whereas the occurrence of local recurrence and distant metastasis still remains the leading cause of cancer-related deaths. There is an urgent demand to explore simple and reliable prognostic biomarkers for individualized cancer treatment. Among various biomarkers, detection of CTCs in PB may be a promising method and its correlation with clinicopathological features and prognostic significance has been investigated in breast cancer, gastrointestinal cancer and prostate cancer for many years. The clinical significance of CTCs in H&N cancer has not been thoroughly investigated. Therefore, we performed this pooled study and demonstrated presence of CTCs was significantly associated with higher N stage and poorer prognosis in patients with H&N cancer.
It is well known that survival of patients with H&N cancer is associated with several clinicalpathological fac-tors, including tumor grade and TNM stage and so on. Liao et al. reported in a meta-analysis that presence of CTCs was significantly associated with tumor size, tumor grade, ER and PR status in patients with breast cancer
[4]. Similar findings were reported in gastric cancer, showing a correlation of positive CTCs detection with high tumor stage, lymph node involvement, Lauren diffuse group and poorly differentiation [27]. In our pooled study, we found that significantly higher detection rate of CTCs in lymph node positive group, which again confirmed the emerging evidence that presence of CTCs in PB is associated with more aggressive clinicopathological fea-ture of malignancies.
Table 3.Results of subgroup analyses on TNM stage, DFS and OS.
Variables Overall Detect method Sampling time
RT-PCR Non-RT-PCR Pre-treatment Post-treatment
T stage
(T1-2: T3-4)
n 9 4 5 8 1
OR 0.70 0.34 1.27 0.86 0.25
95%CI 0.31 - 1.58 0.10 - 1.10 0.54 - 3.00 0.36 - 2.06 0.06 - 1.02
I2 35% 33% 0% 30% /
P 0.39 0.07 0.58 0.73 0.05
N stage
(N0-1: N2-3)
n 10 4 6 9 1
OR 0.50 0.44 0.52 0.48 0.52
95%CI 0.30 - 0.81 0.23 - 0.87 0.21 - 1.32 0.25 - 0.92 0.23 - 1.14
I2 0% 0% 32% 4% /
P 0.005 0.02 0.17 0.03 0.10
Clinical stage
(I-II: III-IV)
n 10 6 4 9 1
OR 0.68 0.69 0.76 0.73 0.55
95%CI 0.30 - 1.54 0.17 - 2.85 0.31 - 1.87 0.27 - 1.94 0.13 - 2.20
I2 37% 57% 0% 44% /
P 0.35 0.61 0.56 0.53 0.39
DFS
n 5 3 2 3 2
HR 1.73 1.55 3.70 3.03 1.05
95%CI 1.01 - 2.96 0.77 - 3.13 0.96 - 14.30 1.38 - 6.63 0.50 - 2.20
I2 0% 16% 0% 0% 0%
P 0.05 0.22 0.06 0.006 0.90
OS
n 4 2 2 3 1
HR 2.53 1.58 4.02 3.19 1.36
95%CI 1.37 - 4.69 0.83 - 3.02 1.70 - 9.51 1.73 - 5.90 0.60 - 3.10
I2 43% 0% 34% 18% /
[image:9.595.84.541.102.674.2]P 0.003 0.17 0.002 0.0002 0.46
Figure 6.Funnel plots of the enrolled studies. (a) N stage; (b) Overall survival (OS).
actually indicates baseline information of CTCs burden and should be more pathologically meaningful to esti-mate the patient survival. Meanwhile, CTCs detection as a prognostic biomarker may develop a maximal value in a pre-treatment setting for more individualized therapy. Other researchers believed that post-treatment CTCs may incorporate the pretreatment status of CTCs and also estimate the number of tumor cells released during surgical operation for patients with pancreatic cancer patients [30]. The actual underlying meaning for different effects of CTCs before and after treatment remains ambiguous which deserves to be investigated in future stu-dies.
Certain limitations still existed in the present study. Firstly, the individual information of enrolled studies was not available. Secondly, although the clinical significance was further discussed in subgroup analysis, the intra- and inter-study heterogeneity with regard to patient characteristics, detect methods and sampling time still re-mains inevitable. Thirdly, the optimal CTCs cutoff value for predicting the outcomes in H&N cancer is still un-der investigation and there is no uniform cutoff value to define high level of CTCs. Despite these limitations, our meta-analysis demonstrated the clinicopathological and prognostic significance of circulating tumor cells (CTCs) in periphery blood for patients with H&N cancer.
5. Conclusion
Our meta-analysis has indicated that the presence of CTCs in peripheral blood is associated with higher N stage and poorer prognosis in patients with H&N cancer. Detection of pre-treatment CTCs using Non-RT-PCR arrays might serve as a prognostic biomarker to guide individualized treatment. High-qualified, well-designed and large-scaled multicenter studies are urgently demanded to explore its potential as a biomarker for clinicopatho-logical and prognostic significance in patients with H&N cancer.
Funding
This work was funded by National Natural Science Foundation of China (No. 81172209); Guangdong Natural Science Foundation (No. S2011020003612).
Conflict of Interest
The authors declare that they have no conflict of interest.
Ethical Approve
For this type of study form consent is not required.
References
[1] Belcher, R., Hayes, K., Fedewa, S. and Chen, A.Y. (2014) Current Treatment of Head and Neck Squamous Cell Can-cer. Journal of Surgical Oncology, 110, 551-574. http://dx.doi.org/10.1002/jso.23724
Death. Medical Journal of Australia, 14, 146-149.
[3] Valastyan, S. and Weinberg, R.A. (2011) Tumor Metastasis: Molecular Insights and Evolving Paradigms. Cell, 147, 275-292. http://dx.doi.org/10.1016/j.cell.2011.09.024
[4] Liao, Y., Wang, S.Y., Meng, X.Y., Yang, J., Shi, M.J., Liu, H.L., et al. (2014) Circulating Tumor Cells in Breast Can-cer and Its Association with Tumor Clinicopathological Characteristics: A Meta-Analysis. Medical Oncology, 31, 343. http://dx.doi.org/10.1007/s12032-014-0343-7
[5] Cristofanilli, M., Budd, G.T., Ellis, M.J., Stopeck, A., Matera, J., Miller, M.C., et al. (2004) Circulating Tumor Cells, Disease Progression, and Survival in Metastatic Breast Cancer. The New England Journal of Medicine, 351, 781-791. http://dx.doi.org/10.1056/NEJMoa040766
[6] Yie, S.M., Lou, B., Ye, S.R., Cao, M., He, X., Li, P., et al. (2008) Detection of Survivin-Expressing Circulating Cancer Cells (CCCs) in Peripheral Blood of Patients with Gastric and Colorectal Cancer Reveals High Risks of Relapse. An-nals of Surgical Oncology, 15, 3073-3082. http://dx.doi.org/10.1245/s10434-008-0069-x
[7] Cohen, S.J., Punt, C.J., Iannotti, N., Saidman, B.H., Sabbath, K.D., Gabrail, N.Y., et al. (2008) Relationship of Circu-lating Tumor Cells to Tumor Response, Progression-Free Survival, and Overall Survival in Patients with Metastatic Colorectal Cancer. Journal of Clinical Oncology, 26, 3213-3221. http://dx.doi.org/10.1200/JCO.2007.15.8923
[8] Tierney, J.F., Stewart, L.A., Ghersi, D., Burdett, S. and Sydes, M.R. (2007) Practical Methods for Incorporating Sum-mary Time-to-Event Data into Meta-anaLysis. Trials, 8, 16. http://dx.doi.org/10.1186/1745-6215-8-16
[9] Schmidt, F.L., Oh, I.S. and Hayes, T.L. (2009) Fixed-Versus Random-Effects Models in Meta-Analysis: Model Prop-erties and an Empirical Comparison of Differences in Results. British Journal of Mathematical and Statistical Psy-chology, 62, 97-128. http://dx.doi.org/10.1348/000711007X255327
[10] Grisanti, S., Almici, C., Consoli, F., Buglione, M., Verardi, R., Bolzoni-Villaret, A., et al. (2014) Circulating Tumor Cells in Patients with Recurrent or Metastatic Head and Neck Carcinoma: Prognostic and Predictive Significance.
PLoS One, 9, e103918. http://dx.doi.org/10.1371/journal.pone.0103918
[11] Tinhofer, I, Konschak, R., Stromberger, C., Raguse, J.D., Dreyer, J.H., Johrens, K., et al. (2014) Detection of Circulat-ing Tumor Cells for Prediction of Recurrence after Adjuvant Chemoradiation in Locally Advanced Squamous Cell Carcinoma of the Head and Neck. Annals of Oncology, 25, 2042-2047. http://dx.doi.org/10.1093/annonc/mdu271 [12] Hsieh, J.C., Lin, H.C., Huang, C.Y., Hsu, H.L., Wu, T.M., Lee, C.L., et al. (2014) Prognostic Value of Circulating
Tumor Cells with Podoplanin Expression in Patients with Locally Advanced or Metastatic Head and Neck Squamous Cell Carcinoma. Head Neck, 37, 1448-1455.
[13] Grobe, A., Blessmann, M., Hanken, H., Friedrich, R.E., Schon, G., Wikner, J., et al. (2014) Prognostic Relevance of Circulating Tumor Cells in Blood and Disseminated Tumor Cells in Bone Marrow of Patients with Squamous Cell Carcinoma of the Oral Cavity. Clinical Cancer Research, 20, 425-433.
http://dx.doi.org/10.1158/1078-0432.CCR-13-1101
[14] Bozec, A., Ilie, M., Dassonville, O., Long, E., Poissonnet, G., Santini, J., et al. (2013) Significance of Circulating Tu-mor Cell Detection Using the Cell Search System in Patients with Locally Advanced Head and Neck Squamous Cell Carcinoma. European Archives of Oto-Rhino-Laryngology, 270, 2745-2749.
http://dx.doi.org/10.1007/s00405-013-2399-y
[15] He, S., Li, P., Long, T., Zhang, N., Fang, J. and Yu, Z. (2013) Detection of Circulating Tumour Cells with the Cell Search System in Patients with Advanced-Stage Head and Neck Cancer: Preliminary Results. Journal of Laryngology and Otology, 127, 788-793. http://dx.doi.org/10.1017/S0022215113001412
[16] Buglione, M., Grisanti, S., Almici, C., Mangoni, M., Polli, C., Consoli, F., et al. (2012) Circulating Tumour Cells in Locally Advanced Head and Neck Cancer: Preliminary Report about Their Possible Role in Predicting Response to Non-Surgical Treatment and Survival. European Journal of Cancer, 48, 3019-3026.
http://dx.doi.org/10.1016/j.ejca.2012.05.007
[17] Nichols, A.C., Lowes, L.E., Szeto, C.C., Basmaji, J., Dhaliwal, S., Chapeskie, C., et al. (2012) Detection of Circulating Tumor Cells in Advanced Head and Neck Cancer Using the CellSearch System. Head & Neck, 34, 1440-1444. http://dx.doi.org/10.1002/hed.21941
[18] Hristozova, T., Konschak, R., Stromberger, C., Fusi, A., Liu, Z., Weichert, W., et al. (2011) The Presence of Circulat-ing Tumor Cells (CTCs) Correlates with Lymph Node Metastasis in Nonresectable Squamous Cell Carcinoma of the Head and Neck Region (SCCHN). Annals of Oncology, 22, 1878-1885. http://dx.doi.org/10.1093/annonc/mdr130 [19] Jatana, K.R., Balasubramanian, P., Lang, J.C., Yang, L., Jatana, C.A., White, E., et al. (2010) Significance of
Circulat-ing Tumor Cells in Patients with Squamous Cell Carcinoma of the Head and Neck: Initial Results. JAMA Otolaryn-gology—Head & Neck Surgery, 136, 1274-1279. http://dx.doi.org/10.1001/archoto.2010.223
mor Detection in Patients with Head and Neck Cancer: A Preliminary Report. JAMA Otolaryngology—Head & Neck Surgery, 128, 40-43. http://dx.doi.org/10.1001/archotol.128.1.40
[26] Brakenhoff, R.H., Stroomer, J.G., ten Brink, C., de Bree, R., Weima, S.M., Snow, G.B., et al. (1999) Sensitive Detec-tion of Squamous Cells in Bone Marrow and Blood of Head and Neck Cancer Patients by E48 Reverse Transcrip-tase-Polymerase Chain Reaction. Clinical Cancer Research, 5, 725-732.
[27] Huang, X., Gao, P., Sun, J., Chen, X., Song, Y., Zhao, J., et al. (2015) Clinicopathological and Prognostic Significance of Circulating Tumor Cells in Patients with Gastric Cancer: A Meta-Analysis. International Journal of Cancer, 136, 21-33. http://dx.doi.org/10.1002/ijc.28954
[28] Mockelmann, N., Laban, S., Pantel, K. and Knecht, R. (2014) Circulating Tumor Cells in Head and Neck Cancer: Clinical Impact in Diagnosis and Follow-Up. European Archives of Oto-Rhino-Laryngology, 271, 15-21.
http://dx.doi.org/10.1007/s00405-013-2391-6
[29] Jatana, K.R., Lang, J.C. and Chalmers, J.J. (2011) Identification of Circulating Tumor Cells: A Prognostic Marker in Squamous Cell Carcinoma of the Head and Neck? Future Oncology, 7, 481-484. http://dx.doi.org/10.2217/fon.11.19 [30] Ma, X.L., Li, Y.Y., Zhang, J., Huang, J.W., Jia, H.Y., Liu, L., et al. (2014) Prognostic Role of Circulating Tumor Cells
in Patients with Pancreatic Cancer: A Meta-Analysis. Asian Pacific Journal of Cancer Prevention, 15, 6015-6020. http://dx.doi.org/10.7314/APJCP.2014.15.15.6015