Copyright © 1999, American Society for Microbiology. All Rights Reserved.
Monitoring of Epstein-Barr Virus DNA Load in Peripheral
Blood by Quantitative Competitive PCR
SERVI J. C. STEVENS,1MARCEL B. H. J. VERVOORT,1ADRIAAN J. C.VAN DENBRULE,1* PIETER L. MEENHORST,2CHRIS J. L. M. MEIJER,1ANDJAAP M. MIDDELDORP1,3 Department of Pathology, University Hospital Vrije Universiteit,1and Slotervaart Hospital,2Amsterdam,
and Organon Teknika, Boxtel,3The Netherlands
Received 22 April 1999/Returned for modification 25 May 1999/Accepted 22 June 1999
A competitive quantitative PCR (Q-PCR) assay combined with simple silica-based DNA extraction was developed for monitoring of Epstein-Barr virus (EBV) DNA load in unfractionated peripheral blood. The Q-PCR is based on competitive coamplification of a highly conserved 213-bp region of the EBNA-1 open reading frame with an internal standard (IS), added in a known concentration. The IS has the same amplicon length and base composition as the wild-type (WT) EBNA-1 amplicon but differs in 23 internally randomized bases. Competitive coamplification yields two PCR products that are quantified by enzyme immunoassay or by electrochemiluminescence detection, with probes specific for the 23 differing internal nucleotides. The Q-PCR has a sensitivity of 10 copies of either WT or IS plasmid DNA. The Q-PCR was validated by quantification of known amounts of plasmid containing the WT EBNA-1 target. Furthermore, we determined EBV genome copy numbers in different cell lines. For EBV quantification in clinical samples, DNA was isolated from lysed whole blood by silica-affinity purification. Forty-six percent of healthy donor peripheral blood samples were positive by Q-PCR. In most of these samples, viral load was less than 2,000 EBV copies/ml of blood. In peripheral blood samples from two AIDS-related non-Hodgkin’s lymphoma patients, elevated EBV loads (up to 120,000 copies/ ml) were observed, which decreased upon therapy. In Burkitt’s lymphoma patients, up to 4,592,000 EBV genome copies/ml of blood were detected. In conclusion, the EBNA-1-based Q-PCR assay provides a repro-ducible, accurate, and easy method for studying the relationship between EBV load and clinical parameters.
Epstein-Barr virus (EBV), a widely disseminated lympho-and epitheliotropic human gammaherpesvirus, is implicated in the etiology of a still-growing number of benign and malignant disorders. These include acute and chronic mononucleosis, Hodgkin’s disease, nasopharyngeal carcinoma, Burkitt’s lym-phoma, and B- and T-cell non-Hodgkin’s lymphoma. In iatro-genically and naturally immunocompromised individuals, such as transplant recipients and AIDS patients, EBV is the major predisposing factor for the development of lymphoprolifera-tive disorders (LPD) (6). Although the precise dynamics of EBV load in LPD patients are poorly understood, previous studies (9, 13, 15, 18, 19) showed elevated EBV DNA levels in the blood of LPD patients compared to those for non-LPD patients or healthy EBV-infected individuals. Thus, viral load monitoring could have diagnostic and prognostic relevance for these patients, as it may reflect the immunopathological changes preceding or underlying the genesis of LPD. Further-more, the emergence of new therapeutic regimens for the treatment of EBV-linked LPD has greatly increased the need for rapid and reliable tools for therapy monitoring, features possibly included in EBV load measurement.
Most studies focusing on the relationship between viral load and pathogenesis have used semiquantitative methods such as comparison of Southern blot signals of EBV-specific PCR products derived from samples to those of external standards (5, 15, 23) or end-point dilution PCR (9). These methods have major drawbacks as they do not correct for variations in am-plification efficiencies or inhibitory factors possibly present in clinical samples (25). Other studies (10, 19) used spontaneous
outgrowth of transformed B cells ex vivo as a measure for EBV load. This method, however, is laborious, time-consuming, and not suitable for large-scale screening of patient samples. To overcome the disadvantages of the methods described above, quantitative PCRs (Q-PCRs), using competitive coamplifica-tion of internal standards (ISs), have been developed for EBV. Rowe et al. (20) described an LPM2A-based assay for EBV quantification, with a shortened IS compared to that of the wild-type (WT) target. Bai et al. (2) described such an assay for EBV-encoded RNAs (EBER), with an elongated IS. However, for accurate quantification of the true amount of WT present in a sample, equal amplification efficiencies of WT and IS are required. Therefore, we developed an EBNA-1-based Q-PCR with an IS that has the same length and base composition as the WT target. EBNA-1 was chosen as the target, since this is a single-copy gene conserved in all clinical isolates of EBV. Mutation hot spots in EBNA-1 have been mapped previously (3, 21, 24), enabling selection of primers in a highly conserved region of this gene. For exact quantification of the amount of WT and IS product, an enzyme immunoassay (EIA) was de-veloped, a feature not present in the EBV Q-PCR assays described above. For samples exceeding the linear range of EIA, electrochemiluminescence (ECL) detection was devel-oped as an alternative detection system.
After validating the accuracy of quantification in vitro and in a whole-blood background, we evaluated the clinical applica-tion of Q-PCR by monitoring of EBV load in peripheral whole blood and serum from patients with different EBV-linked pro-liferative disorders.
MATERIALS AND METHODS
Cell lines.The EBV-positive Burkitt’s lymphoma cell lines Raji and Namalwa and the EBV-positive lymphoblastoid cell lines JY, B95.8, X50.7, and JC5 were cultured in RPMI medium (Bio Whittaker, Verviers, Belgium) containing 10% fetal calf serum (Bio Whittaker), 100 U of penicillin (Yamanouchi, Leiderdorp,
* Corresponding author. Mailing address: Department of Pathology, University Hospital Vrije Universiteit, de Boelelaan 1117, 1081 HV Am-sterdam, The Netherlands. Phone: 31204444023. Fax: 31204442964. E-mail: vandenbrule@azvu.nl.
2852
on May 15, 2020 by guest
http://jcm.asm.org/
The Netherlands) per ml, and 0.1 mg of streptomycin (Radiumfarma, Milan, Italy) per ml.
Patient samples.(i) A blind panel of peripheral blood samples (n⫽36) from four AIDS-related non-Hodgkin’s lymphoma (ARNHL) patients (patients A to D) sequentially collected between 1993 and 1996 was obtained from Slotervaart Hospital, Amsterdam, The Netherlands. EBV status of the lymphomas was determined by EBER in situ hybridization (8). Patients A, B, and D had an EBV-positive lymphoma, while patient C had an EBV-negative lymphoma. (ii)
Peripheral blood samples (n⫽50) from healthy, noncommercial blood donors
were obtained from the Eindhoven Blood Bank, Eindhoven, The Netherlands.
(iii) Peripheral blood samples from children with Burkitt’s lymphoma (n⫽19)
and their relatives (n⫽21) were obtained from R. Broadhead, Medical College,
University of Malawi, Blantyre, Malawi. (iv) Sera (n⫽12) from patients with
different EBV-related proliferative disorders (six with infectious mononucleosis
and three with nasopharyngeal carcinoma) and from healthy individuals (n⫽3)
were collected.
DNA extraction from peripheral blood, serum, and cultured cells.Fresh whole blood from healthy donors and ARNHL patients was diluted 10 times in NASBA lysis buffer (Organon Teknika, Boxtel, The Netherlands), containing 5 M gua-nidine thiocyanate, 0.25% Triton X-100, and 0.1 M Tris-HCl, pH 8.0. Lysed
samples were thoroughly vortexed and stored directly at⫺80°C in a volume of 10
ml until use. DNA was isolated from 1 ml of lysis solution by silica-based
extraction as described previously (4). DNA was eluted in 100l of water and
stored at⫺80°C. Five microliters of eluate, equivalent to 5l of whole-blood
sample, was used as input for each PCR.
Peripheral blood samples from Burkitt’s lymphoma patients were frozen in
liquid nitrogen and stored at⫺80°C. Frozen blood was thawed and immediately
lysed in NASBA lysis buffer, and nucleic acids were isolated as described above.
Cell line DNA was isolated by lysing 105cells in NASBA lysis buffer, followed
by silica-based extraction as described above.
DNA was isolated from 200l of serum by using the High Pure PCR Template
Preparation kit (Boehringer Mannheim, Mannheim, Germany) as described in the manufacturer’s protocol.
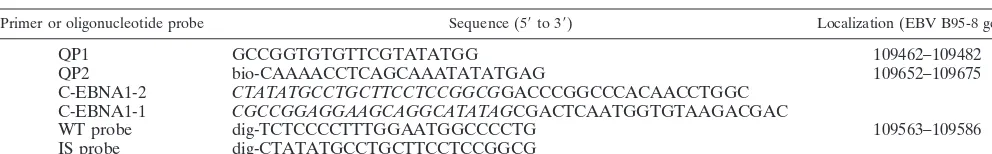
Primers and PCR.For nucleotide sequences and localization of primers, see
Table 1. Amplification reactions were carried out in a total volume of 50l, and
reaction mixtures contained 50 mM KCl, 1.5 mM MgCl2, 10 mM Tris (pH 8.5),
25 pmol of sense primer QP1, 25 pmol of biotinylated antisense primer QP2, 200
M (each) deoxynucleoside triphosphates, and 1 U of AmpliTaq DNA
polymer-ase (Perkin-Elmer, Emeryville, Calif.). For Q-PCR, thermal cycling conditions were as follows: 4 min at 95°C; 40 cycles at 95, 55, and 72°C for 1 min each; and finally 3 min at 72°C.
To ensure the validity of the results, several precautions as described previ-ously (12) were taken to avoid false positivity. In all experiments, appropriate negative controls were included and all clinical samples were screened blindly.
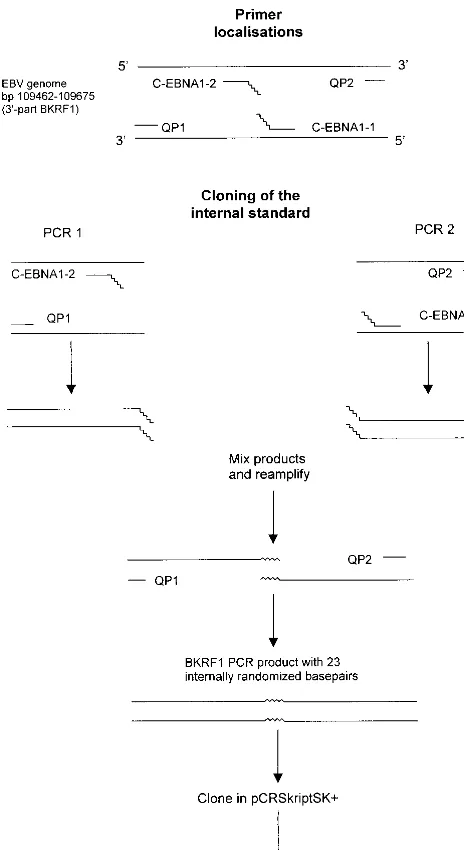
Cloning of IS and WT construct.The IS with 23 internally randomized bases was made by site-directed mutagenesis, as shown in Fig. 1. For this, primers
C-EBNA1-1 and C-EBNA1-2 with 23 randomized bases at the 5⬘ends were
designed (see Table 1 for primer sequences). Primers QP1 and C-EBNA1-2 and QP2 and C-EBNA1-1 were used to generate two PCR products containing
complementary, 5⬘sequence tags of 23 bp. PCR products were purified from an
agarose gel (Biozyme Easy-Pure kit; Biozyme, Landgraaf, The Netherlands), and
0.5l of each purified PCR product was mixed and reamplified, with primers
QP1 and QP2 (PCR conditions were the same as those for the Q-PCR described
below). The 213-bp PCR product was purified from a gel, polished withPfuDNA
polymerase, and cloned into theSrfI site of pCR-Script SK(⫹) (Stratagene, La
Jolla, Calif.) according to the manufacturer’s instructions, resulting in clone
pQPCR-8. Escherichia coli XL1-Blue MRF⬘ Kan was transformed with
pQPCR-8, and the plasmid was purified with a Maxiprep kit (Wizard; Promega, Leiden, The Netherlands). Plasmid concentration was determined by measuring the absorption at 260 nm. The WT target sequence was cloned into pCR-Script
SK(⫹) by direct amplification of B95.8 DNA with QP1 and QP2 primers.
The cloned fragment was sequenced on an ABI 373A automatic sequencer with dye terminators (Applied Biosystems, Emeryville, Calif.).
Analysis of PCR products by Southern blotting.Ten microliters of PCR product was analyzed by agarose gel electrophoresis and subsequently blotted on to a nylon filter (Qiabrane; Qiagen, Hilden, Germany) by alkaline capillary blotting as described previously (22). DNA was detected by radioactive
hybrid-ization with either WT- or IS-specific32P-labeled oligonucleotide probes (see
Table 1 for nucleotide sequence).
Quantification of PCR products by EIA.PCR products were quantified by EIA, with a modified procedure described previously for human papillomavirus
detection (7). Five microliters of biotinylated PCR product was diluted in 50l
of washing buffer (4⫻SSC [1⫻SSC is 0.15 M NaCl plus 0.015 M sodium citrate]
and 0.5% Tween 20) and captured on streptavidin-coated microtiter plates (Boehringer Mannheim). Plates were washed three times with washing buffer and twice with distilled water. DNA was denatured by 0.2 M NaOH for 15 min at room temperature, plates were washed twice with washing buffer, and either WT- or IS-specific digoxigenin-labeled oligonucleotide probes (See Table 1 for sequences) were added in a concentration of 50 pmol/ml of washing buffer. Plates were washed twice with washing buffer and once with distilled water. Antidigoxi-genin-alkaline phosphatase conjugate (Boehringer Mannheim) was added in a
1:10,000 dilution in washing buffer.p-Nitrophenylphosphate substrate (Sigma, St.
Louis, Mo.) was added, and absorption was measured at 405 nm, with 600 nm as the reference wavelength. All incubation steps were performed at 37°C for 1 h, unless otherwise stated. The log ratio of absorption values for WT and IS [log (WT/IS)] was plotted against the logarithm of the amount of added IS (log no. of IS).
The true amount of WT initially present in the quantified sample [log (WT
signal/IS signal)⫽0] was calculated by using linear regression.
ECL detection of PCR products.Five microliters of biotinylated PCR product
was diluted 1:1 in 2⫻binding and washing buffer (B&W buffer; 10 mM Tris, 1
mM EDTA, 2 M NaCl, pH 7.5) and captured with 7l of streptavidin-coated
M280 Dynabeads (Dynal A.S., Oslo, Norway) for 15 min. Beads were washed
with 1⫻B&W buffer and incubated with 0.1 M NaOH for 15 min. After wash
steps with 0.1 M NaOH, 1⫻B&W buffer, and Tris-EDTA, beads were incubated
with either WT or IS probe labeled with ruthenium bipyridine–N
-hydroxysuc-cinimide ester (50 pmol/ml in 4⫻SSC–0.5% Tween 20) at 41°C for 30 min. Beads
were washed with 4⫻SSC–0.5% Tween 20 and 1⫻B&W buffer. After addition
of 300l of ECL assay buffer (Organon Teknika), ECL counts were measured
by using a Nuclisens reader (Organon Teknika).
RESULTS
Development of Q-PCR. (i) Competition between WT and IS
in Q-PCR. For accurate quantification of EBV DNA load in
clinical specimens, it is required that WT and IS have the same amplification efficiencies. We therefore constructed an IS with a length and a base composition identical to those of the WT EBNA-1 target region as illustrated in Fig. 1. To demonstrate amplification equivalence of WT and IS, we first amplified a 10-fold dilution series of WT and IS (10⫺1 to 105 copies), followed by standard Southern blotting and hybridization with WT- and IS-specific probes, respectively. For both targets, at least 10 copies could be detected (Fig. 2). Identical analytical sensitivities were observed when dilutions were spiked in a whole-blood DNA background, indicating equal isolation effi-ciencies of WT and IS (data not shown). To investigate the competitive aspects of the Q-PCR, we made reconstruction series in which different amounts of WT and IS were compet-itively coamplified. For this, serial 10-fold dilutions of WT were spiked with serial 10-fold dilutions of IS in increasing concentrations. When equal amounts of WT and IS were present in PCR, equal signals were observed after Southern blot analysis (Fig. 3a). This indicates equivalent amplification efficiencies of WT and IS and illustrates the true competitive feature of the assay.
aItalics indicate randomized bases in primers used for construction of IS. Genome localization positions are indicated in nucleotides. bio, biotinylated; dig,
digoxigenin.
on May 15, 2020 by guest
http://jcm.asm.org/
[image:2.612.56.552.83.160.2](ii) Development of an EIA and ECL detection for
quanti-fication of PCR products. In order to exactly quantify the
amount of WT or IS product generated in PCR and to over-come the use of radioactive detection, an EIA using strepta-vidin-coated solid-phase capture of biotinylated amplicons and specific digoxigenin-labeled probe hybridization for detection was developed. The EIA was optimized for hybridization con-ditions and washing stringency, resulting in the procedure de-scribed in Materials and Methods. In EIA, the same sensitivity of detection was observed as on Southern blotting, i.e., 10 copies of WT or IS plasmid. Furthermore, equal absorption signals were observed when the same amounts of WT and IS were present in PCR in reconstruction experiments (Fig. 3b). We developed an alternative detection system based on ECL, which has a predicted wider dynamic range. By spiking
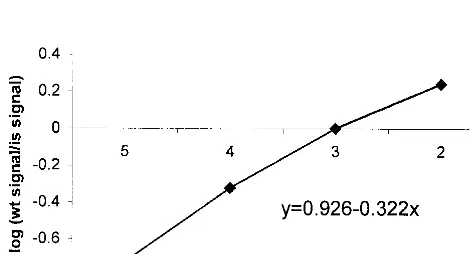
100 to 105 copies of IS plasmid DNA, we found that this method allows quantification of PCR products over a range of 5 logarithms (Fig. 4), providing a detection system for samples exceeding the linear range of measurement in EIA, which is limited to 4 logs. However, since ECL detection was more laborious, the optimized EIA was used for quantification of PCR product in all other experiments.
(iii) Validation of EBNA-1 Q-PCR. For validation of the
accuracy of quantification by Q-PCR, we repeatedly quantified a fixed amount of WT plasmid (1,000 copies). For this, 1,000
FIG. 1. Cloning of the IS. Primers C-EBNA1-1 and C-EBNA1-2 were de-signed with 23 randomized bases at the 5⬘end. Two separate PCRs with primers C-EBNA1-2 and QP1 and primers C-EBNA1-1 and QP2 were performed. Pu-rified PCR products were mixed and reamplified with primers QP1 and QP2. A
[image:3.612.343.521.72.170.2]BamHI K rightward frame 1 (BKRF1) PCR product with 23 internally random-ized bases compared to the wild-type gene was obtained and cloned into pCR-Script SK(⫹), giving pQPCR-8.
FIG. 2. Analytical sensitivity of EBNA-1 Q-PCR assay for WT and IS plas-mid DNA targets. WT or IS plasplas-mid DNA was quantified by spectrophotometry,
and dilution series ranging from 105to 10⫺1copies of the plasmid were amplified
in EBNA-1 PCR. PCR products were detected by Southern blotting and hybrid-ization with either WT- or IS-specific radiolabeled oligoprobe. Ten copies of both WT and IS target could be detected.
FIG. 3. Reconstruction series showing equal amplification of WT and IS. Serial 10-fold dilutions of WT were spiked with increasing amounts of IS in separate reactions. WT and IS were competitively coamplified in Q-PCR, and PCR products were detected by Southern blotting and hybridization with a specific radiolabeled oligonucleotide probe (a) or by EIA (b).
on May 15, 2020 by guest
http://jcm.asm.org/
[image:3.612.58.290.73.498.2]copies of WT plasmid spiked with 105, 104, 103, and 102copies of IS were coamplified in four separate reactions (see Fig. 5 for an example). The mean amount of WT measured in 12 inde-pendent experiments was 930⫾291 copies.
We also validated the assay for quantification of the authen-tic targets by determination of the EBV genome copy number in different EBV-positive cell lines, as shown in Table 2. We quantified 2 EBV genomes per Namalwa cell, 31 EBV ge-nomes per Raji cell, and⬍10 EBV genome copies per cell in the lymphoblastoid cell lines JY, JC5 and X50, numbers which closely resemble the data from the literature (1, 11, 14).
Clinical evaluation of Q-PCR. (i) EBV DNA in peripheral
blood samples of ARNHL patients.To evaluate the clinical use
of viral load monitoring in the genesis of malignant EBV-linked proliferative disorders, we determined EBV DNA levels in a blind panel of 36 peripheral blood samples from patients with ARNHL. All ARNHL patient samples were tested blindly, and after breaking the code, it was revealed that the population consisted of follow-up samples from four patients who developed ARNHL in time. EBV DNA load in these samples ranged from 0 to 120,000 genome equivalents/ml of blood.
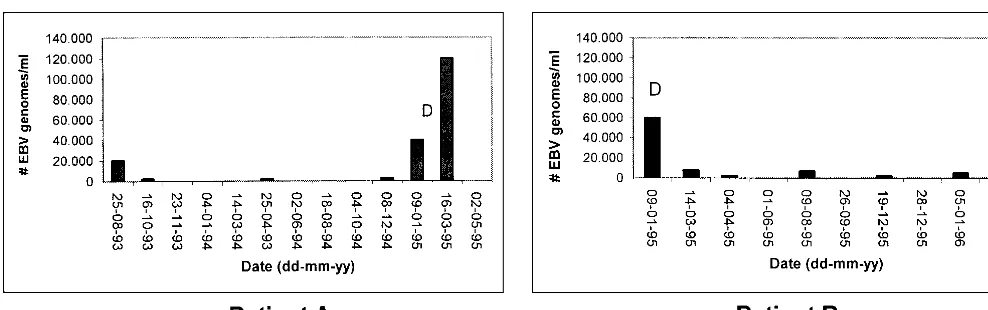
Patient A showed a large increase in peripheral blood viral load before diagnosis of ARNHL, beginning approximately 2 months prior to diagnosis. A strong decrease in blood EBV DNA levels was observed following initiation of cyclophosph-amide-doxorubicin-vincristine-prednisone (CHOP) therapy. Patient B showed high viral DNA levels at diagnosis, which dramatically decreased after CHOP treatment. This patient died of Kaposi’s sarcoma 15 months after diagnosis of ARNHL,
which was accompanied by increasing EBV levels (Fig. 6). For patients C (EBV-negative lymphoma) and D (EBV-positive lymphoma), no significant variation in EBV DNA levels was observed, both having levels of less than 6,000 copies/ml during the follow-up period. From patient C, only blood samples (n⫽ 8) after treatment with cyclophosphamide, vincristine, mitox-antrone, and radiotherapy were available, while patient D (five samples) remained untreated.
(ii) EBV DNA in peripheral blood of Burkitt’s lymphoma
patients. EBV DNA load was measured in peripheral blood
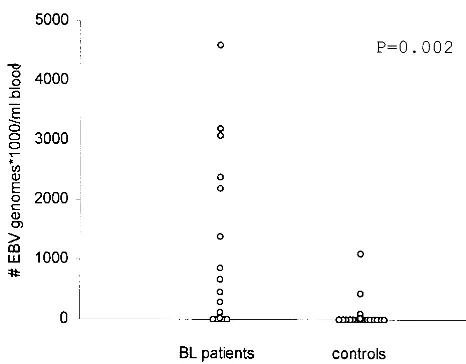
samples of 19 patients with Burkitt’s lymphoma. Four patients had viral loads of ⬍2,000 genomes/ml, while extremely high EBV loads were observed in all other patients, ranging from 21,000 to 4,591,000 genomes/ml. For the majority of the family members of these patients, mostly their mothers, viral loads of less than 2,000 genomes/ml of blood were observed, although some exhibited higher loads, up to 1 million EBV copies/ml in one relative (Table 3 and Fig. 7).
(iii) Screening of healthy donor blood samples.For
deter-mining baseline levels of EBV DNA load in healthy individu-als, we screened 50 random healthy donor whole-blood sam-ples from a regional, noncommercial blood bank in The Netherlands. We could demonstrate the presence of EBV DNA in 23 of these samples by a qualitative EBNA-1 PCR. Eighteen of 23 samples had viral loads of less than 2,000 copies of EBV/ml of blood, while 5 samples had higher values, rang-ing from 10,000 to 60,000 genomes/ml (Table 3).
(iv) EBV quantification in serum. In one of three tested
healthy donor serum samples, we could detect EBV loads above 1,000 genomes/ml. In one of three tested nasopharyn-geal carcinoma patient and one of six tested infectious
mono-Raji 31 50 (1)
Namalwa ⬍4 2 (14)
aAlthough numbers were not specifically determined for JY, JC5, and X50.7,
most lymphoblastoid cell lines have⬍10 EBV genome copies/cell (11). B95.8 is
[image:4.612.56.295.73.189.2]a producer cell line with a variable EBV genome copy number.
FIG. 4. Detection of amplified IS dilution series by ECL.
[image:4.612.55.290.557.684.2]FIG. 5. Quantification of WT plasmid DNA. One thousand copies of WT plasmid were spiked with 105, 104, 103, and 102copies of IS in four separate reactions and amplified in EBNA-1 PCR. PCR products were quantified by EIA, and the logarithm of WT signal/IS signal was plotted against the logarithm of the IS amount.
TABLE 3. EBV loads in different patient and control samples as determined by EBNA-1 Q-PCR
Sample type and source No. positive byQ-PCR/total no. testeda
No. of EBV genome copies/
ml (range)
Whole blood
Dutch blood bank donors 5/50 10,000–60,000
Malawi controls 7/21 2,500–1,085,100
Malawi Burkitt’s lymphoma patients 15/19 2,200–4,592,000
Serum
Healthy volunteers 1/3 4,000
Nasopharyngeal carcinoma patients 1/3 10,400 Infectious mononucleosis patients 1/6 9,500
aThese values are expressed as number of patients above limit of detection/ total number of patients tested.
on May 15, 2020 by guest
http://jcm.asm.org/
[image:4.612.313.553.591.709.2]nucleosis patient serum samples, we could detect EBV loads above 1,000 genomes/ml (Table 3).
DISCUSSION
In this study, an accurate and reproducible EBNA-1-based Q-PCR which enables quantification of peripheral EBV DNA blood load in a broad range of patients was developed.
We technically validated this EBNA-1-based Q-PCR by quantification of different amounts of plasmid containing the WT target sequence. Quantified amounts corresponded very well with input amounts of plasmid DNA, and accuracy of quantification compared favorably with those of similar tech-nologies (25). We determined EBV genome copy number in different EBV-positive cell lines and found numbers in accord with the literature. Spiking of vector DNA in whole blood revealed equal isolation and amplification efficiencies of WT and IS. We conclude that the competitive PCR accurately and reproducibly quantifies EBV with a sensitivity of about 10 DNA targets either in the presence or in the absence of a whole-blood DNA background. The quantitative EIA provides a rapid, reproducible, and nonradioactive method for detec-tion of PCR products and enables future use of the Q-PCR assay in routine diagnostic laboratories.
The majority of studies described thus far used either iso-lated peripheral blood mononuclear cells (18, 19) or B cells (23) for isolation of viral DNA. However, these methods are laborious and increase the probability of material loss. Fur-thermore, these methods do not isolate EBV DNA which may be present in serum, as has been recently reported for patients with nasopharyngeal carcinoma (17), Hodgkin’s disease (5), active EBV infection (13, 16), and ARNHL (13) and as de-tected for some patients in our study. We showed that the Q-PCR assay can be performed on DNA isolated from differ-ent clinical specimens including whole blood and serum. We prefer to use DNA isolated from lysed whole blood since this can be easily obtained and combines both blood compart-ments.
The use of whole blood directly diluted in guanidine thiocy-anate-containing lysis buffer dramatically reduces the number of steps required for sample preparation and risk of contami-nation and allows long-term conservation of nucleic acids. Since all nucleic acids are isolated simultaneously by
silica-based extraction, DNA and RNA analyses can be performed on the same isolate (4).
Studies comparing EBV loads in whole blood, peripheral blood mononuclear cells, B cells, and serum are required, however, to define which blood compartments harbor EBV and which are best suited for EBV load monitoring, since the presence of EBV in the different blood compartments may have different clinical values.
From screening of a blind panel of 36 follow-up peripheral blood samples from four ARNHL patients, it can be concluded that development of LPD in two of these patients is accompa-nied or preceded by increasing EBV DNA levels. In addition, both ARNHL patients showed decreasing peripheral blood EBV DNA loads after chemotherapy. Although the number of tested samples was small, our results indicate that whole-blood viral load monitoring by Q-PCR may indeed serve as a suitable diagnostic, prognostic, and monitoring tool for AIDS patients with EBV-linked proliferative disorders, as reported by La-roche et al. (13). These authors found elevated EBV loads in leukocytes of ARNHL patients compared to those of healthy donors, corresponding with detectable amounts of EBV DNA in the serum of these patients. The absence of elevated EBV DNA loads in patient C might be explained by the fact that this patient developed an EBV-negative lymphoma. For patient D, however, we also observed low EBV DNA loads, despite the fact that this patient developed an EBV-positive lymphoma. A larger number of ARNHL patients with EBV-positive and EBV-negative lymphomas must be monitored to further elu-cidate the phenomena observed for these two patients.
We found extremely elevated EBV DNA loads in the blood of African children with Burkitt’s lymphoma in comparison with those of their relatives. These levels by far exceed the levels found in ARNHL patients and controls and probably directly reflect the abundance of circulating tumor cells in this extremely aggressive childhood tumor. By combining the whole-blood sampling and the silica-based extraction protocol, it is possible to measure EBV DNA load, to study RNA ex-pression dynamics in the circulation of these patients, and to correlate these data with prognosis and therapy response. These studies are currently in progress.
[image:5.612.56.550.71.226.2]In the large majority of healthy donors, viral loads of less than 2,000 EBV genomes/ml of blood were observed. This is in agreement with the work of Bai et al. (2), who found EBV
FIG. 6. EBV load dynamics in peripheral blood of two patients with ARNHL. Patient A (left graph) was diagnosed for ARNHL in February 1995 and treated three times with CHOP therapy. This patient died in June 1995. Patient B (right graph) was diagnosed for ARNHL in January 1995 and treated three times with CHOP therapy and adriamycin-bleomycin-vincristine therapy. In December 1995, this patient was treated with foscavir for cytomegalovirus-associated retinitis. Patient B died in April 1996 due to Kaposi’s sarcoma. D, diagnosis of ARNHL.
on May 15, 2020 by guest
http://jcm.asm.org/
loads in healthy EBV-positive donors ranging from 350 to 1,950 genomes/ml of blood. We found five healthy donors with significantly higher EBV loads. Although no medical history of these donors was available, they were apparently healthy at the time of donation. Long-term monitoring of EBV load in healthy carriers will be necessary to differentiate natural from pathological EBV load dynamics. The changes in EBV load over time, as observed for the ARNHL patients, might be more informative than absolute values.
In conclusion, the Q-PCR assay allows accurate quantifica-tion of EBV DNA load in different clinical specimens, which is an essential prerequisite for analyzing the correlation between viral load and clinical parameters in different groups of tients. Reliable prediction of LPD development in AIDS pa-tients and transplant recipients enables earlier intervention in lymphomagenesis, which could reduce LPD-associated mor-bidity. The definition of cutoff values for risk assessment and demarcation of high-risk patients needs further study. At present, we are extending our study by monitoring of EBV load changes over time in different patient and control populations.
ACKNOWLEDGMENTS
This work was supported by European Community grant no. 1C18-CT96-0132.
We are grateful to Yoya Braams for technical assistance. We thank R. Broadhead and colleagues for providing peripheral blood samples from Burkitt’s lymphoma patients and their relatives.
REFERENCES
1.Adams, A.1987. Replication of latent Epstein-Barr virus genomes in Raji
cells. J. Virol.61:1743–1746.
2.Bai, X., G. Hosler, B. B. Rogers, D. B. Dawson, and R. H. Scheuermann.
1997. Quantitative polymerase chain reaction for human herpesvirus diag-nosis and measurement of Epstein-Barr virus burden in posttransplant
lym-phoproliferative disorder. Clin. Chem.43:1843–1849.
3.Bhatia, K., A. Raj, M. I. Guitierrez, J. G. Judde, G. Spangler, H. Venkatesh, and I. T. Magrath.1996. Variation in the sequence of Epstein-Barr virus nuclear antigen 1 in normal peripheral blood lymphocytes and in Burkitt’s
lymphomas. Oncogene13:177–181.
4.Boom, R., C. J. A. Sol, M. M. M. Salimans, C. L. Jansen, P. M. E. Wertheim-van Dillen, and J. Van der Noordaa.1990. Rapid and simple method for
purification of nucleic acids. J. Clin. Microbiol.28:495–503.
5.Drouet, E., P. Brousset, F. Fares, J. Icart, C. Verniol, F. Meggetto, D.
cervical smears after GP5⫹/6⫹PCR. J. Med. Virol.49:223–229.
8.Jiwa, N. M., P. Kanavaros, P. C. de Bruin, P. van der Valk, A. Horstman, W. Vos, H. Mullink, J. M. Walboomers, and C. J. L. M. Meijer.1993. Presence of Epstein-Barr virus harbouring small and intermediate sized cells in Hodgkin’s disease. Is there a relationship with Reed-Sternberg cells?
J. Pathol.170:129–136.
9.Kenagy, D. N., Y. Schlesinger, K. Weck, J. H. Ritter, M. M. Gaudreault-Keener, and G. A. Storch.1995. Epstein-Barr virus DNA in peripheral blood leukocytes of patients with posttransplant lymphoproliferative disease.
Transplantation60:547–554.
10. Kersten, M. J., M. R. Klein, A. M. Holwerda, F. Miedema, and M. H. van Oers.1997. Epstein-Barr virus specific cytotoxic T cell responses in HIV-1 infection: different kinetics in patients progressing to opportunistic infection
or non-Hodgkin’s lymphoma. J. Clin. Investig.99:1525–1533.
11. Kieff, E.1996. Epstein-Barr virus and its replication, p. 2343–2396.InB. N. Fields, D. M. Knipe, and P. M. Howley (ed.), Fields virology. Lippincott-Raven Publishers, Philadelphia, Pa.
12. Kwok, S., and R. Higuchi.1989. Avoiding false positives with PCR. Nature
339:237–238.
13. Laroche, C., E. B. Drouet, P. Brousset, C. Pain, A. Boibieux, F. Biron, J. Icart, G. A. Denoyel, and A. Niveleau.1995. Measurement by the polymerase chain reaction of the Epstein-Barr virus load in infectious mononucleosis
and AIDS-related non-Hodgkin’s lymphomas. J. Med. Virol.46:66–74.
14. Lawrence, J. B., C. A. Villnave, and R. H. Singer.1988. Sensitive high resolution chromatin and chromosome mapping in situ: presence and ori-entation of two closely integrated copies of EBV in a lymphoma line. Cell
52:51–61.
15. Lucas, K. G., R. L. Burton, S. E. Zimmerman, J. Wang, K. G. Cornetta, K. A. Robertson, C. H. Lee, and D. J. Emanuel.1998. Semiquantitative Epstein-Barr virus (EBV) polymerase chain reaction for the determination of pa-tients at risk for EBV-induced lymphoproliferative disease after stem cell
transplantation. Blood91:3654–3661.
16. Mouritsen, L., C. T. Wittwer, G. Reed, T. M. Khan, T. B. Martins, T. D. Jaskowski, C. M. Litwin, and H. R. Hill.1997. Detection of Epstein-Barr
viral DNA in serum using rapid-cycle PCR. Biochem. Mol. Med.60:161–168.
17. Mutirangura, A., W. Pornthanakasem, A. Theamboonlers, V. Sriuranpong, P. Lertsanguansinchi, S. Yenrudi, N. Voravud, P. Supiyaphun, and Y. Poo-vorawan.1998. Epstein-Barr viral DNA in serum of patients with
nasopha-ryngeal carcinoma. Clin. Cancer Res.4:665–669.
18. Riddler, S. A., M. C. Breinig, and J. L. C. McKnight.1994. Increased levels of circulating Epstein-Barr virus (EBV)-infected lymphocytes and decreased EBV nuclear antigen antibody responses are associated with the develop-ment of posttransplant lymphoproliferative disease in solid-organ transplant
recipients. Blood84:972–984.
19. Rooney, C. M., S. K. Loftin, M. S. Holladay, M. K. Brenner, and R. A. Krance.1995. Early identification of Epstein-Barr virus-associated
post-transplantation lymphoproliferative disease. Br. J. Haematol.89:98–103.
20. Rowe, D. T., L. Lu, J. Reyes, N. Jabbour, E. Yunis, P. Putnam, S. Todo, and M. Green.1997. Use of quantitative competitive PCR to measure Epstein-Barr virus genome load in the peripheral blood of pediatric patients and risk
of lymphoproliferative disorders. J. Clin. Microbiol.35:1612–1615.
21. Snudden, D. K., P. R. Smith, D. Lai, M. Ng, and B. E. Griffin.1995. Alterations in the structure of the EBV nuclear antigen, EBNA-1, in
epi-thelial tumours. Oncogene10:1545–1552.
22. Van den Brule, A. J. C., C. J. L. M. Meijer, V. Bakels, P. Kenemans, and J. M. M. Walboomers.1990. Rapid detection of human papillomavirus in cervical scrapes by combined general primer-mediated and type-specific
polymerase chain reaction. J. Clin. Microbiol.28:2739–2743.
23. Wagner, H. J., G. Bein, A. Bitsch, and H. Kirchner.1992. Detection and quantification of latently infected B lymphocytes in Epstein-Barr virus-sero-positive, healthy individuals by polymerase chain reaction. J. Clin. Microbiol.
30:2826–2829.
24. Wrightham, M. N., J. P. Stewart, N. J. Janjua, S. D. Pepper, C. Sample, C. M. Rooney, and J. R. Arrand.1995. Antigenic and sequence variation in the C-terminal unique domain of the Epstein-Barr virus nuclear antigen
EBNA-1. Virology208:521–530.
25. Zimmermann, K., and J. W. Mannhalter.1996. Technical aspects of
[image:6.612.53.286.70.252.2]quan-titative competitive PCR. BioTechniques21:268–279.
FIG. 7. Distribution of EBV loads in peripheral blood of Malawian Burkitt’s lymphoma (BL) patients and controls. Peripheral blood samples of patients were obtained at diagnosis. The control population consisted of patients’ relatives, mostly their mothers.