IJPSR (2012), Vol. 3, Issue 10 (Research Article)
Received on 11 July, 2012; received in revised form 18 September, 2012; accepted 29 September, 2012
A VALIDATED RP- HPLC METHOD FOR THE SIMULTANEOUS ESTIMATION OF PARACETAMOL AND NAPROXEN IN TABLET FORMULATION
Karuna B. Singh*, Shekhar B. Waikar and Suhas P. Padmane
Gurunanak College of Pharmacy, Nari, Kamptee road, Nagpur 440026, Maharashtra, India
ABSTRACT
The study describes a validated reverse-phase HPLC method for the simultaneous estimation of paracetamol and naproxen in bulk and in tablet formulation. The proposed RP-HPLC method utilizes Eclipse XDB C18column (150 ×4.6 mm i.d., 5 µm), optimum mobile phase consisted of gradient run of initial ratio of water (pH-2.5 adjusted with orthophosphoric acid): acetonitrile (87:13) with the effluent flow rate of 1.0 ml/min, and UV detection wavelength 263 nm. The developed method was statistically validated for linearity, precision, robustness, ruggedness and specificity. The method was linear over the range of 5-80 µg/ml for paracetamol and 3-48µg/ml for naproxen. The mean recovery was 99.72% and 100.88% for paracetamol and naproxen respectively. The intermediate precision data obtained under different experimental setup was quite concurrent with less critical % RSD. The proposed method can be useful in the quality control of paracetamol and naproxen in bulk drug and drug products.
INTRODUCTION: Paracetamol (PARA) chemically N- (4-hydroxyphenyl) acetamide is a well-known analgesic drug. It is an effective analgesic and antipyretic for the treatment of minor, noninflammatory conditions in patients who are prone to gastric symptoms. Naproxen (NAP), chemically 2-(6-methoxy-naphthalen-2-yl) propanoic acid is a nonsteroidal anti- inflammatory drug. It works by inhibition of cyclooxgenase, an enzyme involved in the arachidonic acid conversion pathway, resulting in a decrease of prostaglandin synthesis. It is used in the treatment of rheumatoid arthritis and other musculoskeletal disorders. The structures of these two drugs are shown in figure 1. Literature survey has revealed that several methods have been reported for estimation of paracetamol and naproxen individually, in bulk drug, formulations and biological samples by various analytical methods. UV- spectrophotometric assay of paracetamol in tablets
and urine samples had been reported 1. Several UV spectroscopic methods have been reported for estimation of paracetamol in combination with other drugs in various formulations 2-6. HPLC methods of paracetamol in combination with other drugs in various formulations 7-10 and in various biological samples 11, 12 have been reported. UV-spectroscopic method for estimation of naproxen from tablet formulation is available 13. HPLC methods of naproxen in combination with other drugs in pharmaceutical formulation 14-15 and in human urine 16 have been reported.
Keywords: Paracetamol,
Naproxen, RP-HPLC, Validation Correspondence to Author: Karuna B. Singh
Gurunanak College of Pharmacy, Nari, Kamptee road, Nagpur 440026, Maharashtra, India
E-mail: [email protected]
QUICK RESPONSE CODE
IJPSR: ICV- 4.57
HPTLC method for simultaneous estimation of paracetamol and naproxen in tablet formulation exists but the method does not define validation of method 17
. Hitherto, there are no HPLC methods available for estimation of paracetamol and naproxen in fixed dose combination formulation. The present study describes simple, precise and accurate reverse phase HPLC method for simultaneous determination of paracetamol and naproxen in tablet formulation.
MATERIAL AND METHODS:
Reagents and equipments: A gratuitous sample of pure paracetamol was obtained from Zim Laboratories, (Kalmeshwar, Nagpur) and naproxen from Ranbaxy Laboratories Ltd. (Gurgaon). HPLC grade acetonitrile, orthophosphoric acid and water were procured from Merck (Mumbai, India). Analytical reagent (AR) grade sodium hydroxide (NaOH) was purchased from Ranbaxy Laboratories, hydrochloric acid (HCl) from LOBA Chemie Pvt. Ltd (Mumbai, India) and hydrogen peroxide (H2O2) from S.D. Fine-Chem Ltd. (Boisar, India). Milipore 0.45µ Nylon filters for solvent filtration and 0.22 µ Nylon filters for sample filtration were used. Fixed dose combination tablet formulation of paracetamol and naproxen (Naprosyn-P, containing 500mg of parcetamol and 300mg of naproxen; RPG Lifesciences Ltd.) was purchased from the local market. The HPLC system consisted of Agilent HPLC 1200 System, Quaternary gradient pump G1311A with On Line Degasser G1322A, Variable wavelength UV-VIS detector aceG1314B, Eclipse XDB C18 column (150×4.6mm i.d., 5µm), Rheodyne injector 7725 I with 20 µl loop were used. Other equipments used were Digital pH meter (Labtronics LT-11, Mumbai), Balance Shimadzu AUY 220 (Japan), Sonicator (PCI Services, Mumbai) and Milipore filter assembly.
HPLC analysis of Samples: HPLC analysis was performed on both the drugs, and then on a mixture of drug solution. The mixture of water (adjusted to pH 2.5 with orthophosphoric acid) and acetonitrile (87:13) was used as diluent for the preparation of samples. The preliminary chromatographic conditions were set by injecting 20 µl standard solution of paracetamol and naproxen (20 µg/ml) prepared in diluent and the chromatograms were recorded for the drug. The mobile phase containing mixture of water (adjusted to
pH 2.5 with orthophosphoric acid) (A): acetonitrile (B) was used with run initially 13% of solvent B upto 2.8 min gradually increased to 50% upto 5.5 min. This ratio is maintained upto 6 min and finally solvent B was decreased gradually from 6-10 min to 13%. The flow rate was kept at 1.0 ml/min during gradient run with column temperature at 25oC. The chromatographic conditions were found to yield good separation with satisfactory retention time of about 3.005 min for paracetmol and 7.402 min for naproxen with sharp symmetrical peak (Figure 2).
Estimation of paracetamol and naproxen in tablet formulation: Twenty tablets were weighed and average weight was calculated. The tablets were crushed to fine powder. An accurately weighed quantity of tablet powder equivalent to 25 mg was sonicated with 15 ml methanol for 15 minutes and the volume was made to 25.0 ml with methanol. The solution was filtered and 1.0 ml of clear filtrate was diluted to 10.0 ml with diluent.The resultant solution (2.0ml) was further diluted to 10.0 ml with diluent, so that final concentration of 20µg/ml for paracetamol and 12µg/ml for naproxen on the basis of labeled claim was obtained. Five replicate sample solutions were prepared in similar manner.
Precision of method was ascertained by replicate analysis of homogeneous samples of tablet powder. To study linearity of method, a stock solution of mixed standard solution of both the drugs were diluted appropriately to yield solutions in the concentration of 5-80 µg/ml for paracetamol and 3-48 µg/ml for naproxen. The intermediate precision was established by injecting drug solutions on the same day and on consecutive three days, and also by two different analysts on the same day. The robustness of the method was established by deliberate change in detection wavelength by ±2 nm in the estimation of tablet.
Specificity of the method was established to ascertain how accurately and specifically the analyte of interest are estimated in presence of other components (e.g. impurities, degradation products and excipients) by exposing the tablet powder to different stress conditions such as normal, acid, alkali, light, heat and oxidation. Accurately weighed pre-analysed tablet
powder equivalent to about of 25 mg paracetamol was exposed to different stress conditions like normal (at room temperature), for hydrolytic stress in 1.0 ml each of 0.1N HCL and 0.1N NaOH at 50 ºC, for oxidation stress in 3% H2O2 at 50 ºC, for photolytic stress in sunlight and for thermal stress by heating at 60 ºC in different 25 ml volumetric flasks. After 24 hrs, all samples were cooled to room temperature, sonicated with 15 ml methanol for 15 min and volumes were made up to 25.0 ml with methanol. The solutions were then analyzed in a similar manner as described under estimation of tablets.
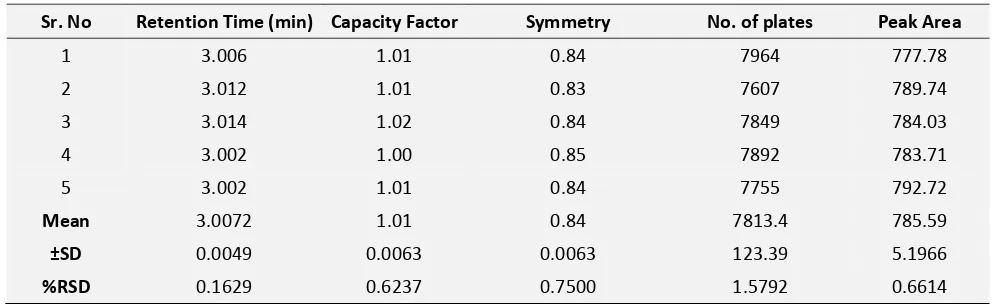
[image:3.612.57.558.361.513.2]RESULTS AND DISCUSSION: Paracetamol was eluted at tR 3.005 and naproxen at tR 7.042 with capacity factor values 1.01 and 3.95 respestively indicated good retention of both the drugs and high number of plates 7773.4 and 111068.4 per meter for paracetamol and naproxen respectively indicates substantially high efficiency of method, as shown in system suitability parameters (Table 1 and 2).
TABLE 1: SYSTEM SUITABILITY PARAMETERS OF PARACETAMOL
Sr. No Retention Time (min) Capacity Factor Symmetry No. of plates Peak Area
1 3.006 1.01 0.84 7964 777.78
2 3.012 1.01 0.83 7607 789.74
3 3.014 1.02 0.84 7849 784.03
4 3.002 1.00 0.85 7892 783.71
5 3.002 1.01 0.84 7755 792.72
Mean 3.0072 1.01 0.84 7813.4 785.59
±SD 0.0049 0.0063 0.0063 123.39 5.1966
[image:3.612.62.556.538.689.2]%RSD 0.1629 0.6237 0.7500 1.5792 0.6614
TABLE ІІ: SYSTEM SUITABILITY PARAMETERS OF NAPROXEN
Sr. No Retention Time (min) Capacity Factor Symmetry No. of plates Peak Area
1 7.400 3.95 0.83 112180 435.42
2 7.406 3.96 0.84 112369 435.26
3 7.402 3.95 0.83 112239 442.08
4 7.399 3.94 0.83 109220 438.91
5 7.403 3.95 0.82 109334 443.73
Mean 7.402 3.95 0.83 111068.4 439.08
±SD 0.0024 0.0063 0.0063 1464.39 3.4245
%RSD 0.0324 0.1594 0.7590 1.3184 0.7799
Validation of the developed method: The detector response was found to be linear over the range 5-80µg/ml for paracetamol and 3-48µg/ml for naproxen
regression equation of y=16.62x+114.6. Recoveries of the drugs were observed to be very close to 100% representing the accuracy of the method and also noninterference of excipients (Table 3). Replicate estimations (n=5) of paracetamol and naproxen in tablet by proposed method have yielded 98.81% labeled claim with % RSD of 0.7027 for paracetamol and 100.33% of labeled claim with %RSD of 1.1957 for
naproxen, indicating good precision of method. The results of estimation by proposed method on different days and by different analysts were very much reproducible with maximum %RSD of 0.5517 for paracetamol and 0.6305 for naproxen (Table 4). This indicates the ruggedness of the method in the hands of different analyst and on different time intervals.
TABLE 3: RESULT OF RECOVERY STUDIES OF PARACETAMOL AND NAPROXEN
Sr. No. Amount of standard added (mg) Area Amount of standard recovered (mg) % Recovery
PARA NAP PARA NAP PARA NAP PARA NAP
1 - - 544.63 319.09 - - - -
2 3.75 2.24 633.30 354.69 3.77 2.28 100.53 101.78
3 7.5 4.49 754.16 424.86 7.36 4.53 98.13 100.89
4 11.25 6.74 869.08 483.18 11.27 6.67 100.17 98.96
5 15.00 8.98 1001.46 563.95 15.01 9.15 100.06 101.89
Mean 99.72 100.88
± SD 0.9357 1.1743
[image:4.612.34.586.177.529.2]%RSD 0.9380 1.1640
TABLE 4: RESULTS OF RUGGEDNESS STUDIES
Observations
% Drug estimation
Intra- day Inter-day Different Analyst
PARA NAP PARA NAP PARA NAP
I 99.58 100.24 100.69 99.87 99.58 100.87
II 99.88 100.95 99.86 100.25 99.22 99.81
III 100.52 99.58 99.36 99.23 100.25 99.33 Mean 99.99 100.25 99.97 99.78 99.68 100.03
± SD 0.3920 0.5594 0.5485 0.4208 0.4267 0.6433 %RSD 0.3920 0.5580 0.5486 0.4217 0.4280 0.6433
The variations in detection wavelength by ±2 nm have shown significant change in the area of paracetamol with deviation of ±15% of standard area. Whereas naproxen does not show any change in its area. In cases of specificity studies, paracetamol and naproxen were unaffected by acid, alkali, thermal and photolytic stress conditions. However, oxidative stress condition showed significant degradation of paracetamol to 28.8% and 89.16% for naproxen.
DISCUSSION: The present study highlights the benefit of the use of the method for simultaneous estimation of both the drugs. The results of assay of paracetamol and naproxen tablet obtained by proposed HPLC
method are quite concurrent and reproducible. The recovery of the drugs from matrix was about 100% with %RSD <2 indicating accuracy and reliability of method with non- interference of excipients. Paracetamol and naproxen were found to be unstable in oxide stress conditions, whereas it was much stable in acidic, alkali, thermal stress conditions and in sunlight. At the same time method is simple, rapid, reasonably specific and rugged.
ACKNOWLEDGEMENT: The authors are thankful to Zim Laboratories, (Kalmeshwar, Nagpur) and Ranbaxy Laboratories Ltd. (Gurgaon), India, for providing the gift sample of paracetamol and naproxen and also to Gurunanak College of Pharmacy, Rashtrasant Tukadoji Maharaj Nagpur University, Nagpur, for providing the facilities necessary to carry out research work.
REFERENCES:
1. Knochen, M., Giglio, J., Boaventura, F., J. Pharm. Biomed. Anal.
33, 191-197.
2. Erk, N., Ozkan, Y., Banoglu, E., Ozkan, S.A., Senturk, Z., J. Pharm. Biomed. Anal. 24, 469-475.
3. Xu, C., Li, B., Spectrochim. Acta. Part A. 60, 1861-1864.
4. Goicoechea, H.C., Olivieri, A.C., J. Pharm. Biomed. Anal. 2, 255-261.
5. Dinc, E., J. Pharm. Biomed. Anal. 21, 723-730. 6. Altun, M.L., Turk J.Chem. 26, 521-528. 7. Battu, P.R., Asian J. Res. Chem. 2, 70-72.
8. Al-Rimawi, F., Saudi. Pharm. J 18, 103-106.
9. Franeta, J.T., Agbaba, D., Eric, S., Pavkov, S., Aleksic, M., Il Farmaco 57, 709-713.
10. Arayne, M.S., Sultana, N., Siddiqui, F.A., J. Chinese Chem. Soc
56, 169-174.
11. Li, H., Zhang, C., Wang, J., Jiang, Y., Fawcett, J.P., Gu, J., J. Pharm. Biomed. Anal. 51, 716-722.
12. Wamorkar, V., Santhosh, P., Manjunth, S.Y., J. Pharm. 8, 2633-2635.
13. Haque, T., Talukder, M., Laila, S., Fatema, K., Pak. J. Pharm. Sci.
23, 379-383.
14. Mondal, S., Haque, A., Islam, S., Islam, S.A., J. App. Pharm. Sci.
01, 145-148.
15. Monser, L., Darghouth, F., J. Pharmaceut. Biomed. Anal. 32, 1087-1092.
16. Mikami, E., Goto, T., Ohno, T., Matsumoto, H., Nishida, M., J. Pharm. Biomed. Anal. 23, 917-925.
17. Sethi PD. HPTLC Quantitative Analysis of Pharmaceutical Formulations. 1st ed. India: 1996.
18. ICH, Q2 (R1), Validation of Analytical Procedures: Text and Methodology, International Conference on Harmonization, IFPMA, Geneva, 2005.
How to cite this article: