BIROn - Birkbeck Institutional Research Online
Pesaran, M.H. and Smith, Ron P. and Yamagata, T. and Hvozdyk, L. (2009)
Pairwise tests of purchasing power parity. Econometric Reviews 28 (6), pp.
495-521. ISSN 0747-4938.
Downloaded from:
Usage Guidelines:
Please refer to usage guidelines at or alternatively
BIROn
-
B
irkbeck
I
nstitutional
R
esearch
On
line
Enabling open access to Birkbeck’s published research output
Pairwise tests of purchasing power parity
Journal article
http://eprints.bbk.ac.uk/2862
Version: Post-print (refereed)
Citation:
© 2009 Taylor & Francis
Publisher Version at: http://dx.doi.org/10.1080/07474930802473702
______________________________________________________________
All articles available through Birkbeck ePrints are protected by intellectual property law, including copyright law. Any use made of the contents should comply with the relevant law.
______________________________________________________________
Deposit Guide
Contact: lib-eprints@bbk.ac.uk
Birkbeck ePrints
Birkbeck ePrints
Pairwise Tests of Purchasing Power Parity
∗
M. Hashem Pesaran
†Ron P. Smith
‡Takashi Yamagata
§Lyudmyla Hvozdyk
†Faculty of Economics, CIMF, and USC,
University of Cambridge, Cambridge, CB3 9DD, UK
‡Department of Economics, Birkbeck College, London, WC1E 7HX, UK §CFAP, Judge Business School, University of Cambridge, Cambridge CB2 1AG, UK
Faculty of Economics, University of Cambridge, Cambridge, CB3 9DD, UK
March 2007
Abstract
Given nominal exchange rates and price data on N + 1 countries indexed by i = 0,1,2, ..., N, the standard procedure for testing purchasing power parity (PPP) is to apply unit root or stationarity tests toN real exchange rates all measured relative to a base coun-try,0, often taken to be the US. Such a procedure is sensitive to the choice of base country, ignores the information in all the other cross rates and is subject to a high degree of cross section dependence which has adverse effects on estimation and inference. In this paper we conduct a variety of unit root tests on all possibleN(N+ 1)/2real rates between pairs of the N+ 1countries and estimate the proportion of the pairs that are stationary. This proportion can be consistently estimated even in the presence of cross-section dependence. We estimate this proportion using quarterly data on the real exchange rate for 50 countries over the period 1957-2001. The main substantive conclusion is that to reject the null of no adjustment to PPP requires sufficiently large disequilibria to move the real rate out of the band of inaction set by trade costs. In such cases one can reject the null of no adjustment to PPP up to 90% of the time as compared to around 40% in the whole sample using a linear alternative and almost 60% using a non-linear alternative.
JEL Categories: C23, F31, F41
Keywords: Purchasing Power Parity, Panel Data, Cross Rates, Pairwise Approach, Cross
Section Dependence.
∗We are grateful to Yunus Aksoy, George Kapetanios, Haris Psaradakis, Mark Taylor, two anonymous
1
Introduction
There exists a large literature on the empirical validity of the purchasing power parity (PPP) hypothesis that tests real exchange rates for stationarity. Given data on N + 1 countries indexed by i = 0,1,2, ..., N, the standard procedure is to construct N real exchange rates against a base country, 0, often taken to be the US. But in practice the test results tend to be quite sensitive to the choice of the base country. For example, it could be that the real exchange rate between a pair of countries is stationary, but their real exchange rates computed separately against the US could be non-stationary. The fact that PPP held between this pair would be lost by just focussing on the US dollar real exchange rates. The standard procedure, in effect, ignores the additional information contained in the other real cross-rates.1 A closely related issue is that there tends to be a high degree of residual cross-section dependence, which may reflect the base country effect or other unobserved common factors, that are difficult to eliminate by conditioning on observables such as oil prices. Neglect of the cross-section dependence has adverse effects on the properties of estimators and tests, and can lead to misleading conclusions. There are also issues of aggregation. Even if individual relative prices adjust quickly, aggregate price indices may not adjust so quickly because the patterns of expenditures in the two countries are very different. In addition heterogeneity in the speeds of adjustment of the individual goods may bias the aggregate or panel estimate of the speed of adjustment towards zero. Imbs et al. (2005), document this heterogeneity bias.
In this paper, we conduct unit root tests using all possible N(N + 1)/2 pairs of real exchange rates amongst the N + 1 countries and estimate the proportion of the pairs that reject the null of no adjustment to PPP. This approach, asking what proportion of real cross-rates are stationary, seems the natural way to try to test PPP and uses all the information in the data. Not only is it invariant to base country effects, but the proportion of country pairs that are non-stationary is consistently estimated despite the cross section dependence of the pairwise tests. We use three ADF type tests, which have the null hypothesis of no adjustment and the alternative of linear adjustment2, and the Kapetanios, Shin and Snell (2003; KSS hereafter) test which has the null of no adjustment and the alternative of non-linear adjustment. These four tests are applied to quarterly cross real exchange rates for 50 countries over the period 1957q1-2001q4. The small sample distribution of the proportion of rejections of the ADF type tests is investigated using a factor augmented sieve bootstrap procedure.
The pairwise approach clearly shows that the null of no adjustment to PPP is rejected in cases where there are sufficiently large disequilibria so that the real rate is outside the "band of inaction" set by trade-related costs. When there are such disequilibria and the variance of the change in the real rate is large, we show that one can reject the null of no adjustment up to 90% of the time with a linear alternative as compared to around 40% for the whole sample with a linear alternative and almost 60% of the time with a non-linear alternative.
1Infinancial econometrics where the focus is on prediction of nominal exchange rates, currency
arbi-trage ensures that no additional information is contained in the nominal cross rates over and above what is observed in the US dollar rates. But this need not be true of the real cross rates which are central to the PPP hypothesis.
2We also used the stationary tests due to Kwiatkowski, Phillips, Schmidt and Shin (1992, KPSS),
The outline of the remainder of the paper is as follows. Section 2 discusses some of the issues in testing the PPP hypothesis that are pertinent to the approach of this paper. Section 3 describes the pairwise approach. Section 4 applies it to the real exchange rate data. Section 5 contains some concluding comments.
2
Issues in Testing PPP
Empirical tests of the PPP hypothesis are subject to a number of considerations. Taylor and Taylor (2004) provide a recent survey of the various issues involved. Here we shall focus on a few of these that are important within our pairwise approach. The PPP hypothesis follows from an arbitrage condition, the law of one price: any divergence between the price of a good in two countries, expressed in a common currency net of trade costs, should cause trade or other market forces to operate causing adjustment towards equality. For countries i = 0,1,2, ..., N, with the US as country zero, the logarithm of the real exchange rate between country iand country j is given by:
qijt =eijt+pjt −pit = ln(EijtPjt/Pit),
where Eijt is the nominal exchange rate (units of currency i per unit of currency j) and Pit andPjt are measures of prices. Define the real rate against the US dollar,
qit=qi0t =ei0t+p0t−pit
then since Eijt = Eit/Ejt, the real exchange rate between any other pair of countries i, j 6= 0 can be calculated as
qijt =qit−qjt. (1)
Suppose the equilibrium real exchange rate isq∗
ijt,and adjustment takes the following simple form:
∆qijt =λijt(q∗ij,t−1−qij,t−1) +δij∆qij,t−1+εijt, (2)
where λijt is the speed of adjustment, E(εijt|Ft−1) = 0, E(εijt2 |Ft−1) = σ2ijt, and Ft−1
is the information available at time t−1. Higher order lags of ∆qijt are included in the empirical sections below.
The speed of adjustment, λijt, and the variance of the shocks, σ2
ijt, may not only be time varying, but as we will argue later, could be related. Note thatσijt=pV ar(∆qijt|Ft−1)
should not be confused with the conditional covariance of the real US dollar rates,qit and qjt, defined byωijt =Cov(qit, qjt|Ft−1). Sinceqijt =qit−qjt, we have
σ2ijt =ω2it+ω2jt−2ωijt,
where ω2it =V ar(qit|Ft−1).
rates and conclude that, while choice of price index is important, a large fraction of real exchange ratefluctuations is due to deviations from the law of one price for traded goods. Given this, the hypothesis of interest is no adjustment to PPP, namely
H0 :λijt = 0,
with the alternative, H1 :λijt>0.
2.1
Trade Costs and Band of Inaction
Suppose that the real exchange rate was initially in equilibrium and there were no shocks, σ2
ijt = 0. The pair-wise real exchange rates would then be such that qijt = qijt∗ in every period; the speed of adjustment would not be identified. Observed disequilibria are needed in order to identify the speed of adjustment. In practice, because of trade and other transactions costs, discussed for example by Anderson and van Wincoop (2004) and Novy (2006), the equilibrium rate will not be given by a point value such as q∗ijt, but is best characterized by a band, bijt = (¯qijt∗ , q∗ijt), where adjustments are most likely when realized value of qijt falls outside this band. The adjustments are further complicated by the time varying nature of the band. Within this “band of inaction”, which in some cases could be quite wide, the price disparity is not large enough to outweigh the costs of arbitrage. If the variance of the shocks, σ2
ijt, is small relative to the size of the band, (¯q∗
ijt, q∗ijt), qijt may stay within the band behaving like a random walk, again indicating no purposeful adjustment. If the variance of the shocks,σ2ijt,is large relative to the band, the real exchange rate is more likely to cross the threshold and one is more likely to get evidence of the adjustments towards PPP.
This observation has motivated a range of non-linear models of real exchange rates, an early example is Michael et al. (1997). However, it is not clear how one would choose appropriate non-linear functions for a wide variety of cross-rates. These models tend to make the speed of adjustment a function of the size of the disequilibrium, qij,t∗ −1 −
qij,t−1; but it may be very difficult to measure the equilibrium and, under the null of no
adjustment, the disequilibrium is not well defined. The size of the band will be commodity specific, since trade costs differ by commodity, and this raises issues of aggregation across commodities. We will allow for this possibility by using the KSS test, which allows for a non-linear alternative.
a government defending an over-valued fixed rate are different from those defending an undervalued one. Whatever the source of the shocks or the form of the adjustment, to get precise estimates ofλijt,which are significantly different from zero, requires that σ2ijt is large relative to the band of inaction around equilibrium.
2.2
Panel Unit Root Tests Applied to Real Exchange Rates
Typically, using time-series data on real exchange rates measured against the US dollar for developed countries over the post Bretton Woods period, one cannot reject the hypothesis of no adjustment. This is particularly so if one assumes a constant speed of adjustment, namely testing λijt = λij = 0 in (2). Taylor and Taylor (2004, p.153) comment that “empirical work could find only the flimsiest evidence in support of purchasing power parity”.3 However, the evidence for PPP is stronger using century-long spans of data. This is partly because the power of the test depends on the span, the number of years, not the number of observations and partly because long spans tend to show periods of high variances, e.g. resulting from wars or political crises. Cross-section regressions of the percentage change in the exchange rate against inflation differentials also tend to yield coefficients very close to unity, again partly because of the higher cross-sectional variation as compared to the time variation of real exchange rates. The failure to rejectλijt = 0in the case of time-series with a short-span can be attributed to the low power of unit root tests applied to the individual series and one response has been to try to increase power by using panel unit root tests.
The application of the panel unit root tests to real exchange rates, however, encounters three main difficulties:
(i) Since the null hypothesis of panel unit root tests is that all the series have a unit root, then the hypothesis can be rejected even if the proportion of the series for which the unit root null is rejected is rather small. The test is not informative about the extent to which the rejection of the null hypothesis is pervasive. The pairwise approach directly addresses the question of what proportion of the real rates are stationary.
(ii) The presence of unobserved common factors complicates the application of the panel unit root test to real exchange rates. As originally noted by O’Connell (1998) panel unit root tests tend to over-reject (thus spuriously favouring PPP) if there are significant degrees of error cross section dependence and this is ignored by the panel unit root tests. One possible common factor is the very persistent long swings in the value of the US dollar because of its status as a reserve currency. Such a persistent factor may bias the time series tests that use individual US dollar real exchange series against PPP, whilst the bias might go in an opposite direction in the case of panel unit root tests if the cross-section dependence induced by the common factor is ignored. The use of more recent panel unit root tests such as the ones proposed by Bai and Ng (2004) and Moon and Perron (2004), and Pesaran (2007a) that allow for possible cross section dependence through unobserved common factors go some way towards rectifying the problem. But their applications to real exchange rates are complicated by the uncertainties surrounding the number of unobserved factors, the nature of the unit root process (whether it is common or country specific), and the fact that longer data spans are required for modelling the cross section dependence.4
3Embedding the real exchange rate equation in long-run structural macroeconometric models as done
in Garratt et al. (2006) seems to provide evidence which is more supportive of the PPP hypothesis.
(iii) The use of panel unit root tests in the case of the PPP also necessitates that the real exchange rates included in the panel are all measured against a common currency, and is therefore subject to the choice of the numeraire currency, which is not innocuous. As noted in the introduction, it is possible for the real exchange rates of countriesiandj to be non-stationary when measured against a third numeraire currency, but stationary when measured against one another. This would be the case when there is a highly persistent factor that is common to countriesi andj, but is not shared by the numeraire country.
The pairwise approach, used in this paper, deals with the above issues by focussing on all possible real exchange rate pairs thus avoiding the need to choose a reference currency, provides consistent estimates of the proportion of non-stationary or stationary real rates which is reasonably robust to cross section dependence, and is likely to be more informative about the pervasiveness of the PPP across countries than the standard results from panel unit root tests. The pairwise approach also has implications for effective real rates, defined as trade weighted averages of all the pairwise rates. The effective real rate for countryiwill beI(0) if all the pairwise rates for that country areI(0)(given non-zero trade weights that add up to unity) andI(1)if some of the pairwise rates areI(1),though time varying weights complicate the issue.5
3
The Pairwise Approach
We consider tests using all possible N(N + 1)/2distinct pairs of real exchange rate qijt, i, j = 0,1, ..., N, for i 6=j, amongst the N + 1 countries and estimate the proportion of the pairs that are stationary, using a variety of tests, initially assuming no time-variation in the speed of adjustment in (2), i.e. λijt =λij. As argued in Pesaran (2007b), where a similar approach is applied to output and growth convergence, the average rejection rate is likely to be more robust to the possibility of an I(1)unobserved factor, inducing cross-section dependence, than the alternative methods available.
Consider the following factor model for the US dollar real exchange rate:
qit =αi+γ0ift+εit. (3)
There is an I(0) idiosyncratic component, εit, and the common factors, ft, which induce cross-section dependence and might be I(0), I(1) and not cointegrated, or I(1) and cointegrated. Some of these factors could be observable such as level of international oil prices, whilst other factors such as technology, trade agreements and advances in storage facilities and transportation might be only partly observable. In general
qijt = (αi−αj) + (γi−γj)0ft+εit−εjt, (4)
will beI(0)if eitherft isI(0), or ifft isI(1)and cointegrated or ifft isI(1)andγi =γj. Consider now the application of the augmented Dickey-Fuller or the KSS test of order pij to qijt, t = 1,2, ..., T, and denote the null hypothesis of the test by H0 : λij = 0,
and the alternative that the process is stationary by, H1 : λij > 0. Let ZijT = 1 if
ADFijT(pij) < KT,p,α,where KT,p,α is the critical value for the ADF(pij) test of size α
panel unit root tests. For applications of these tests to real exchange rates measured against the US dollar see Choi and Chue (2007), Moon and Perron (2007) and Pesaran (2007a).
applied to T observations such that limT→∞Pr(ADFijT(pij) < KT,p,α | H0) = α. The
fraction of the N(N + 1)/2pairs for which the unit root null is rejected is given by
ZN T = 2 N(N + 1)
NX−1
i=0
N X
j=i+1
ZijT. (5)
Using the approach in Pesaran (2007b), it can be shown that if the idiosyncratic compo-nents,εit,are independent, underH0, ZN T is a consistent estimator ofα for largeN and
T. First it can be shown that
lim
T→∞E(ZN T |H0) =α.
Derivation of the variance is complicated by the fact thatZijtandZiktare not independent even if the idiosyncratic components εit are independent across countries. However, the dependence arises only between overlapping pairs, likeZijtandZikt,that share a country, i in this case. It does not arise between non-overlapping pairs, like Zijt andZkmt, which do not share a country. The set of independent non-overlapping countries grows withN. SinceZijT is a discrete(0,1)indicator, all its moments exist and the maximum variances and covariances of ZijT arefinite. Using these insights Pesaran (2007a) shows that
V ar(ZN T |H0) =O
µ 1 N
¶ .
Since underH0,the expected of value ofZN T goes toαasT → ∞, and the variance goes
to zero asN increases,ZN T converges in quadratic mean toα, asN andT → ∞jointly, with no restriction on the order at which they go to infinity.
If PPP is true, and H1 holds everywhere, then we would expect ZN T to be large,
converging to unity for large N and T. If PPP is false, H0 holds everywhere, we would
expect ZN T to be close to the size of the test. When T is finite, the proportion ZN T converges to αT, the empirical rejection frequency of the test. The average rejection frequency also converges to αT as N → ∞. Increasing the panel dimension reduces the sampling variation of the estimated proportions. In principle, it would be possible to develop a formal statistical test of whether the estimated proportion of rejections is significantly greater than the size of the test. In practice, the magnitude of the proportion of rejections is of more economic interest and it is that proportion that will be the focus of our analysis.
4
Pairwise PPP Tests
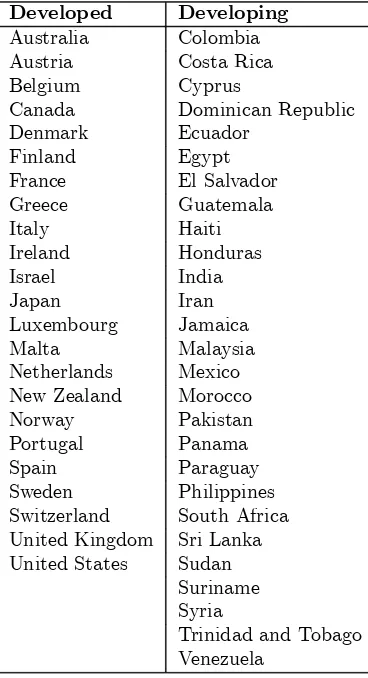
maintainedfixed exchange rates against the US, and the sub-period 1974q1-2001q4, when floating rates became more common. We also considered sub-group of countries, split into 23 developed countries and 27 developing countries. Table 1 lists the countries.
We set the nominal size of the tests at 10%. We consider three cases for the de-terministic components: Case II includes just intercept, Case III intercept and a linear trend, and Case II/III where the trend is included if it is significant at the 5% level on a standard t-test. We use four tests: the standard ADF, the ADF-GLS of Elliott et al. (1996), the ADF-WS of Park and Fuller (1995) and the KSS test. All four tests have the null of a unit root. The ADF-GLS and ADF-WS are designed to have higher power than the standard ADF. The lag orders, pi, of the ADF(pi) regressions are determined either by the Akaike Information Criterion, AIC, or by the Schwarz Bayesian Criterion, SBC. We set the maximum lag, pmax, to be 6. Results were very similar when pmax was set at
12. With three cases for deterministics, four tests and two lag order selection criteria, we have 24 test statistics for each country pair, (i, j). This allows us to check the sensitivity of the rejection rates to the test used, to the treatment of deterministic components and to the lag order selection procedure.
To motivate the KSS test, consider a univariate smooth transition autoregressive model of order 1, STAR(1), with the exponential transition function
∆qit =φiqi,t−1+ηiqi,t−1[1−exp(−ψiq
2
i,t−1)] +εit,
where exp( . ) is the exponential function. Following Michael et al. (1997), the non-linear effect is assumed to be a function of qi,t−1, although higher order lags can also be
considered. A null hypothesis considered by KSS is a special case of a linear unit root which implies φi = 0 and ψi = 0. Under the alternative hypothesis, φi = 0 and ψi >0, with qit following a nonlinear but globally stationary process on the assumption that
−2 < ηi < 0. Imposing φi = 0 and then using first-order Taylor series approximation, KSS propose basing the unit root test on the auxiliary regression with lag-augmentation
∆qit˜ =δiq˜i,t3 −1+
pi
X
=1
ϕi ∆qi,t˜ − + it, (6)
where qit˜ is demeaned/detrended qit. For the KSS test, the procedure in CaseII/III is to first run regressions of qit on an intercept and a linear trend, then qit is detrended if the linear trend is significant at 5% level test or just demeaned if not. Lag order pi is chosen by AIC and SBC. The null is H0 :δi = 0, the alternative is H1 : δi <0, and the
Table 1: Country Groupings
Developed Developing
Australia Colombia Austria Costa Rica Belgium Cyprus
Canada Dominican Republic Denmark Ecuador
Finland Egypt France El Salvador Greece Guatemala Italy Haiti Ireland Honduras Israel India Japan Iran Luxembourg Jamaica Malta Malaysia Netherlands Mexico New Zealand Morocco Norway Pakistan Portugal Panama Spain Paraguay Sweden Philippines Switzerland South Africa United Kingdom Sri Lanka United States Sudan
Suriname Syria
Trinidad and Tobago Venezuela
4.1
Results
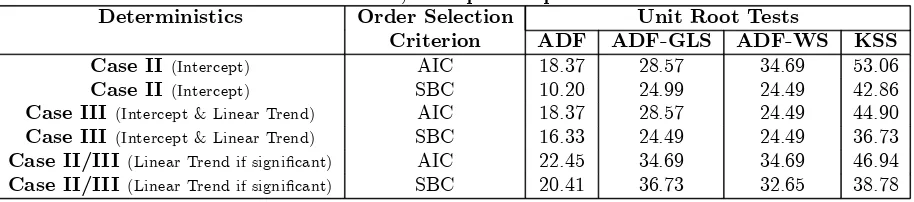
Table 2: Fraction of Real US Dollar Rates, qit, for Which the Null Hypothesis of Unit Root is Rejected at 10% Significance Level, for 49 Countries Over the Full Sample
Period, 1957q1-2001q4
Deterministics Order Selection Unit Root Tests
Criterion ADF ADF-GLS ADF-WS KSS
Case II(Intercept) AIC 18.37 28.57 34.69 53.06
Case II(Intercept) SBC 10.20 24.99 24.49 42.86
Case III(Intercept & Linear Trend) AIC 18.37 28.57 24.49 44.90
Case III(Intercept & Linear Trend) SBC 16.33 24.49 24.49 36.73
Case II/III(Linear Trend if significant) AIC 22.45 34.69 34.69 46.94
Case II/III(Linear Trend if significant) SBC 20.41 36.73 32.65 38.78
Data Source: International Financial Statistics.
Notes: ADF is a standard Dickey-Fuller unit root test, ADF-GLS is Elliott et al. (1996) test, ADF-WS is Park and Fuller’s (1995) weighted symmetric test, and KSS is Kapetanios et al. (2003) test against stationary nonlinear alternatives. Unit root tests are conducted at 10% significance level forN= 49real exchange rates measured against US dollar,T= 180
observations. Augmentation orders, pi, of the underlying ADF(pi)(and KSS(pi)without deterministics) regression are
chosen by AIC and SBC withpmax= 6, then the fractions of the rejected cross sections are computed. Under Case II, only
intercept is included; under Case III, both intercept and linear trend are included; and under Case II/III, linear trend is included when significant at 5% level. In Case II/III, Case III was chosen 61.22% of the time with AIC and 46.94% with SBC in ADF regressions and 93.88% in the case of the KSS test.
Table 3: Fraction of Real US Dollar Rates, qit, for Which the Null Hypothesis of Unit Root is Rejected by ADF-WS and KSS Tests at 10% Significance Level, Case II/III
(Trend Included When Significant at 5%)
ADF-WS KSS
Full Sample Sub-Samples Full Sample Sub-Samples
Country Groupings 1957q1-2001q4
(T=180)
1957q1-1973q4
(T=68)
1974q1-2001q4
(T=112)
1957q1-2001q4
(T=180)
1957q1-1973q4
(T=68)
1974q1-2001q4
(T=112)
All Dollar Rates (49) 34.69 26.53 30.61 46.94 38.78 40.82
Developing (27) 33.33 25.93 33.33 70.37 40.74 59.26
Developed (22) 36.36 27.27 27.27 18.18 36.36 18.18
Data Source: International Financial Statistics (IFS).
Notes: ADF-WS is Park and Fuller’s (1995) weighted symmetric test. Unit root tests are conducted at 10% significance level, real exchange rates measured against US dollar for all 49 currencies, for the 27 currencies in developing countries, and the 22 currencies of the developed countries all against US dollar; for the whole period, 1957q1-2001q4,T = 180quarters; and the sub-periods 1957q1-1973q4,T = 68quarters; and 1974q1-2001q4,T = 112quarters. Augmentation orders,pi,
of the underlying ADF(pi) regression are chosen by AIC with pmax = 6. KSS is Kapetanios et al. (2003) test against
stationary nonlinear alternatives, which is based on thet-ratio ofδiin the regression∆q˜it=δiq˜it3+
Spi
=1ϕi∆q˜it− +error,
whereq˜itis demeaned and/or detrendedqit.q˜itis demeaned and detrendedqit,if a linear trend is significant in the initial
regression ofqit on an intercept and a linear trend. Augmentation orders, pi, of the underlying KSS(pi) regression are
chosen by AIC with pmax = 6. Unit root tests are conducted at 10% significance level, real exchange rates measured
against US dollar for all 49 currencies, for the 27 currencies in developing countries, and the 22 currencies of the developed countries all against US dollar; for the whole period, 1957q1-2001q4,T = 180quarters; and the sub-periods 1957q1-1973q4, T = 68quarters; and 1974q1-2001q4,T = 112quarters.
similar patterns but higher rejection rates except for the whole sample and second sub-sample for developed countries. The rejection rate for the full sub-sample among developing countries is over 70%. Of course, these are very small samples and some features cannot be revealed by the US dollar rates, e.g. whether PPP holds between pairs of developing countries.
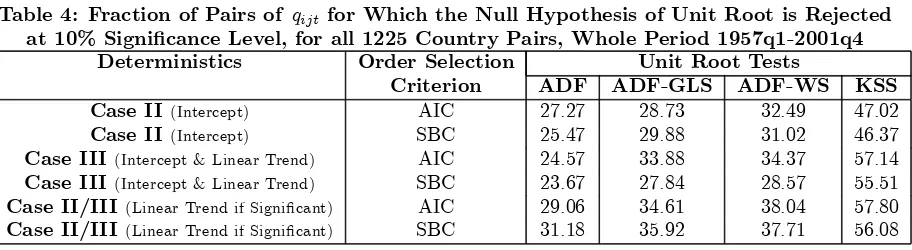
Table 4: Fraction of Pairs of qijt for Which the Null Hypothesis of Unit Root is Rejected at 10% Significance Level, for all 1225 Country Pairs, Whole Period 1957q1-2001q4
Deterministics Order Selection Unit Root Tests
Criterion ADF ADF-GLS ADF-WS KSS
Case II(Intercept) AIC 27.27 28.73 32.49 47.02
Case II(Intercept) SBC 25.47 29.88 31.02 46.37
Case III(Intercept & Linear Trend) AIC 24.57 33.88 34.37 57.14
Case III(Intercept & Linear Trend) SBC 23.67 27.84 28.57 55.51
Case II/III(Linear Trend if Significant) AIC 29.06 34.61 38.04 57.80
Case II/III(Linear Trend if Significant) SBC 31.18 35.92 37.71 56.08
Data Source: International Financial Statistics (IFS).
Notes: ADF is a standard Dickey-Fuller unit root test, ADF-GLS is Elliott et al. (1996) test, ADF-WS is Park and Fuller’s (1995) weighted symmetric test, and KSS is Kapetanios et al. (2003) test against stationary nonlinear alternatives. Unit root tests are conducted at 10% significance level for49×50/2 = 1225distinct pairs ofqijt,i6=j,T = 180observations.
For 27 currencies in developing countries, and 22 currencies of the developed countries all against US dollar; for the whole period, 1957q1-2001q4,T = 180quarters; and the sub-periods 1957q1-1973q4,T = 68quarters; and 1974q1-2001q4, T = 112quarters. Augmentation orders,pij, of the underlying ADF(pij) (and KSS(pij) without deterministics) regressions
are chosen by AIC and SBC withpmax= 6. Under Case II, only intercept is included; under Case III, both intercept and
linear trend are included; and under Case II/III, linear trend is included when significant at 5% level. In Case II/III, Case III was chosen 54.45% of the time with AIC and 43.84% with SBC in the ADF(pij) regressions, and 91.51% in the KSS
test. See also the notes to Table 3.
trend we can reject the hypothesis in the majority of cases, with around 57% rejection. In the US dollar case it was the just intercept case that had the highest rejection frequency. In all but one case, rejection rates based on the KSS test are higher using all pairs than using just rates against the US dollar.
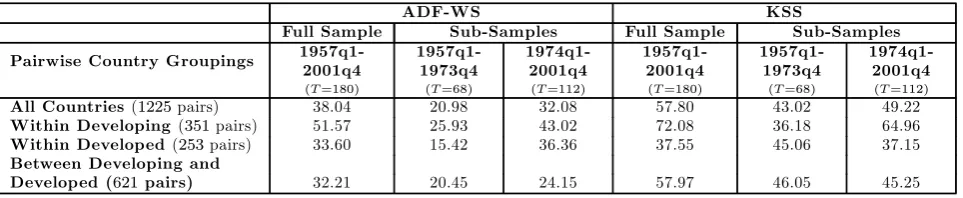
[image:14.595.73.555.535.634.2]Table 5 reports the rejection frequency for the ADF-WS and KSS tests by sub-samples. We split the sample of 50 countries into three groups. Thefirst is the pairwise real rates between 27 developing countries (giving 351 pairs); the second between 23 developed countries (including the US, giving 253 pairs); and the third between developed and developing countries (with 621 pairs). The sample is also split into two sub-periods: 1957q1-1973q4, T = 68, and 1974q1-2001q4, T = 112. We report rejection frequencies by AIC, at 10% significance level, Case II/III, (trend included when significant at 5%), with a maximum lag of 6. In the ADF-WS test for the developing countries over the whole period, the rejection rate is just over a half. This is consistent with there being more evidence for PPP where there is more volatility. The 23 developed countries had a mean quarterly inflation rate of 1.56 with standard error (from an autoregression with lag order chosen by AIC) of 1.44. The 27 developing countries had a mean of 2.60, not quite twice as high, but a standard error of 3.30, more than twice as large. The proportion of rejections is lower for the earlier less volatile period, Bretton Woods, when rates were more likely to befixed, than the later period, when they were more likely to be floating and nominal exchange rate volatility was higher. For the whole period and the floating period, the proportion of rejections was lower between developed and developing country pairs, which includes developing country rates against the US dollar, than either between developed pairs or developing pairs. Unlike the US dollar rates, the pairwise rates tell a consistent story: there are more rejections for developing countries and for the second period. The fact that over half of the developing country pairs reject no adjustment could not have been discovered using the real rates against the US dollar alone. For KSS test, rejection rates are higher, 72% for within developing countries for the whole period, but the patterns are similar.
Table 5: Fraction of Pairs of qijt for Which the Null Hypothesis of Unit Root is Rejected by ADF-WS and KSS Tests at 10% Significance Level, Case II/III (Trend Included When
Significant at 5%)
ADF-WS KSS
Full Sample Sub-Samples Full Sample Sub-Samples
Pairwise Country Groupings
1957q1-2001q4
(T=180)
1957q1-1973q4
(T=68)
1974q1-2001q4
(T=112)
1957q1-2001q4
(T=180)
1957q1-1973q4
(T=68)
1974q1-2001q4
(T=112)
All Countries(1225pairs) 38.04 20.98 32.08 57.80 43.02 49.22
Within Developing(351pairs) 51.57 25.93 43.02 72.08 36.18 64.96
Within Developed (253pairs) 33.60 15.42 36.36 37.55 45.06 37.15
Between Developing and
Developed (621pairs) 32.21 20.45 24.15 57.97 46.05 45.25
Data Source: International Financial Statistics (IFS).
Notes: ADF-WS is Park and Fuller’s (1995) weighted symmetric test. Unit root tests are conducted at 10% significance level for 1225 distinct pairs of qijt, i 6= j, for all 50 countries, within 27 developing countries (351 pairs), within 23
developed countries (253), and between developing and developed countries (621pairs); for the whole period, 1957q1-2001q4,T = 180quarters; and the sub-periods 1957q1-1973q4, T = 68quarters; and 1974q1-2001q4,T = 112quarters. Augmentation orders,pij, of the underlying ADF(pij) regression are chosen by AIC and SBC with pmax = 6. KSS is
Kapetanios et al. (2003) test against stationary nonlinear process, which is based on thet-ratio ofδijin the regression
∆q˜ijt=δijq˜3ijt+
Spij
=1ϕij∆q˜ijt− +error, whereq˜ijtis demeaned and/or detrendedqijt.q˜ijtis demeaned and detrended
qijt,if a linear trend is significant in the initial regression ofqijton an intercept and a linear trend. Augmentation orders,
pij, of the underlying KSS(pij) regression are chosen by AIC withpmax = 6. Unit root tests are conducted at 10%
significance level for 1225 distinct pairs of qijt, i 6= j, for all 50 countries, within 27 developing countries (351 pairs),
within 23 developed countries (253), and between developing and developed countries (621pairs); for the whole period, 1957q1-2001q4, T = 180 quarters; and the sub-periods 1957q1-1973q4, T = 68quarters; and 1974q1-2001q4, T = 112
4.2
Factor Augmented Sieve Bootstrap Estimates
So far we have focussed on the point estimates of the proportion of the pairwise tests that reject the null of no PPP. In this sub-section we consider the precision of those estimates for the case of a linear alternative. Specifying an appropriate non-linear model is more problematic and will not be attempted here. The positive cross-section dependence between the test outcomes is likely to increase the uncertainty considerably. Analytical derivation of the standard errors of the proportions appears to be intractable, therefore we adopt a factor augmented sieve bootstrap approach to provide some evidence on the precision of the estimated proportions. It is now standard in the literature to interpret the cross-section dependence in terms of a factor model. We follow this literature and estimate the parameters of an underlying factor model directly and use these estimates to bootstrap the pairwise rejection rates, treating this factor model as an approximation to the true data generation process. Whereas in some contexts the factors themselves are of interest, here they are nuisance variables which induce cross-section dependence, but need to be controlled for if we are to obtain satisfactory estimates of rejection frequencies and their precision. We conduct the bootstrap for all countries, N = 50, and the full sample period, T = 180, using the ADF-WS-AIC at the 10% level with a maximum lag of 6, including a linear trend if significant.
The model we use for the US dollar real rates, qit, i= 1,2, ..., T,t = 1,2, ..., T, is:
qit = α0idt+γ0ift+εit,
∆εit = λiεit−1+
pi
X
=1
ψi ∆εi,t− +νit,
∆fst = μ0sdt+φfs,t−1
ps
X
=1
ξs∆fs,t− +est, s= 1,2, ..., m,
where dt = (1, t)0 is a vector of deterministic elements, (intercept and trend), and ft is a m× 1 vector of unobserved factors, with elements fst. The factors, fst, and/or the idiosyncratic elements εit may beI(0)orI(1).6
There is no consensus in the literature about how to estimate factors (e.g. using estimated or a priori weights) or how to determine how many factor are required, thus it is not clear how to best approximate the true process. We use two factors: the cross section averages of real rates against the US dollar for all 49 countries, qt¯, and for 27 developing countries,qdt¯ . Using equal weights corresponds to those used in the Correlated Common Effect (CCE) estimator of Pesaran (2006), though estimates of factors tend not to be very sensitive to choice of the weights.7 Then ADF(p) regressions are estimated for qt¯ andqdt¯ ,
∆qt¯ = ˆμ+ ˆφqt¯−1+
p X
=1
ˆ
b ∆qt¯− + ˆet, (7)
and
∆qdt¯ = ˆμd+ ˆδdt+ ˆφdqd,t¯ −1+
pd
X
=1
ˆbd∆qd,t¯
− + ˆedt, (8)
6Note that the Correlated Common Effect (CCE) estimators are valid even if the common factors are
I(1)and possibly cointegrated. For a proof see Kapetanios, Pesaran, and Yamagata (2006).
7The six criteria suggested by Bai and Ng (2002) indicated either one or two factors, when the
where the lag-ordersp and pd are chosen by AIC, with a maximum lag of 6 and a trend is included if significant (which it was for qdt¯ ). The unit root null was tested, using the ADF-WS-AIC with maximum lag being 6 at 10% level, and could not be rejected. Given the uncertainty about whether the common factors are I(1), we carried out the bootstraps under two assumptions: (a) not imposing unit roots on the factors and using the freely obtained estimates, φˆ andφˆd, or (b) imposing unit roots on the factors on the basis of the pretest results, setting φˆ = 0and φˆd= 0, and allowing for a drift in qdt.¯ For case (b) we estimate:
∆qt¯ =
p X
=1
ˆ
a ∆qt¯− +bt, (9)
and
∆qdt¯ = ˆκd+
pd
X
=1
ˆ
ad∆qd,t¯ − +bdt. (10)
Comparison of the results from the two cases allows us to assess the effect of any downward T-bias inφˆ. As noted above assuming that the factors have a unit root does not necessarily imply a unit root in qijt, the factors may cancel out.
US dollar real rates are regressed on the factors to give the estimated model
qit = ˆαi+ ˆδit+ ˆγiqt¯ + ˆγidqdt¯ + ˆεit, (11)
where the trend is included if significant. The estimates are given in the supplementary Table S1 at the end of the paper. The adjusted R2 varies from 0.016 (Mexico) to 0.981
(Panama) with a mean of 0.705 across the countries; the common factors explain a substantial proportion of the US dollar real rates.8
Using the above estimates, the bootstrapped samples of qit are generated in the fol-lowing manner.
Step 1: (a) When unit roots are not imposed on the factors, the rth replication of the common factors,q¯t(r) and q¯dt(r), are generated as
¯
qt(r) = ˆμ+ (1 + ˆφ)¯q(t−r)1+ p X
=1
ˆb∆q¯(r)
t− +e
(r)
t , (12)
and
¯
qdt(r)= ˆμd+ ˆδdt+ (1 + ˆφd)¯q(d,tr)−1+ pd
X
=1
ˆbd ∆q¯(r)
d,t− +e
(r)
dt, t= 1,2, ..., T, (13)
wherer= 1,2, ..., R, and the parameter estimates are computed as in (7) and (13). e(tr)is a random draw with replacement from{etˆ}Tt=1, ande
(r)
dt is a random draw with replacement from {ˆedt}T
t=1. The processes are initialized by (¯q (r)
−p,q¯
(r)
−(p−1), ...,q¯ (r) 0 ) =
(¯q1,q¯2, ...,qp¯+1), and (¯q (r)
d,−p,q¯
(r)
d,−(p−1), ...,q¯ (r)
d0) = (¯qd1,qd¯2, ...,qd,p¯ +1).
8We also investigated using the principal component approach advanced in Bai and Ng (2004) in the
case of unit root processes. When the cumulative sums of the first two principal components of the standardised∆qit were used as explanatory variables forqit, the adjustedR2 varied from 0.017 to 0.984
with a mean of 0.708, which is almost identical to using the cross section averages,q¯tandq¯dt. We favour
(b) Under the case where unit roots are imposed on the factors,q¯t(r)andq¯dt(r)are generated by
¯ q(tr) = ¯q
(r)
t−1+
p X
=1
ˆ
a ∆q¯t(−r) + (tr), (14)
and
¯
qdt(r) = ¯qd,t(r)−1+ ˆκd+ pd
X
=1
ˆ
ad∆q¯(d,tr)− + (dtr), (15)
where (tr) and
(r)
dt are draws with replacement from {bt}Tt=1 and {bdt}Tt=1,
respec-tively, and dynamics are initialised as before.
Step 2: The rth replication ofqit is generated as
qit(r)= ˆαi+ ˆδit+ ˆγiq¯t(r)+ ˆγidq¯
(r)
dt +ε
(r)
it ,r = 1,2, ..., R, (16)
where
ε(itr) = ˆηi+ (1 + ˆλi)ε
(r)
i,t−1+
pi
X
=1
ˆ ψi ∆ε
(r)
i,t− +υ
(r)
it , (17)
υ(itr) are random draws with replacement from {ˆυit}T
t=1, and ε (r)
it are initialised us-ing(ε(i,tr)−pi, ε(i,tr)−(p
i+1), ..., ε
(r)
i0 ) = (ˆεi,1,ˆεi,2, ...,ˆεi,pic+1). The estimates,αi,ˆ ˆδi,ˆγi, ... are computed by OLS using the realizations ofqit,qt¯, andqdt¯ . The lag-order,pi, are cho-sen by AIC with a maximum lag of 6, using the estimated residuals from regressions of qit on qt¯, and qdt,¯ as set out in (11).
Step 3: We computed the fraction of the pairs qijt(r) = qit(r) − q(jtr) for which the null hypothesis is rejected by the test. Call this fractionπ(r). The test used is the 10%
ADF-WS-AIC with trend included if significant.
[image:17.595.95.526.89.191.2] [image:17.595.76.530.585.624.2]Step 4: Repeat steps 1 to 3, R = 2000 times, to obtain the empirical distribution of π(r).
Table 6. Distribution of the Bootstrapped Fraction of Rejections (Point Estimate 38.04%)
Mean Median SD 5% 10% 90% 95%
Without Imposing Unit Roots on Factors 58.66 58.53 13.28 34.20 37.14 79.92 82.86 With Imposing Unit Roots on Factors 37.94 35.22 13.98 17.14 19.43 65.96 70.37
Notes: The bootstrap results are based on 2000 replications, using ADF-WS unit root tests (Park and Fuller, 1995) conducted at 10% significance level for1225distinct pairs of qijt, i 6=j, for all 50 countries for whole period,
1957q1-2001q4,T= 180,trend included if significant, with augmentation orders,pij, of the underlying ADF(pij) regression chosen
by AIC withpmax= 6.
Table 6 gives means, medians, standard deviations and four quantiles for the empirical distribution of π(r) in both cases (imposing and not imposing unit roots on the factors).
when it is. However, the error band around the mean estimate is rather wide, largely due to the strong positive dependence that exists across the test outcomes. Nevertheless, the 95% confidence interval does not cover 10%, the value we would expect if the null of no PPP were true everywhere. In the case with unit roots in the factors the confidence intervals are not symmetric about the mean; with the interval above the mean being much wider than the one below the mean. It is clear that cross-section dependence introduces a large degree of uncertainty into the estimate of the proportion of rejections.
4.3
Evidence on PPP and Real Exchange Rate Volatility
We now examine the relationship between frequency with which the hypothesis of no PPP is rejected and the (unconditional) volatility of real exchange rates, σ∆qij, (measured by the standard deviation of∆qijt). For this purpose we rely on the ADF-WS-AIC unit root test results, with a maximum lag order of 6, and a linear trend if statistically significant. Irrespective of whether qijt has a unit root or not, ∆qijt is a stationary process so the standard deviation of the change in the real exchange rate is generally well defined. In addition, ∆qijt shows very little serial correlation, on average none of the first twelve autocorrelations are above 0.07 in absolute value and 8 of the 12 are negative.
There is clearly a positive relationship between the rejection frequency and the volatil-ity of the shocks. In a probit regression explaining whether the null of no PPP was rejected or not,σ∆qij is highly significant. A similar conclusion also emerges from Table 7, where the rejection rates are shown for various ranges of σ∆qij. Since the mean of σ∆qij is 0.1 and its distribution is bimodal, with a break at 0.15, bands of 0.05 provide a natural division. Rejection frequencies rise with σ∆qij, slowly at first then very sharply. Among the 147 cases with σ∆qij greater than 0.15, null of no PPP is rejected in 129 cases, a rejection rate of 88%. Among the cases with very volatile real exchange rates, evidence for PPP is almost universal. It is clear that a higher σ∆qij is associated with a higher rejection rate of no PPP hypothesis.
Table 7: Fraction of qijt for Which the Null Hypothesis of Unit Root is Rejected by ADF-WS and KSS Tests at 10% Significance Level, Case II/III (Trend Included When
Significant at 5%), by Ranges of Standard Deviation of ∆qijt
ADF-WS KSS
Ranges of Standard Deviation of ∆qijt
Number of ∆qijt
Fraction of Rejections*
Number of ∆qijt
Fraction of Rejections
0-0.05 200 27.00 214 35.51
0.05-0.1 614 31.60 620 51.94
0.1-0.15 229 38.86 239 72.38
>0.15 147 87.75 147 93.20
Data Source: International Financial Statistics (IFS).
Notes: Fraction of rejections stands for fraction ofqijt for which the unit root hypothesis is rejected. ADF-WS is Park
and Fuller’s (1995) weighted symmetric test. Unit root tests are conducted at 10% significance level for1225distinct pairs ofqijt,i6=j, for all 50 countries for whole period, 1957q1-2001q4,T = 180. Augmentation orders,pij, of the underlying
ADF(pij) regression are chosen by AIC and SBC with pmax = 6, then the fractions of the rejected pairs over1225 are
computed. Cases with positive t statistics are excluded. KSS is Kapetanios et al. (2003) test against stationary nonlinear alternatives, which is based on thet-ratio ofδijin the regression∆q˜ijt=δijq˜ijt3 +
Spij
=1ϕij ∆q˜ijt− +error, whereq˜ijtis
demeaned and/or detrendedqijt.q˜ijtis demeaned and detrendedqijt,if a linear trend is significant in the initial regression
ofqijt on an intercept and a linear trend. Augmentation orders,pij, of the underlying KSS(pij) regression are chosen by
AIC withpmax= 6. Unit root tests are conducted at 10% significance level for1225distinct pairs ofqijt,i6=j, for all 50
countries for whole period, 1957q1-2001q4, T = 180.∆qijt with positive t statistics are excluded (35 pairs for ADF-WS
Table 8: Fraction of Positive and/or Significant Non-Linear Adjustment Coefficients (λ1ij)
All Pairs (1225)
Developed Pairs (253)
Developing Pairs (351)
% With Positive Sign 71.10 67.19 72.36
% Significant at 5% Level 35.43 17.79 46.15
% Significant at 10% Level 43.35 24.51 52.14
Data Source: International Financial Statistics (IFS).
Notes: For allN(N+ 1)/2distinct pairs, the model∆qijt= (λ0ij+λij1|∆qij,t−1|)(cij−qij,t−1) +S
pij
k=1δ
k
ij∆qij,t−k+εijt,
for i, j = 0,1, ..., N, t = 1,2, ..., T, is estimated by non-linear least squares over the period, 1957q1-2001q4, T = 180. Augmentation orders,pijare chosen by AIC withpmax= 6.
The results above show that there is a cross-section relationship between the size of the shocks and the significance of the adjustment coefficient. To investigate the time series variation in the speed of adjustment, consider the model introduced in (2):
∆qijt =λijt(q∗ij,t−1−qij,t−1) +
pij
X
k=1
δkij∆qij,t−k+εijt, (18)
where q∗
ij,t−1 = cij is assumed constant. Also suppose that the speed of adjustment
depends on the absolute size of the lagged shock:
λijt =λ0ij+λij1 |∆qij,t−1|. (19)
As noted above, much of the literature makes the speed of adjustment a function of the size of the disequilibrium, (q∗
ij,t−1 −qij,t−1), but this is sensitive to measurement of the
disequilibrium and the disequilibrium is not well defined under the null, that PPP does not hold. However, in many cases one might expect the speed of adjustment to reflect the size of the shock.
The real exchange rate series, particularly for developing countries, are character-ized by large sudden movements often associated with collapse of highly misaligned real rates or onset of hyperinflation, which provide very public signals of the need for rapid adjustment of prices or exchange rates. Under this assumption, equation (18) can be rewritten
∆qijt=¡λ0ij +λ
1
ij|∆qij,t−1|
¢
(cij −qij,t−1) +
pij
X
k=1
δkij∆qij,t−k+εijt,
which can be estimated by non-linear least squares.9 The lag order, pij, is estimated by AIC with maximum lag of 6.10 This was estimated for all the pairs, for the pairs between developed countries and for the pairs between developing countries. Over two thirds of the estimates of λ1ij were positive as one might expect them to be if larger shocks cause faster adjustments. At the 10% level, just over half of the non-linear adjustment terms, λ1ij were significant for the developing country pairs, just under half in all pairs. The results are summarized in Table 8. Thus there seems quite strong evidence that larger shocks cause faster adjustments, particularly for developing countries where large shocks
9We also tested the errors,ε
ijt, for autoregressive conditional heteroscedasticity (ARCH), but found
that the null of constant error variances is rejected at the 5% level only in the case of 21.6% of the regressions.
10For all pairs, developed pairs and developing pairs, the average lag chosen by the AIC withp max= 6
are more common, though there is clearly scope for further work on the time varying nature of the adjustment process.
To summarise, using the pairwise approach and the data on all real cross-rates reveals a number of features that one would miss if one confined attention to rates against the US dollar, for example some of the main characteristics of exchange rates variations between developing countries. This is true for both linear and non-linear tests. The larger samples also allow more precise estimates of the rejection frequencies, though the cross-section dependence tends to substantially reduce the precision with which one would hope to estimate the rejection frequencies. Using all pairwise rates gave higher rejection frequencies than when just using real rates against the US dollar, and the pairwise results show more consistent patterns and less sensitivity to the unit root test used, treatment of deterministics and lag order selection procedure. It is clear that rejecting the no PPP null requires large shocks to the changes in the real exchange rates. Where the shocks were largest rejection of no PPP was almost 90%, and for real cross-rates between developing countries, where shocks are also large, no PPP was rejected in over half the cases for the linear test and over 70% for the non-linear test. For the whole sample, no PPP was rejected in around 40% of the cases using the linear test and almost 60% using the non-linear test, substantially more than the 10% one would get if PPP did not hold anywhere. There was also further evidence for PPP in the more volatile post 1974 period, than in the less volatile Bretton Woods period. Observed disequilibrium is the key to rejecting the hypothesis of no adjustment to equilibrium and there is both cross section and time series evidence that larger shocks are associated with more significant adjustment coefficients.
In Pesaran et al. (2006) we also applied the pairwise procedure to the monthly disaggregate data for 19 goods, and 12 countries over the period 1981-1995. This was the data used by Imbs et al. (2005). On the disaggregate data the results were less clear cut because of shorter span and greater noise. The estimated proportion of rejections confirmed Imbs at al.’s conclusion that there was more evidence against no adjustment at the disaggregate than at the aggregate level. But with linear tests the rejection rates are not high: less than 10%, the size of the test, for aggregate and around 20% over all disaggregate commodities. There was some pattern of higher rejection rates for more volatile commodities, like fruits where the rejection rates were up to 70%; but for a given commodity category pairs that did reject were not more volatile. The type of shock inducing volatility seems to matter. Price changes caused by demand and supply shocks are more likely to induce arbitrage than those induced by tax changes and the disaggregate data showed many jumps induced by tax changes. The noisy character of the disaggregate data seemed to influence the properties of the test. When the tests were bootstrapped, rejection rates were higher, around 50% using estimated factor dynamics and around 30% when it was assumed that there were unit roots in the unobserved factors.
5
Conclusions
group dependence caused by unobserved common factors. We test the null hypothesis of no adjustment towards PPP using three ADF type tests and the KSS test, with three treatments of the deterministic elements and two lag order selection criteria. These were applied to real exchange rates over the period 1957-2001 for 50 countries. Applying the pairwise approach to data on all real cross-rates reveals a number of features that one would miss if one confined attention to rates against the US dollar, e.g. differences in the characteristics of adjustments in real exchange rates within and between developing and developed countries. The larger samples also allow more precise estimates of the frequency with which the null of no PPP is rejected, though because of the cross-section dependence the sampling distribution is large.
The main substantive conclusion is that rejecting the null of no adjustment to PPP requires large shocks to the change in the real exchange rate, which move the real exchange rate out of the band of inaction set by trade costs and the degree of exchange rate volatility. Using the aggregate data, we can reject no adjustment to PPP for almost 90% of the cases where real exchange rate pairs are relatively highly volatile. For developing country pairs we can reject the null of no PPP for over half the cases using linear tests and over 70% using non-linear tests. Had we focussed only on real exchange rates against the US, a developed country, we would have missed this feature. In fact, real exchange rates between developed and developing countries tend to have lower rejection rates than either between developed or between developing countries, and rates against the US dollar tend to have lower rejection rates than for the whole sample. For all 50 countries and over the full sample period, the null of no PPP is rejected around 40% of the times with linear alternatives and almost 60% with non-linear alternatives. There are also more rejections of no adjustment during the more volatile period since 1974, than the earlier less volatile period 1957-73. On average, real exchange rate pairs rejecting no adjustment showed higher volatility compared to pairs that did not reject. In addition, there was evidence of time-varying adjustments, with adjustments being faster when the absolute size of the shocks was larger.
The use of all the real cross rates, rather than just those against the base country, provides more precise estimates and considerable evidence against the null of no PPP. Our main conclusion is that rejecting the null of no adjustment to equilibrium requires sufficient disequilibrium to move the real exchange rate outside the band of inaction set by trade costs. For the most volatile real exchange rates rejection of no adjustment is almost universal. Our estimated proportions also show more evidence against no adjustment to PPP with long spans of data which increases the volatility in the real exchange rate.
References
Anderson, J. and E. van Wincoop (2004), “Trade Costs”, Journal of Economic Literature, 42, 691-751.
Bai, J. and S. Ng (2002), “Determining the Number of Factors in Approximate Factor Models ” Econo-metrica, 70, 191-221.
Bai, J. and S. Ng (2004), “A PANIC Attack on Unit Roots and Cointegration”, Econometrica, 72, 1127-1177.
Betts, C.M. and T.J. Kehoe (2006), “US Real Exchange Rate Fluctuations and Relative Price Fluctua-tions”,Journal of Monetary Economics, 53, 1297-1326.
Breitung, J. and M.H. Pesaran (2007), “Unit Roots and Cointegration in Panels”, in L. Mátyás and P. Sevestre (eds.) The Econometrics of Panel Data: Fundamentals and Recent Developments in Theory and Practice, Kluwer Academic Publishers, forthcoming.
Choi, I. (2006), “Nonstationary Panels”, Chapter 14 in T.C. Mills and K. Patterson (eds.), Palgrave Handbook of Econometrics: Vol. 1 Econometric Theory, Basingstoke, Palgrave Macmillan.
Choi, I. and T. K. Chue (2007), “Subsampling Hypothesis Tests for Nonstationary Panels with Applica-tions to Exchange Rates and Stock Prices”,Journal of Applied Econometrics, forthcoming.
Dees, S., S. Holly, M.H. Pesaran and L.V. Smith (2007), “Long Run Macroeconomic Relations in the Global Economy”,economics - The Open-Access, Open-Assessment E-Journal, 2007-3 (http://www.economics-ejournal.org/economics/journalarticles/2007-3).
De Grauwe, P. and M. Grimaldi (2006), “Exchange Rate Puzzles: A Tale of Switching Attractors”,
European Economic Review, 50, 1-33.
Elliott, G., T.J. Rothenberg and J.H. Stock (1996), “Efficient Tests for an Autoregressive Unit Root”,
Econometrica, 64, 813-836.
Garratt, A., K. Lee, M.H. Pesaran and Y. Shin (2006),Global and National Macroeconometric Modelling: A Long-Run Structural Approach, Oxford University Press.
Imbs, J., H. Mumtaz, M.O. Ravn and H. Rey (2005), “PPP Strikes Back, Aggregation and the Real Exchange Rate”,Quarterly Journal of Economics,120, 1-43.
Kapetanios, G., M.H. Pesaran and T. Yamagata (2006), “Panels with Nonstationary Multifactor Error Structures”,Cambridge Working Papers in Economics 0651, University of Cambridge.
Kapetanios, G., Y. Shin and A. Snell (2003), “Testing for a Unit Root in a Nonlinear STAR Framework”,
Journal of Econometrics, 112, 359-379.
Kwiatkowski, D., P.C.B. Phillips, P. Schmidt and Y. Shin (1992), “Testing the Null Hypothesis of Stationarity Against the Alternative of a Unit Root”,Journal of Econometrics, 54, 159-178.
Leybourne, S.J., T. Kim and P. Newbold (2005), “Examination of Some More Powerful Modifications of the Dickey-Fuller Test”,Journal of Time Series Analysis, 26, 355-369.
Michael, P., A. R. Nobay and D. A. Peel (1997), “Transactions Costs and Non Linear Adjustment in the Real Exchange Rate”,Journal of Political Economy, 105, 862-79.
Moon, H.R., and B. Perron (2004), “Testing for a Unit Root in Panels with Dynamic Factors”,Journal of Econometrics, 122, 81-126.
Moon, H.R., and B. Perron (2007), “An Empirical Analysis of Nonstationarity in Panels of Interest Rates with Factors”,Journal of Applied Econometrics,forthcoming.
Novy, D. (2006), “Is the Iceberg Melting Less Quickly? International Trade Costs after World War II”, Warwick Economic Research Papers No.764, University of Warwick.
Park, H. J., and W. A. Fuller (1995), “Alternative Estimators and Unit Root Tests for the Autoregressive Process”,Journal of Time Series Analysis, 16, 449-459.
Pesaran, M.H. (2006), “Estimation and Inference in Large Heterogeneous Panels with a Multifactor Error Structure”,Econometrica,74, 967-1012.
Pesaran, M.H. (2007a), “A Simple Panel Unit Root Test in the Presence of Cross Section Dependence”,
Journal of Applied Econometrics, 22, 265-312.
Pesaran, M.H. (2007b), “A Pair-Wise Approach to Testing for Output and Growth Convergence”,Journal of Econometrics,138, 312-355.
Pesaran, M.H., R.P. Smith, T. Yamagata and L. Hvozdyk (2006) “Pairwise Tests of Purchasing Power Parity Using Aggregate and Disaggregate Price Measures”, Cambridge Working Paper in Economics No. 0634, University of Cambridge.
Sollis, R. (2005), “Testing the Unit Root Hypothesis Against Three-Regime TAR Non-Linearity: An Investigation of STAR Based Tests”, mimeo, University of Durham.
Table S1: Factor Estimates for the Real Dollar Rates -qit=αˆ0idt+ ˆγiq¯t+ ˆγidq¯dt+ ˆεit
Countries Using Cross Section Averages
¯
qt t-ratio q¯dt t-ratio Trend t-ratio R¯2 Israel 1.544∗ 7.124 -2.171∗ -7.482 0.005∗ 9.065 0.367
United Kingdom 1.208∗ 10.672 -0.445∗ -2.936 -0.002∗ -4.989 0.729
Austria 2.799∗ 50.968 -1.395∗ -18.975 -0.002∗ -14.106 0.980
Belgium 2.696∗ 19.383 -2.041∗ -10.965 0.004∗ 11.503 0.744
Denmark 2.840∗ 39.227 -1.354∗ -13.969 -0.002∗ -10.038 0.963
France 2.595∗ 46.808 -1.514∗ -20.401 0.001∗ 6.566 0.946
Italy 2.234∗ 22.671 -1.741∗ -13.201 0.002∗ 5.825 0.794
Luxembourg 2.871∗ 37.041 -1.648∗ -15.887 0.001∗ 6.695 0.913
Netherlands 2.731∗ 25.203 -0.884∗ -6.097 -0.003∗ -9.129 0.919
Norway 2.235∗ 25.801 -0.531∗ -4.585 -0.003∗ -12.051 0.931
Sweden 2.813∗ 27.518 -1.355∗ -9.907 0.001∗ 3.655 0.862
Switzerland 2.642∗ 28.215 -0.827∗ -6.595 -0.005∗ -18.333 0.963
Canada 0.782∗ 8.285 -0.424∗ -3.357 0.002∗ 8.438 0.708
Japan 2.368∗ 17.097 -1.176∗ -6.344 -0.007∗ -17.480 0.957
Finland 2.197∗ 18.707 -0.648∗ -4.123 -0.001∗ -2.610 0.800
Greece 2.037∗ 12.542 -2.073∗ -9.538 0.004∗ 9.445 0.496
Ireland 1.881∗ 22.665 -1.142∗ -10.276 0.000∗ -2.233 0.878
Malta 1.137∗ 11.889 -0.962∗ -7.520 0.005∗ 19.314 0.902
Portugal 2.816∗ 25.859 -1.978∗ -13.573 -0.001 -1.856 0.911
Spain 2.873∗ 29.612 -1.206∗ -9.286 -0.003∗ -10.028 0.944
Australia 1.464∗ 13.020 0.102 0.680 -0.001∗ -2.455 0.726
New Zealand 2.238∗ 19.148 -1.587∗ -10.147 0.002∗ 5.197 0.717
South Africa 1.839∗ 11.934 -0.759∗ -3.678 0.003∗ 7.632 0.745
Colombia -0.875∗ -3.410 1.945∗ 5.665 0.000 0.460 0.641
Costa Rica 0.976∗ 4.299 -0.934∗ -3.075 0.007∗ 11.380 0.788
Dominican Republic -1.182∗ -4.736 2.872∗ 8.600 -0.003∗ -3.762 0.589
Ecuador -0.844∗ -3.188 2.834∗ 8.003 -0.001∗ -2.038 0.681
El Salvador -0.945∗ -4.219 0.295 0.985 -0.005∗ -7.677 0.731
Guatemala -1.352∗ -7.766 2.429∗ 10.427 -0.002∗ -3.769 0.691
Haiti -1.140∗ -6.151 1.938∗ 7.816 -0.006∗ -12.266 0.597
Honduras -1.453∗ -6.318 2.654∗ 8.622 -0.002∗ -3.460 0.580
Mexico 0.166 0.623 0.084 0.235 0.000 0.332 0.016
Panama -0.158∗ -3.291 0.756∗ 11.736 0.003∗ 21.414 0.981
Paraguay -0.512 -1.868 3.195∗ 8.718 -0.005∗ -6.276 0.529
Venezuela, Rep.Bol. -2.478∗ -8.147 2.812∗ 6.908 0.000 0.243 0.673
Jamaica -0.483 -1.754 2.252∗ 6.115 -0.002∗ -2.953 0.454
Suriname 2.901∗ 3.195 -1.263 -1.040 -0.002 -0.854 0.132
Trinidad and Tobago -0.902∗ -6.279 1.943∗ 10.104 -0.005∗ -11.834 0.444
Cyprus 1.727∗ 17.576 -1.481∗ -11.260 0.005∗ 17.995 0.853
Iran, I.R., of 0.025 0.028 3.891∗ 3.332 -0.012∗ -5.138 0.199
Syrian Arab Republic 0.328 1.182 -1.349∗ -3.637 -0.004∗ -5.087 0.785
Egypt -0.290 -0.808 0.689 1.432 0.001 1.206 0.234
Sri Lanka 0.395 0.922 -2.681∗ -4.672 0.017∗ 15.027 0.831
India -0.040 -0.232 1.543∗ 6.749 0.003∗ 6.662 0.905
Malaysia 0.712∗ 5.151 0.654∗ 3.535 0.001∗ 3.936 0.819
Pakistan 0.124 0.546 0.692∗ 2.272 0.006∗ 9.641 0.874
Philippines 0.598∗ 2.215 -0.162 -0.448 0.003∗ 4.624 0.499
Morocco 1.758∗ 12.329 -0.417 -2.183 0.003∗ 7.453 0.810
Sudan 1.103∗ 2.199 2.567∗ 3.824 -0.006∗ -4.146 0.315
Notes: Results are of the regression of qit on intercept, a linear trend, q¯t andq¯dt for each cross section unit separately,
whereq¯tis the cross section average ofqit over all countries except base country US, and¯qdtis the cross section average
ofqitover 27 developing countries. “*” denotes significance at the5%level. For bootstraping, the coefficient on the linear