Full Length Research Article
STUDY OF INTER-RELATIONSHIP OF MORPHO-ECONOMIC TRAITS FOR FORMULATION OF
EFFECTIVE SELECTION STRATEGY IN SESAME
*
Swapan K. Tripathy, D.R. Mishra, N. Senapati, S. K. Mohanty, Kartik Ch. Pradhan, M. Jena,
S. Dash, G. B. Dash, P. K. Nayak, M. R. Mohanty and S. Panda
Department of Agricultural Biotechnology, College of Agriculture, OUAT, Bhubaneswar, India
ARTICLE INFO ABSTRACT
Character association and path coefficient analysis were carried out in a set of sesame genotypes collected from different states of India. Capsules/plant followed by plant height, days to cessation of flowering, period of flowering, capsule length, height to first capsule and seeds/capsule revealed significant positive correlation with seed yield. In contrast, seed weight had negative relationship with seed yield. Oil content seems to be increased with duration of flowering period owing to their inter se significant positive relationship. Among the component traits, number of capsules/plant had maximum direct effect on seed yield followed by height to first capsule, period of flowering.Besides, period of flowering, height to first capsule and capsule breadth contributed indirectly on seed yield/plant through number of capsules/plant. Hence, the above morpho-economic traits may be given due importance for effective selection in the breeding programme for development of superior sesame varieties.
Copyright © 2016 Swapan K. Tripathyet al.This is an open access article distributed under the Creative Commons Attribution License, which permits
unrestricted use, distribution, and reproduction in any medium, provided the original work is properly cited.
INTRODUCTION
Sesame (Sesamum indicum L. Family: Pedaliaceae) is one of the oldest oilseed crops grown throughout the tropical and sub-tropical regions of world. Sesame oil is considered as the queen of high quality vegetable oil (44-58%) for human consumption as it contains high levels unsaturated fatty acids and antioxidants e.g., sesamol, sesamin, sesamolin and sesaminol (Nupur et al. 2010). India is the second largest producer of sesame in the world but suffers a serious setback in terms of productivity (368kg/ha) as compared to world average (489kg/ha). The low productivity of sesame in India is mainly due to the low yield potential and inconsistent yield performance under varied environmental conditions. Hence, there is a need to augment the productivity of crop through crop improvement programme. Seed yield in sesame is a complex trait and it is determined by mutual relationship among the component morpho-economic traits. Indiscriminate selection of plants on a massive scale in any crop often results in an immense wastage of time and resources. In this context, study of the mode and extent of inter-relationship of different component traits and their direct and indirect effects on seed
*Corresponding author: Swapan K. Tripathy,
Department of Agricultural Biotechnology, College of Agriculture, OUAT, Bhubaneswar, India.
yield can provide the basis for effective selection and successful utilization of germplasm resources in the development of superior sesame varieties. Many often unfavorable linkages among the agro-economic traits do exist resulting in genetic slippage and limited genetic advance. Besides, the information for inter se association among yield and its component characters is often incomplete and/or varying depending on the composition of the test materials, characters studied, previous selection history and the environment under which the breeding materials are tested. Moreover, study of path analysis is more important over correlation, in that, it partitions the total correlation coefficients with yield into various direct and indirect effects. Therefore, an attempt has been made to estimate the correlation and path coefficients of morpho-economic traits at both phenotypic and genotypic level to formulate an effective selection strategy in sesame.
MATERIALS AND METHODS
Twelve popular genotypes of sesame collected from different states of India were tested in RBD with three replications. Each test genotype was grown in five rows of 3.5m length with a spacing of 30 x 10 cm.
ISSN: 2230-9926
International Journal of Development Research
Vol. 6, Issue, 03, pp. 7012-7016, March,2016
International Journal of
DEVELOPMENT RESEARCH
Article History:
Received 14th December, 2015
Received in revised form 15th January, 2016
Accepted 20th February, 2016
Published online 31st March, 2016
Available online at http://www.journalijdr.com
Key Words:
Character Association, Path Analysis, Selection Strategy,
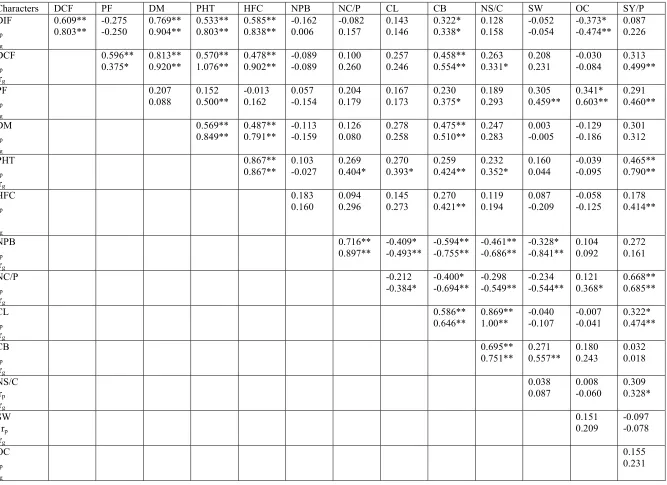
Table 1. Phenotypic (rp) and genotypic (rg) correlation co-efficients among 14 characters in 12 parents of sesame
Characters DCF PF DM PHT HFC NPB NC/P CL CB NS/C SW OC SY/P
DIF rp
rg
0.609** 0.803**
-0.275 -0.250
0.769** 0.904**
0.533** 0.803**
0.585** 0.838**
-0.162 0.006
-0.082 0.157
0.143 0.146
0.322* 0.338*
0.128 0.158
-0.052 -0.054
-0.373* -0.474**
0.087 0.226
DCF rp
rg
0.596** 0.375*
0.813** 0.920**
0.570** 1.076**
0.478** 0.902**
-0.089 -0.089
0.100 0.260
0.257 0.246
0.458** 0.554**
0.263 0.331*
0.208 0.231
-0.030 -0.084
0.313 0.499**
PF rp
rg
0.207 0.088
0.152 0.500**
-0.013 0.162
0.057 -0.154
0.204 0.179
0.167 0.173
0.230 0.375*
0.189 0.293
0.305 0.459**
0.341* 0.603**
0.291 0.460**
DM rp
rg
0.569** 0.849**
0.487** 0.791**
-0.113 -0.159
0.126 0.080
0.278 0.258
0.475** 0.510**
0.247 0.283
0.003 -0.005
-0.129 -0.186
0.301 0.312
PHT rp
rg
0.867** 0.867**
0.103 -0.027
0.269 0.404*
0.270 0.393*
0.259 0.424**
0.232 0.352*
0.160 0.044
-0.039 -0.095
0.465** 0.790**
HFC rp
rg
0.183 0.160
0.094 0.296
0.145 0.273
0.270 0.421**
0.119 0.194
0.087 -0.209
-0.058 -0.125
0.178 0.414**
NPB rp
rg
0.716** 0.897**
-0.409* -0.493**
-0.594** -0.755**
-0.461** -0.686**
-0.328* -0.841**
0.104 0.092
0.272 0.161
NC/P rp
rg
-0.212 -0.384*
-0.400* -0.694**
-0.298 -0.549**
-0.234 -0.544**
0.121 0.368*
0.668** 0.685**
CL rp
rg
0.586** 0.646**
0.869** 1.00**
-0.040 -0.107
-0.007 -0.041
0.322* 0.474**
CB rp
rg
0.695** 0.751**
0.271 0.557**
0.180 0.243
0.032 0.018
NS/C rp
rg
0.038 0.087
0.008 -0.060
0.309 0.328*
SW rp
rg
0.151 0.209
-0.097 -0.078
OC rp
rg
0.155 0.231
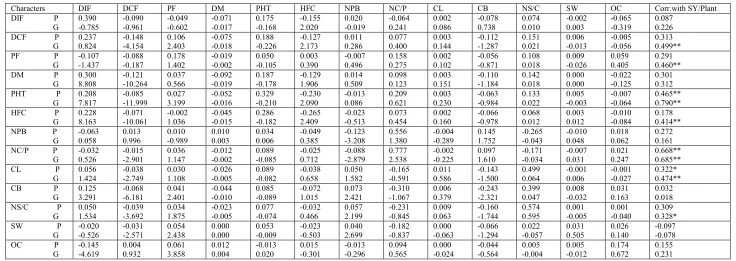
Table 2. Phenotypic(P) and genotypic(G) path-coefficient analysis showing direct and indirect effects of different traits on seed yield
Characters DIF DCF PF DM PHT HFC NPB NC/P CL CB NS/C SW OC Corr.with SY/Plant
DIF P G 0.390 -0.785 -0.090 -0.961 -0.049 -0.602 -0.071 -0.017 0.175 -0.168 -0.155 2.020 0.020 -0.019 -0.064 0.241 0.002 0.086 -0.078 0.738 0.074 0.010 -0.002 0.003 -0.065 -0.319 0.087 0.226 DCF P
G 0.237 0.824 -0.148 -4.154 0.106 2.403 -0.075 -0.018 0.188 -0.226 -0.127 2.173 0.011 0.286 0.077 0.400 0.003 0.144 -0.112 -1.287 0.151 0.021 0.006 -0.013 -0.005 -0.056 0.313 0.499** PF P
G -0.107 -1.437 -0.088 -0.187 0.178 1.402 -0.019 -0.002 0.050 -0.105 0.003 0.390 -0.007 0.496 0.158 0.275 0.002 0.102 -0.056 -0.871 0.108 0.018 0.009 -0.026 0.059 0.405 0.291 0.460** DM P
G 0.300 8.808 -0.121 -10.264 0.037 0.566 -0.092 -0.019 0.187 -0.178 -0.129 1.906 0.014 0.509 0.098 0.123 0.003 0.151 -0.110 -1.184 0.142 0.018 0.000 0.000 -0.022 -0.125 0.301 0.312 PHT P
G 0.208 7.817 -0.085 -11.999 0.027 3.199 -0.052 -0.016 0.329 -0.210 -0.230 2.090 -0.013 0.086 0.209 0.621 0.003 0.230 -0.063 -0.984 0.133 0.022 0.005 -0.003 -0.007 -0.064 0.465** 0.790** HFC P
G 0.228 8.163 -0.071 -10.061 -0.002 1.036 -0.045 -0.015 0.286 -0.182 -0.265 2.409 -0.023 -0.513 0.073 0.454 0.002 0.160 -0.066 -0.978 0.068 0.012 0.003 0.012 -0.010 -0.084 0.178 0.414** NPB P
G -0.063 0.058 0.013 0.996 0.010 -0.989 0.010 0.003 0.034 0.006 -0.049 0.385 -0.123 -3.208 0.556 1.380 -0.004 -0.289 0.145 1.752 -0.265 -0.043 -0.010 0.048 0.018 0.062 0.272 0.161 NC/P P
G -0.032 0.526 -0.015 -2.901 0.036 1.147 -0.012 -0.002 0.089 -0.085 -0.025 0.712 -0.088 -2.879 0.777 2.538 -0.002 -0.225 0.097 1.610 -0.171 -0.034 -0.007 0.031 0.021 0.247 0.668** 0.685** CL P
G 0.056 1.424 -0.038 -2.749 0.030 1.108 -0.026 -0.005 0.089 -0.082 -0.038 0.658 0.050 1.582 -0.165 -0.591 0.011 0.586 -0.143 -1.500 0.499 0.064 -0.001 0.006 -0.001 -0.027 0.322* 0.474** CB P
G 0.125 3.291 -0.068 -6.181 0.041 2.401 -0.044 -0.010 0.085 -0.089 -0.072 1.015 0.073 2.421 -0.310 -1.067 0.006 0.379 -0.243 -2.321 0.399 0.047 0.008 -0.032 0.031 0.163 0.032 0.018 NS/C P
G 0.050 1.534 -0.039 -3.692 0.034 1.875 -0.023 -0.005 0.077 -0.074 -0.032 0.466 0.057 2.199 -0.231 -0.845 0.009 0.063 -0.160 -1.744 0.574 0.595 0.001 -0.005 0.001 -0.040 0.309 0.328* SW P
G -0.020 -0.526 -0.031 -2.571 0.054 2.438 0.000 0.000 0.053 -0.009 -0.023 -0.503 0.040 2.699 -0.182 -0.837 0.000 -0.063 -0.066 -1.294 0.022 -0.057 0.031 0.505 0.026 0.140 -0.097 -0.078 OC P
G -0.145 -4.619 0.004 0.932 0.061 3.858 0.012 0.004 -0.013 0.020 0.015 -0.301 -0.013 -0.296 0.094 0.565 0.000 -0.024 -0.044 -0.564 0.005 -0.004 0.005 -0.012 0.174 0.672 0.155 0.231
Observations on days to initial flowering, days to cessation of flowering, duration of flowering, days to maturity, height to first capsule(cm), plant height(cm), number of primary branches/plant, number of capsule/plant, capsule length(cm), capsule breadth(cm), number of seeds/capsule, 500-seed weight(gm), oil content(%) and seed yield/plant(gm) were recorded. Routine statistical procedures were followed for analysis of variance and covariance (Singh and Choudhury, 1976). The correlation coefficients for each pair of characters were computed following Al-Jibouri et al., (1958) and the path co-efficients (direct and indirect effects) were calculated as per Dewey and Lu (1959).
RESULTS AND DISCUSSION
Estimation of phenotypic and genotypic correlations between grain yield and component characters as well as inter se association provides information for choice of characters in selection programme.
The strength of character association as measured by estimates of co-efficient of correlation depends upon the composition of the test materials, characters studied, previous selection history and the environment under which the breeding materials are tested. A perusal of Table 1 indicated close correspondence between phenotypic and genotypic correlation co-efficients (direction remaining same) with few exceptions indicating negligible masking effect of environment on character association and thus, providing reliability of selection at phenotypic level. In this study, the higher values of the genotypic correlation coefficients, as compared to the phenotypic ones, may be due to the fact that the inheritance associations between the different characters were reduced and modified under the influence of the environment (Valarmathi et al., 2004). In the present investigation, days to cessation of flowering, period of flowering, plant height, height to first capsule, number of capsules/plant and capsule length had shown positive and significant correlation with seed yield at 1% level of significance and number of seeds/capsule revealed significant positive association with seed yield at 5% level of significance.
Among these, plant height and number of capsules/plant and capsule length were shown to have significant positive correlation with seed yield at both genotypic and phenotypic level and rest of the above traits correlated significantly at genotypic level only. The positive interrelationship between yield with plant height and number of capsules indicate that these characters may improve seed yield of the crop. Similar conclusions were drawn by Anitha et al.(2010), Muhammed and Dorairaj (1964), Reddy et al. (1993), Sarwar and Haq (2006) and Parameshwarappa et al. (2009). Seed yield was also reported to have significantly positive correlation with plant height, capsules per plant, primary branches/plant and days to 50% flowering (Solanki and Gupta, 2003; Mukhekar et
al., 2003). Days to initial flowering and days to maturity
revealed relatively lower magnitude of non-significant positive correlation with seed yield indicating an understanding that genotype with shorter days to flowering and maturity may not led to increase in seed yield. However, Ukaan and Ogbonna (2012) reported negative association of seed yield/plant with flower bud initiation and days to 50% flowering.
Days to initiation of flowering, days to cessation of flowering, period of flowering, and days to maturity are associated with flowering behaviour and physiological maturity. A perusal of the Table 1 indicated significant positive correlation of days to initial flowering with days to cessation of flowering and days to maturity, but no correlation with period of flowering. In this context, days to cessation of flowering revealed significant positive relationship with days to initial flowering and period of flowering. Whereas, days to flowering correlated positively with days to initial flowering and days to cessation of flowering. On the other hand, period of flowering was shown to have significant positive correlation with days to cessation of flowering. The above relationship among parameters relating to flowering and maturity duration indicates that length of flowering period depends primarily on cessation rather than initiation of flowering. Therefore, genotypes with longer flowering period could eventually bore more number of capsules. Height to first capsule had no marked relationship with period of flowering and any of the important agro-economic component traits except capsule breadth and seed yield/plant at genotypic level.
Tall plant type being an undesirable trait, it can hardly be of any use in selection programme even if it results recovery of high grain yield. As expected, plant height significantly and positively correlated with all flowering and maturity parameters and height to first capsule. Besides, it had significant positive correlation with important yield component traits e.g., number of capsules/plant, capsule length, capsule breadth, number of seeds/capsule as well as seed yield/plant. This result was agreed with those results reported by Ercan et al. (2002), Sumathi et al. (2007) and Ahmed and Ahmed (2012). Number of primary branches/plant had shown no significant relationship with seed yield as well as oil content, but it had strong correlation with important yield component traits e.g., number of capsules/plant, capsule breadth, capsule length, number of seeds/capsule and seed weight. As expected, number of capsules/plant revealed significant positive correlation with number of primary
branches, but it had shown negative correlation with important yield component traits e.g., capsule length, capsule breadth, number of seeds/capsule and seed weight. Capsule length and capsule breadth had negative significant correlation with number of primary branches, number of capsules/plant; and positively correlated with number of seeds /capsule. In this crop, seed weight had good positive relationship with capsule breadth, but it was shown to have no direct relationship with seed field. In the present investigation, oil content seems to be increased with duration of flowering period owing to inter se significant positive relationship. Possibly it is the requirement for biosynthesis of sesame oil. However, it has no relation with seed yield. Azeez and Morakinyo (2009) reported significant negative correlation between seed yield and oil content in sesame. Correlation simply identifies mutual relationships among parameters while path analysis allows determination of the relative magnitude of each effect. The correlation co-efficients of component traits with seed yield were, therefore, partitioned into their direct and indirect effects on grain yield following path co-efficient analysis to ascertain further conclusive information on choice of characters required for selection of high yielding genotypes. This will be useful to work out the cause and effect relationship so that the selection will be more effective. Number of capsules/plant, height to first capsule and period of flowering contributed appreciably high direct effect followed by capsule length, number of seeds/capsule, seed weight and oil content (Table 2).
All above component traits except seed weight and oil content had also shown significant positive correlation with seed yield/plant. Hence, these agro-economic traits may be selectively exploited for selection of genotypes for higher productivity. Similarly, capsules/plant was shown to be important for realizing improvement in seed yield (Chandra Mohan, 2011; Yingzhong and Yishou, 2002; Solanki and Gupta, 2003; Mukhekar et al., 2003; Sarwar and Haq, 2006 and Parameshwarappa et al., 2009). In contrast, days to cessation of flowering, number of primary branches/plant and capsule breadth had revealed negative direct effect indicating limited scope for genetic improvement of grain yield based on selection of these ancillary traits. On the other hand, Vidhyavathi et al. (2005) and Sekhara and Reddy (1993) reported negligible positive direct effect of number of primary branches, seed weight and oil content on seed yield in sesamum. In the present investigation, 500-seed weight was shown to have negative correlation with seed yield and consequently negligible positive direct effect on seed yield. In contrast, Azeez and Morakinyo (2009) reported highest direct influence of seed weight on single plant seed yield, while number of capsules/plant had highest indirect effect on seed yield through number of seeds/capsule.
Among the component traits, period of flowering, capsule breadth and height to first capsule contributed indirectly on seed yield/plant through number of capsules/plant. In addition to significant proportion of direct effects contributed by period of flowering (1.402) and height to first capsule (2.409), both these component traits had also indirectly contributed to seed yield via number of capsules/plant. Besides, capsule breadth had also appreciably higher proportion of indirect effects on seed yield via number of capsules/plant.
Seed weight and oil content though had no significant association with seed yield; each of these seems to have appreciable indirect effect (2.438 and 3.858 respectively) on seed yield through period of flowering. This envisaged that selection of genotypes with longer period of flowering can have more scope for physiological development of seed, sesame oil biosynthesis as well as increased capsule bearing leading to high seed yield with increased oil content.
REFERENCES
Al-Jibouri, H. A., Mulle, P. A. and Robinson, H. F. 1958. Genotypic and environmental variances and covariances in upland cotton crosses of interspecific origin. Agronomy
Journal, 50:633-636.
Anitha, B.K., Manivannan, N., Muralidharan, V., Gopalakrishnan, C. and Vindhiyavarman, P. 2010. Character association analysis in sesame (Sesamum
indicum L.). Elect. J. Plant Breed., 1(2): 209-211.
Ahmed, S.B.M. and Ahmed, A.F. 2012. Genotype X season interaction and characters association of some Sesame (Sesamum indicum L.) genotypes under rain-fed conditions of Sudan. Afr. J. Plant Sci., 6(1): 39-42.
Azeez, M.A. and Morakinyo, J.A. 2009. Character association and path analysis of yield and its components in sesame (Genera Sesamum and Ceratotheca) seed. Proc. Of the
33rd Annual Conf. of Genetics Society of Nigeria, 27-30
Sept, 2009, Ilorin, Nigeria.
Chandra Mohan, Y. 2011. Genetic variability and character association studies in sesame (Sesamum indicum L.). Crop
Res. 42 (1, 2 & 3) : 259-262.
Dewey, D.S. and Lu, H.H. 1959. A correlation and path coefficient analysis of components of crested grass seed production. Agron. J., 51: 515-518.
Ercan, G.A., TasKin, M.K., Turgut, K. and Bilgen, M. 2002. Characterization of Turkish sesame (Sesamum indicum L.). landrace using agronomic and morphologic descriptors.
Akdeiz Universitesi Ziraat Fakultesi Dergisi, 15(2): 45-52.
Muhammed,S.V. and Dorairaj, M.S. 1964. Correlation studies in Sesamum indicum L. association between yield and certain yield components in different groups of Sesamum based on seed colour. Madras Agric. J., 51: 73-74.
Mukherkar, G.D., Bangar, M.D., Lad, D.B., Bhor, T.J. and Mungse, H.B. 2003. Genetic variability and correlation studies in sesame (Sesamum indicum L.). J. Maharastra
Agril.Univ., 27(3): 284-285.
Nupur, M., Bhat, K.V., Srivastava, P.S. 2010. Variation in fatty acid composition in Indian germplasm of sesame. J.
Amer. Oil Chemists’ Society, 87 (11): 1263-1269.
Parameshwarappa, S.G., Palakshappa, M.G., Salimath, P.M., Parameshwarappa, K.G. 2009. Studied on genetic variability and character association in germplasm collection of sesame (Sesamum indicum). Karnataka J.
Agric. Sci., 22(2): 252-254.
Reddy, O.U.K., Dorairaj, M.S. and Padmavathi, N. 1993. Characters association in sesame (Sesamum indicum L.).
Sesame Safflower Newslett., 8: 41-44.
Sarwar, G. and Haq, M.A. 2006. Evaluation of sesame germplasm for genetic parameters and disease resistance.
J. Agric. Res., 44(2): 89-95.
Sekhara, B.C. and Reddy, C.R. 1993. Correlation and path coefficient analysis in sesame (Sesamum indicum L.). Ann.
Agric. Res., 14: 178-184.
Singh. R.K. and Choudhary. B.D. 1976. Biometrical techniques in genetics and plant beeding. (Varghese TM
ed.), International Bioscience Publishers, Hissar, India p.
56-71.
Solanki, Z.S. and Gupta, D. 2003. Variability and character association among quantitative characters of sesame. J.
Oilseeds Res., 20:276-277.
Sumathi, V., Muralidharan, V. and Manivannan, N. 2007. Trait association and path coefficient analysis for yield and yield attributing traits in sesame (Sesamum indicum L.).
Madras Agric. J., 94: 174-178.
Ukaan, S. and Ogbonna, P. 2012. Genetic Variability and Character Association in Sesame (Sesamum indicum L.) Accessions. Int. J. Plant Breed., 6 (2): 139-143.
Valarmathi, G., Kumar, M..and Saravannan, N.A. 2004. Genetic variability and correlation studies for seed yield related traits in sesame. Sesame and Safflower Newslett., 19:7-9.
Vidyavathi, R., Manivannan, N. and Muralidharan, V. 2005. Line x tester analysis in sesame (Sesamum indicum L.).
Indian J. Agric. Res., 39:225-228.
Yingzhong, Z. and Yishou, W. 2002. Genotypic correlation and path co-efficient analysis in sesame. Sesame and
Safflower Newslett., 17: 10-12.