RESEARCH ARTICLE
Collaborative repressive action of the antagonistic ETS
transcription factors Pointed and Yan fine-tunes gene
expression to confer robustness in
Drosophila
Jemma L. Webber, Jie Zhang, Alex Massey, Nicelio Sanchez-Luege and Ilaria Rebay*
ABSTRACT
The acquisition of cellular identity during development depends on precise spatiotemporal regulation of gene expression, with combinatorial interactions between transcription factors, accessory proteins and the basal transcription machinery together translating complex signaling inputs into appropriate gene expression outputs. The opposing repressive and activating inputs of theDrosophilaETS family transcription factors Yan and Pointed orchestrate numerous cell fate transitions downstream of receptor tyrosine kinase signaling, providing one of the premier systems for studying this process. Current models describe the differentiative transition as a switch from Yan-mediated repression to Pointed-Yan-mediated activation of common target genes. We describe here a new layer of regulation whereby Yan and Pointed co-occupy regulatory elements to repress gene expression in a coordinated manner, with Pointed being unexpectedly required for the genome-wide occupancy of both Yan and the co-repressor Groucho. Usingeven skipped as a test-case, synergistic genetic interactions between Pointed, Groucho, Yan and components of the RNA polymerase II pausing machinery suggest that Pointed integrates multiple scales of repressive regulation to confer robustness. We speculate that this mechanism may be used broadly to fine-tune the expression of many genes crucial for development.
KEY WORDS: Gene regulatory network, Cell fate specification, Chromatin occupancy, Mesoderm development, RNA pol II pausing
INTRODUCTION
Genetic and epigenetic mechanisms together produce the
spatiotemporal gene expression dynamics that drive accurate and robust developmental transitions. At the genetic level, combinatorial codes of competing and collaborating transcriptional activators and repressors are recruited to individual cis-regulatory enhancers to determine precise gene expression outputs (Ma, 2005; Bauer et al., 2010). Analogously, at the epigenetic level, activating and repressive marks facilitate open or closed chromatin states that respectively promote or preclude expression, and more nuanced regulation can be achieved by the simultaneous presence of activating and repressive marks (Reynolds et al., 2013; Lagha et al., 2012). For example, at many developmentally important genes, specific combinations of inherently conflicting histone modifications permit RNA polymerase ( pol) II to initiate transcription but then stall, keeping gene expression
off yet poised for rapid activation (Schwartz et al., 2010; Gaertner et al., 2012). Although it is known that chromatin looping can physically coordinate the transcriptional complexes assembled at enhancers across a locus with the promoter-proximal complexes that orchestrate RNA pol II pause and release, the mechanisms by which these two layers of regulation are actually integrated to fine-tune gene expression dynamics during development are just beginning to be elucidated (reviewed by Gaertner and Zeitlinger, 2014; Liu et al., 2015; Meng and Bartholomew, 2017).
TheDrosophilaETS transcriptional repressor Yan [also known as Anterior open (Aop); Nüsslein-Volhard et al., 1984; Rogge et al., 1995] and activator Pointed (Pnt) provide a useful model system for exploring how activator and repressor inputs are balanced to control developmental gene expression. Genetic and biochemical analysis of several enhancer elements, including the muscle heart enhancer
(MHE) that drives the segmental pattern of even skipped (eve)
expression in the cardiogenic mesoderm, has showcased
competition between Yan and Pnt for access to consensus ETS motifs as a mechanism for directing rapid off-on gene expression transitions in response to upstream signals. Thus, prior to signaling, Yan outcompetes Pnt to repress target gene expression, thereby stabilizing the uncommitted precursor state. Following pathway activation, Yan is targeted for rapid degradation, allowing Pnt access to sites previously occupied by Yan. This turns on formerly repressed gene expression programs to promote a differentiative
transition (Brunner et al., 1994; Klaes et al., 1994; O’Neill et al.,
1994; Rebay and Rubin, 1995; Hsu and Schulz, 2000).
The results of several recent studies motivated us to reconsider the universality of this regulatory mechanism with respect to all Yan target genes and to ask whether more complicated Yan-Pnt interactions might also contribute to regulation of well-studied
targets such as eve. First, chromatin
immunoprecipitation-sequencing (ChIP-seq) studies have shown that Yan occupies chromatin in broad stretches of clustered peaks, binding preferentially to enhancers associated with developmentally important genes and signaling pathway effectors (Webber et al., 2013a). Simple binary off-on regulation of all of these putative targets seems unlikely. Second, a comparative survey of Yan and Pnt protein expression throughout development revealed extensive co-expression, particularly in tissues in which receptor tyrosine kinase (RTK) signaling levels are presumed low (Boisclair Lachance et al., 2014). This raises the possibility of more complicated interactions than might be needed if their expression were always mutually exclusive as it is in the embryonic midline.
Indeed, two recent studies focused onevehighlight the importance
of properly balanced Yan and Pnt repressive and activating inputs at the MHE before, during and after a cell fate transition, and emphasize the use of long-range interactions between the MHE and other Yan-bound elements as a mechanism for ensuring robust Received 26 March 2018; Accepted 17 May 2018
Ben May Department for Cancer Research, University of Chicago, Chicago, IL 60637, USA.
*Author for correspondence ([email protected])
A.M., 0000-0003-0283-1142; I.R., 0000-0002-2444-3864
DEVEL
O
regulation (Webber et al., 2013b; Boisclair Lachance et al., 2018).
How Yan/Pnt-mediated regulatory mechanisms might be
coordinated with epigenetic mechanisms that influence gene expression is not known.
In this study, we report the discovery of a completely unexpected role for Pnt in recruiting or stabilizing Yan occupancy and repression at regulatory elements across the genome. In wild-type embryos, we find that Yan and Pnt have virtually identical genome-wide occupancy patterns and that the two actually co-occupy individual enhancers. Whereas the majority of Pnt occupancy is Yan independent, the majority of Yan occupancy is Pnt dependent, a finding that positions Pnt as an anchor with respect to establishing Yan occupancy and repression. Further challenging the model of exclusive Yan-Pnt regulatory antagonism, gene expression analyses predict that in addition to the classic opposing Pnt and Yan inputs at select targets, Yan and Pnt together negatively regulate many target genes. Pnt also facilitates chromatin binding of the TLE co-repressor protein Groucho, raising the possibility of context-specific roles for
Pnt as a repressor. Focusing on the target gene eve, synergistic
interactions between Pnt, Yan, Groucho and factors associated with pausing of RNA pol II fine-tune Eve expression to ensure robust cell fate specification. We propose that the collaborative action of an opposing activator-repressor pair establishes repressive complexes that collaborate with the pol II pausing machinery to create a locus-wide poised state that both prevents spurious gene activation and ensures timely induction of expression following signaling cues.
RESULTS
Yan and Pnt co-occupy regulatory regions
To investigate how regulatory inputs from Yan and Pnt are integrated across their target gene loci, we used ChIP-seq to generate a genome-wide map of Pnt-bound regions in stage 11
Drosophilaembryos and then compared it with that of Yan. The two occupancy profiles were strikingly similar, including at loci of the
known Yan/Pointed targetsargos(aos),even skipped(eve) andmae
(also known asedl) (Fig. 1A, Fig. S1A,B). Using high-confidence
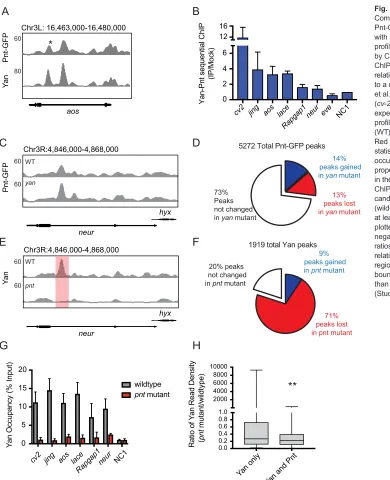
bound regions identified with the model-based analysis of ChIP-seq (MACS) peak-calling tool (Zhang et al., 2008), we calculated that 82% of Yan-bound peaks overlapped with Pnt-bound peaks. In the instances when a peak was called only in the Pnt dataset, visual inspection of the tag density pileups often revealed a subthreshold accumulation of reads in the Yan sample (Fig. S1A,B). Consistent with the similar binding landscapes, central motif enrichment analysis showed that the consensus sequences recognized by Mothers against dpp (Mad) and ETS transcription factors were the two most enriched motifs in Pnt-bound peaks (Fig. S1C), exactly as has been shown for Yan-bound peaks (Webber et al., 2013a). Assigning Pnt-bound regions to the nearest gene produced a list of genes with significant overlap with a similarly generated Yan target list, and thus near identical enrichment of gene ontology (GO) terms (Table S1, Fig. S1D).
Although Yan and Pnt are co-expressed extensively in stage 11 embryos (Boisclair Lachance et al., 2014), we expected the overlapping occupancy profiles to reflect mutually exclusive Yan or Pnt binding to specific enhancers, consistent with current understanding of their antagonistic relationship. To assess this, we selected a subset of bound regions for which an ability to respond appropriately to Pnt and Yan activating and repressive inputs had been previously demonstrated in S2 cell transcriptional reporter assays (Webber et al., 2013a). To our surprise, sequential ChIP (ChIP-reChIP) followed by qPCR revealed Yan-Pnt co-occupancy at six of the seven regions tested (Fig. 1B). This suggested that the
mechanisms that organize Yan and Pnt chromatin occupancy and contributions to gene expression regulation are more complicated than previously assumed.
Pnt facilitates Yan recruitment across the genome
Yan-Pnt co-occupancy of an enhancer could result from either interdependent or independent recruitment. Based on the accepted model of Yan and Pnt function in which Yan-mediated repression maintains cells in an uncommitted progenitor-like state, we predicted that Yan is more likely to be the initiator, perhaps recruiting Pnt to poise bound target regions for subsequent activation in response to signaling. We therefore first asked whether binding of Pnt to its target regions depends upon Yan by examining Pnt chromatin occupancy in
yannull mutant embryos. In contrast to our predictions, the binding
landscape of Pnt was broadly conserved in the absence of Yan (Fig. 1C,D, Table S2), suggesting that Pnt recruitment occurs primarily independently of Yan.
To determine whether Yan recruitment was similarly independent
of Pnt, we profiled Yan chromatin occupancy inpnt null mutant
embryos. In contrast to expectations, comparison of ChIP-seq signal profiles revealed a global reduction in Yan occupancy (Fig. 1E,F). This finding was validated independently by ChIP-qPCR at all targets tested (Fig. 1G). Indirect immunofluorescence analysis confirmed
comparable Yan protein levels in wild-type andpntmutant embryos
(Fig. S2), ruling out the most trivial explanation for globally reduced occupancy. In further support for a direct role for Pnt in facilitating Yan recruitment to chromatin, Yan occupancy was preferentially reduced at regions identified as bound by both Yan and Pnt versus regions identified as bound by Yan alone (Fig. 1H). We conclude that Pnt plays a crucial and unexpected role in the recruitment and/or stabilization of Yan binding across the genome.
Pnt collaborates with Yan to mediate repressive function
Yan’s unanticipated dependency upon Pnt for proper occupancy
motivated us to consider a non-canonical role for Pnt as a repressor, and a collaborative rather than antagonistic relationship with Yan in this capacity. The central prediction was that the expression of genes subject to such Pnt-Yan cooperative repression should increase upon loss of either Pnt or Yan. To test this, we utilized an
unpublished analysis of mRNA expression changes inpntoryan
mutant embryos that we had performed with a custom Agilent microarray made with probes from Yan-bound genes identified by ChIP (for ChIP targets, see Webber et al., 2013a). We first identified
probes for which expression was significantly changed (P<0.05) in
pntmutants versus wild type (Fig. 2A) and then selected a handful
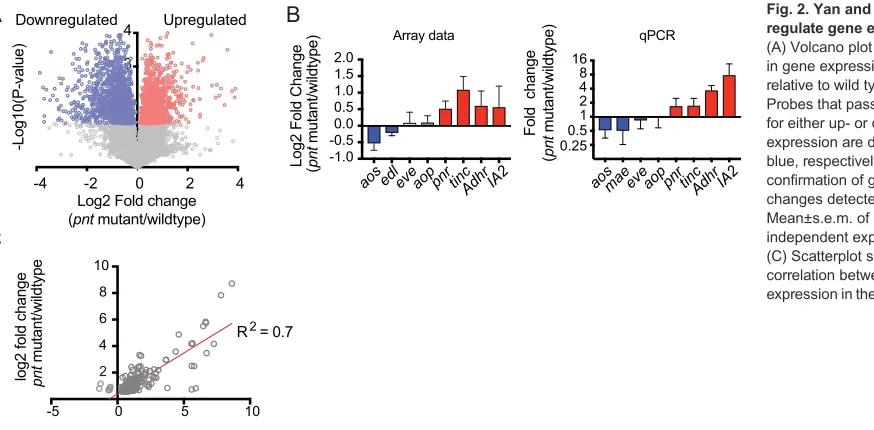
of up- or downregulated targets for qPCR validation. Comparison of array and qPCR results revealed broad agreement between the two datasets, confirming the overall quality of the array data (Fig. 2B). As a second point of validation, we determined whether mRNA
levels of the known Yan/Pnt targetsaos,maeandeveexhibited the
expected opposite response to loss of Pnt or Yan. Consistent with
expectation, expression ofaosandmaewas reduced inpntmutants
and increased inyanmutants. In contrast, althoughevelevels were
elevated in the absence of Yan, they were not significantly changed
inpntmutants, a finding perhaps in keeping with the stochastic and
rather modest loss of Eve expression that has been described inpnt
mutant embryos (Halfon et al., 2000).
Although a handful of studies have uncovered roles for Pnt in
negative regulation of gene expression, includinghidin the embryo,
yanin the eye disc andasensein the larval brain (Kurada and White,
1998; Rohrbaugh et al., 2002; Zhu et al., 2011), Pnt has been
characterized exclusively as a transcriptional activator (Klämbt,
DEVEL
O
1993; Scholz et al., 1993; Brunner et al., 1994; O’Neill et al., 1994; Gabay et al., 1996; Schwartz et al., 2010). We were therefore
intrigued by the set of genes upregulated in the pnt mutant.
Although some of these expression increases could reflect indirect regulation, because the genes used in the analysis were selected based on chromatin occupancy, the approach should enrich for changes resulting from loss of direct Pnt-mediated regulation. Focusing on genes with upregulated expression, which would reflect loss of Pnt repressive inputs, we assessed their response to loss of Yan. If the ability of Pnt to repress transcription depends on its ability to recruit Yan, then a similar set of genes should be upregulated in both mutants; indeed, a strong positive correlation
was observed (R2=0.7,P<0.0001; Fig. 2C).
To gain insight into the developmental processes that might be regulated by coordinated Pnt-Yan repression, we identified the ontologies of the upregulated genes using the PANTHER classification system (Mi et al., 2013). Upregulated genes were
enriched for categories associated with muscle cell fate commitment and cardioblast differentiation. These GO terms were absent from ontology analyses performed with downregulated genes (Table S3). Considering these differences in light of the Yan and Pnt expression patterns in the stage 11 embryo suggests that in the mesoderm, where Yan and Pnt are co-expressed and RTK signaling levels are low (Gabay et al., 1997; Boisclair Lachance et al., 2014), the two collaborate as repressors to stabilize the unspecified state.
Groucho is recruited to Yan and Pnt co-occupied regions A second prediction of a model in which Pnt contributes repressive function to gene regulation is that it should recruit co-repressor proteins, either directly or through its interaction with Yan. To identify likely candidates, we examined the modENCODE database (Contrino et al., 2012; www.modencode.org) to compare available co-repressor genome-wide occupancy patterns with those of Yan and Pnt. The binding landscape of the co-repressor Groucho (Gro) 0.0
0.2 0.4 0.6 0.8 1.0 2000 4000 6000 8000 10000
Ratio of
Y
an Read Density
(
pnt
mutant/wildtype
)
60
80
P
F
G-t
n
P
n
a
Y
Chr3L: 16,463,000-16,480,000
A
B
C
5272 Total Pnt-GFP peaks13% peaks lost in yan mutant
14% peaks gained in yan mutant
73% Peaks not changed in yan mutant
1919 total Yan peaks 9% peaks gained in pnt mutant
71% peaks lost in pnt mutant 20% peaks
not changed in pnt mutant
D
P
F
G-t
n
P
n
a
Y
60
60
60
60
neur
hyx
Chr3R:4,846,000-4,868,000
F
WTWT
pnt yan
G
cv2 jing aos lace Rapgap1
neur NC1
0 5 10 15 20
Y
an
Occupancy
(
%
I
nput)
wildtype
pnt mutant
H
Yan o nly
Yan and Pnt
*
Yan-Pnt sequential ChIP
(IP/Mock)
**
E
neur
hyx
Chr3R:4,846,000-4,868,000
cv2 jing aos lace Rapgap1
neur eve NC1
0 2 4 6 12 16
[image:3.612.49.439.53.533.2]aos
Fig. 1. Pnt recruits Yan to chromatin.(A) Comparison of ChIP-seq read density for Pnt-GFP (Pnt) and Yan acrossargos(aos), with RefGene gene track shown below profiles. Asterisk marks the region assessed by ChIP-qPCR. (B) Sequential Yan-Pnt ChIP-qPCR analysis plotted as fold increase relative to mock-treated control, normalized to a negative control region (NC1; Webber et al., 2013a), using mean±s.e.m. from two (cv-2andlace) or more separate experiments. (C,E) ChIP-seq read density profiles for Pnt-GFP and Yan from wild-type (WT) andyanorpntmutant embryos atneur. Red shading highlights an example of statistically significant reduction in Yan occupancy. (D,F) Pie charts showing the proportion of Pnt or Yan peaks gained or lost in the reciprocal mutant background. (G) ChIP-qPCR analysis of Yan occupancy at candidate target regions from either control (wild-type) orpntmutant embryos. Data from at least three separate experiments are plotted as mean±s.e.m. normalized to a negative control region. (H) Comparison of ratios of Yan read density inpntmutants relative to the wild-type control. Yan-bound regions that do not intersect with a Pnt-bound peak were less affected by loss ofpnt than peaks that intersect Pnt. **P<0.01 (Student’st-test).
DEVEL
O
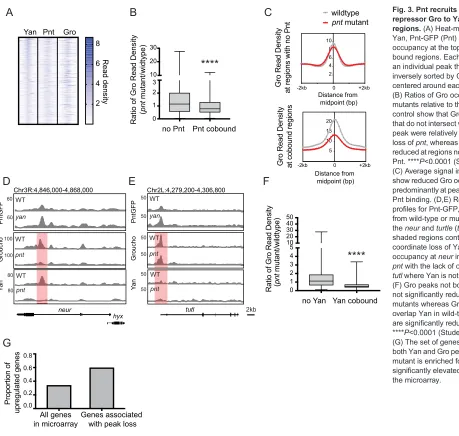
immediately stood out. Because the published datasets were not appropriately stage-matched to our work, we performed ChIP-seq analysis of Gro in stage 11 wild-type embryos. The results confirmed the similarity of the Gro binding landscape to that of Yan and Pnt. Intersecting high confidence peaks of Gro with the Yan and Pnt datasets revealed a 54% and 37% overlap, respectively, and heat-map analysis of Yan/Pnt co-bound regions suggested even greater overlap (Fig. 3A).
To determine whether proper Gro occupancy requires Pnt, we
performed ChIP-seq analysis of Gro in apntmutant background.
Western blot analysis revealed no significant change in Gro protein
levels inpntmutant versus wild-type embryos (Fig. S3A,B) and Gro
occupancy was only moderately affected at regions of the genome without nearby Pnt binding (Fig. 3B,C). In contrast, analogous to
our finding of reduced Yan occupancy inpnt null animals, Gro
binding was reduced in regions of the genome where Gro and Pnt profiles normally overlap (Fig. 3C). Comparison of the ChIP-seq peaks suggested that loss of Gro occurred at regions that also
displayed reduced Yan occupancy in pnt null embryos. For
example, Gro occupancy was lost across the neuralized locus
(Fig. 3D), in patterns similar to those observed for Yan loss, but was
barely reduced at the turtle locus, which does not bind Yan
(Fig. 3E). Plotting the ratio of Gro occupancy at bound regions in
pnt mutants relative to the wild-type control confirmed that the
reduction of Gro in the absence ofpntis more severe at Yan and
Gro co-occupied sites, than at sites that are not bound by Yan (Fig. 3F). Taken together, these data indicate that Pnt recruits both Gro and Yan to common regulatory elements, raising the possibility of coordinated Yan-Pnt-Gro occupancy and repression of the associated target gene.
We tested this prediction by correlating gene expression changes
inpntmutant embryos with the changes in Yan and Gro occupancy
described above. Of the 320 genes associated with Yan and
Gro occupancy loss in pntmutants, 129 were represented in the
custom microarray. Of these, 107 were differentially expressed in
the absence in ofpnt, with 72% displaying upregulated expression
(Fig. 3G). Using the converse approach, upregulated genes identified in the microarray had reduced Yan and Gro signal
intensity inpntmutants relative to wild type; this list included the
validated Gro target E(spl)mbeta-HLH (Fig. S3C, Fig. S4). We
conclude that the loss of Yan and Gro occupancy that occurs inpnt
mutant embryos reflects a novel mechanism by which Pnt recruits and collaborates with these two repressive factors to negatively regulate expression at a significant subset of target genes.
Pnt mediates repressive inputs ateve
Having defined a novel role for Pnt in recruitment of Yan and Gro, we next investigated how these interactions influence expression at
a specific locus. The heart identity gene eve provided an ideal
vantage point to do this because of the already deep mechanistic understanding of how Yan repressive and Pnt activating inputs are organized at specific enhancers (Halfon et al., 2000; Webber et al., 2013b; Boisclair Lachance et al., 2018). In stage 11 embryos, Eve is expressed in segmentally arrayed clusters of cells in the developing cardiogenic mesoderm. Yan and Pnt exert antagonistic inputs at the
level of a pattern-driving MHE, such that inyanmutant embryos
extra Eve+cells are specified, whereas inpntmutant embryos, the
number of Eve+ cells specified is reduced (Halfon et al., 2000).
Additional repressive input is provided by D1, a Yan-responsive element, deletion of which results in elevated and more variable Eve expression (Webber et al., 2013b).
Matching the pattern of Yan occupancy (Webber et al., 2013a), tag
density profiles of Pnt at theevelocus revealed enrichment at both the
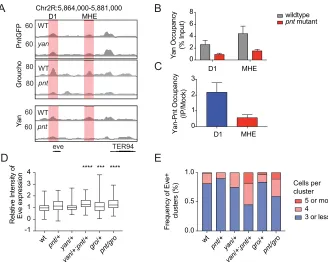
D1 and MHE regulatory regions (Fig. 4A); Pnt occupancy at the D1 region, which genetically appears to be dedicated to dampening Eve expression (Webber et al., 2013b), further supports the suggestion of a role for Pnt in repressive regulation. Analysis of the Yan
genome-wide ChIP dataset in pnt mutant embryos suggested that Pnt is
required for proper Yan occupancy at both the MHE and D1; ChIP-qPCR confirmed this dependency (Fig. 4B). To test whether Yan and Pnt are co-bound, we performed sequential ChIP. Although we were
unable to detect co-occupancy at the eve MHE, simultaneous
occupancy was detected at the eve D1 region (Fig. 4C). One
explanation for the negative results at the MHE is that we are simply below the detection threshold. Indeed, both the genome-wide ChIP data sets and the ChIP-qPCR confirmation experiments always show low enrichment at the MHE, perhaps indicating that Yan/Pnt occupancy/co-occupancy of this pattern-driving enhancer occurs in
only the small subset of mesodermal cells from which Eve+
pericardial cells are specified. Alternatively, Yan and Pnt might
-4 -2 0 2 4
1 2 3 4
Log2 Fold change
(pnt mutant/wildtype)
-Log10(P-value)
Downregulated Upregulated
aos edleveaoppnr tincAdhr IA2
-1.0 -0.5 0.0 0.5 1.0 1.5 2.0
Log2 Fold Change (pnt
mutant/wildtype
)
aosmaeeveaoppnrtincAdhr IA2
0.25 0.5 1 2 4 8 16
Fold change
(
pnt
mutant/wildtype
)
A
B
Array data qPCR
-5 0 5 10
2 4 6 8 10
log2 fold change yan mutant/wildtype
log2 fold change pnt mutant/wildtyp
e
C
[image:4.612.55.492.57.272.2]R = 0.72
Fig. 2. Yan and Pnt negatively regulate gene expression.
(A) Volcano plot depicting fold change in gene expression in apntmutant relative to wild type versusP-value. Probes that pass aP-value threshold for either up- or downregulated expression are depicted in red and blue, respectively. (B) qPCR confirmation of gene expression changes detected in the microarray. Mean±s.e.m. of at least three independent experiments. (C) Scatterplot shows a strong correlation between differential gene expression in theyanandpntdatasets.
DEVEL
O
co-occupy the D1 but not the MHE, with 3D interactions enabling D1-bound Pnt to recruit/stabilize Yan occupancy at both the D1 and the MHE. Although further testing will be required to distinguish between these possibilities, in support of the latter, long-range interactions between the D1 and MHE stabilize Yan occupancy at the two elements (Webber et al., 2013b; Boiclair Lachance et al., 2018).
Because complete loss ofpntresults in reduced Eve expression,
we devised an alternative genetic strategy to assess repressive function. We reasoned that embryos heterozygous for Yan might provide a suitably sensitized background to reveal a role for Pnt-mediated repressive regulation. We first assessed Eve expression
levels in animals heterozygous for eitheryanorpntand compared
these with Eve levels in double heterozygotes. Theyanandpnt
loss-of-function alleles were fully recessive, with no significant change in Eve expression detected relative to wild-type control (Fig. 4D). In
contrast, in yan/+;pnt/+ embryos, Eve levels were significantly
elevated and extra Eve+ cells were specified (Fig. 4D,E). We
repeated the experiment using a functional Eve-YFP BAC transgene (Webber et al., 2013b) and again measured elevated Eve levels in doubly heterozygous animals compared with single heterozygotes (Fig. S5). Together, these data suggest a cooperative function for
Yan and Pnt in negative regulation ofeve.
We extended the dose-sensitive genetic interaction analysis to assess involvement of the co-repressor Gro, occupancy of which at
both theeveMHE and D1 is reduced in the absence ofpnt(Fig. 4A).
Consistent with previous studies of Gro’s repressive input at eve
(Helman et al., 2011), we observed increased Eve levels and extra
Eve+cells ingro/+embryos; both phenotypes were enhanced in
pnt/grodoubly heterozygous animals (Fig. 4D,E). We conclude that Yan, Pnt and Gro work collaboratively to negatively regulate Eve
levels and Eve+cell fate specification in the cardiogenic mesoderm.
Pnt integrates with pausing machinery to maintain a poised state
The inherent conflict of recruiting both active and repressive histone marks to a given bound region is characteristic of a balanced chromatin state, whereby genes are held silent, but poised for transcriptional activation (Schwartz et al., 2010; Gaertner et al., 2012). Analogously, at the transcription factor level co-occupancy by the activator-repressor pair Pnt/Yan could both prevent
inappropriate activation of eve under sub-threshold signaling
conditions and prime the locus for rapid transcriptional activation following the onset of upstream signaling. Meta-analysis of publicly available ChIP-seq data for three different chromatin modifications
4 2 6 8 10 10 15 n a Y o h c u or G P F Gt n P neur hyx Chr3R:4,846,000-4,868,000 WT pnt 80 80 WT pnt 100 100 WT yan 60 60
A
2 4 6 8Yan Pnt Gro
yt i s n e d d a e R yti s n e D d a e R or G f o oit a R ) e p yt di w/t n at u m t n p (
B
Gro Read Density at cobound regions
5 20
wildtype
pnt mutant
0 +2kb -2kb Distance from midpoint (bp) 0 +2kb -2kb Distance from midpoint (bp)
Gro Read Density
at regions with no Pnt
C
E
30 20 10 3 2 1 0no Pnt Pnt cobound
F
0 1 2 3 4 5 10 20 30 40 50Ratio of Gro Read Densit
y ( pnt mutant/wildtype ) n a Y o h c u or G P F Gt n P 50 50 50 50 50 50 WT pnt WT pnt WT yan
D
tutl 2kb Chr2L:4,279,200-4,306,800 0.0 0.2 0.4 0.6 0.8 Proportion of upregulated gene s All genes in microarray Genes associated with peak lossG
no Yan Yan cobound
****
[image:5.612.51.510.52.488.2]****
Fig. 3. Pnt recruits the co-repressor Gro to Yan-bound regions.(A) Heat-map analysis of Yan, Pnt-GFP (Pnt) and Gro occupancy at the top 250 Yan/Pnt-bound regions. Each row represents an individual peak that spans 2 kb, inversely sorted by ChI signal and centered around each peak midpoint. (B) Ratios of Gro occupancy inpnt mutants relative to the wild-type control show that Gro bound regions that do not intersect with a Pnt-bound peak were relatively unaffected by loss ofpnt, whereas Gro binding was reduced at regions normally bound by Pnt. ****P<0.0001 (Student’st-test). (C) Average signal intensity plots show reduced Gro occupancy occurs predominantly at peaks with wild-type Pnt binding. (D,E) Read density profiles for Pnt-GFP, Gro and Yan from wild-type or mutant embryos at theneurandturtle(tutl) loci. Red shaded regions contrast the coordinate loss of Yan and Gro occupancy atneurin the absence of pntwith the lack of change in Gro at tutlwhere Yan is not normally bound. (F) Gro peaks not bound by Yan are not significantly reduced inpnt mutants whereas Gro peaks that overlap Yan in wild-type conditions are significantly reduced. ****P<0.0001 (Student’st-test). (G) The set of genes associated with both Yan and Gro peak loss in thepnt mutant is enriched for genes with significantly elevated expression in the microarray.
DEVEL
O
from 4-8 h embryos, which includes the stage 11 time point used in
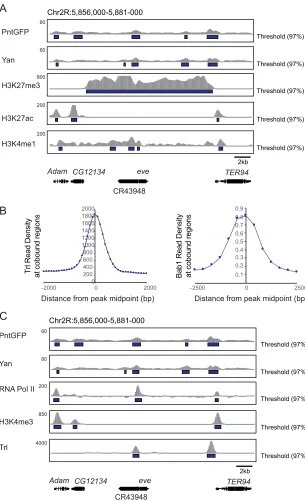
our ChIP experiments, provided circumstantial evidence that eve
may be poised. Specifically, the combination of negligible H3K27ac, which exclusively marks active enhancers, prominent H3K4me1, a mark of both poised and active enhancers, and prominent H3K27me3, a mark that in the absence of H3K27ac
indicates a poised state, suggests that theevelocus may be poised
(Rada-Iglesias et al., 2011; Bonn et al., 2012; Koenecke et al., 2017; Fig. 5A).
Poised genes commonly employ an RNA pol pausing strategy whereby RNA pol II is recruited and initiates transcription, but then pauses downstream of the transcription start site (TSS) until it receives the appropriate signaling cues for pause release (reviewed by Gaertner
and Zeitlinger, 2014). Recent work inDrosophilacell lines implicates
Gro in RNA pol II pausing (Kaul et al., 2014), an intriguing association given our discovery of a role for Pnt in recruiting Gro,
including to theeveMHE and D1 enhancers (Fig. 3D,E, Fig. 4A).
Furthermore, meta-analysis of genome-wide ChIP datasets revealed frequent overlap between Yan and Pnt occupancy patterns with those of components of the pausing machinery, including Trithorax-like (Trl, also known as GAGA factor) and Bric à brac 1 (Bab1) (Fig. 5B;
Contrino et al., 2012; Tsai et al., 2016). Focusing oneve, the locus
bears hallmarks of pausing with high pol II occupancy near the TSS, together with low incidence of H3K4me3 and overlap with the pausing factor Trl (Fig. 5C; Contrino et al., 2012; Lee et al., 2008; Fuda et al., 2015; Gaertner et al., 2012; Tsai et al., 2016).
Usingeveas our model, we assessed genetic interactions between
Pnt and members of the pausing machinery. We first tested whether
heterozygosity for eitherTrlorbab1could influence Eve expression
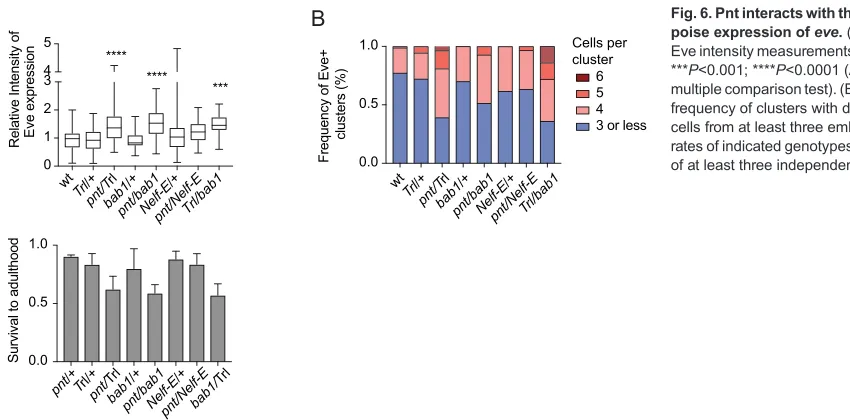
and observed no significant change in Eve levels (Fig. 6A). In
contrast, embryos doubly heterozygous for eitherpntandTrlorpnt
and bab1 displayed significantly increased Eve levels with a
corresponding increase in the number of Eve+ cells specified
(Fig. 6A,B). Similar changes in Eve expression and number of Eve+
cells were observed in embryos doubly heterozygous for eitherTrl
andbab1oryan/groandTrl(Fig. 6A,B, Fig. S6). A trend towards
increased Eve expression was also observed inpnt/Nelf-Edouble
heterozygotes, although the relative increase was not statistically different from control, perhaps because of the maternal contribution of Nelf-Eand/or the multi-subunit nature of the NELF complex (Wang et al., 2010; Wu et al., 2005). Survival to adulthood of
animals doubly heterozygous for eitherpntandTrlorpntandbab1
was half that of any of the three single heterozygotes (Fig. 6C), suggesting that interactions between Pnt and the pausing machinery
may play a broader role in development beyondeve.
DISCUSSION
The precision with which multipotent cells commit to specialized fates relies on regulated de-repression of gene transcription. Thus, in stem cells and in early embryos, concomitant with the initial opening of chromatin domains by pioneer factors, conflicting epigenetic marks deposited at the promoters of many developmentally important genes recruit yet stall RNA pol II, thereby maintaining repression and multipotency. How such epigenetic-based repressive poising is coordinated with the transcription factors that respond to inductive cues to direct specific cell fate transitions as development proceeds is not well understood. Our study positions the ETS1 homolog and transcriptional activator Pointed (Pnt) as a key integration point between the transcriptional repressive complexes that assemble at regulatory elements across a locus and the molecular complexes that establish, maintain and release RNA pol II pausing. The results not only re-define the classic Yan-Pnt cell fate switch paradigm in
Drosophila, but more broadly uncover a novel strategy by which genetic and epigenetic regulation is coordinated to confer robustness to developmental cell fate transitions.
The accepted model for Yan and Pnt function predicts mutually exclusive occupancy at enhancers, with RTK signaling triggering the transition from an initial Yan-bound repressed state in uncommitted progenitors to a subsequent Pnt-bound activated state that drives cell fate acquisition. Our study paints a different picture in which Pnt plays a role in establishing and stabilizing that initial Yan-bound repressed state, and in fact co-occupies many regulatory elements with Yan. It is important to note that because the sequential ChIP analysis was not a genome-wide study and
n
a
Y
o
h
c
u
or
G
P
F
Gt
n
P
80
80
60
60 60
60
Chr2R:5,864,000-5,881,000
WT
pnt
WT
pnt WT
yan
eve TER94
T
t
0 2 4 6 8
Y
a
n Occupancy (% Input)
wildtype
pnt mutant
0 1 2 3
Yan-Pnt Occupancy
(IP/Mock)
D1 MHE
D1 MHE
A
B
C
D
E
wt
pnt/+yan/+
yan
/+;pnt /+
gro
/+
pnt/gro -1
0 1 2 3 4
Relative Intensity of Eve expression
**** *** ****
wt
pnt/+yan
/+
yan
/+;pnt /+
gro
/+
pnt/gro 0.0
0.5 1.0
Frequency of Eve+
clusters (%) 3 or less
4 5 or more Cells per cluster
D1 MHE
T
[image:6.612.50.378.56.318.2]n
Fig. 4. Yan, Pnt and Gro collaborate to fine-tune
eveexpression.(A) Read density profiles for Pnt-GFP, Gro and Yan from wild-type or mutant embryos at theevelocus. Red shading shows that Pnt-GFP occupancy is broadly maintained at the MHE and D1 in the absence of Yan, whereas Yan and Gro occupancy is reduced at both elements in the absence of Pnt. (B) ChIP-qPCR analysis of Yan occupancy at the D1 and MHE in stage 11 wild-type orpntmutant embryos. Data from at least five separate experiments are plotted as mean±s.e.m. normalized to a negative control region.
(C) Sequential ChIP detects Yan-Pnt co-occupancy at the D1 but not at the MHE. Fold increase relative to mock-treated control and normalized to a negative control region is plotted. Bars represent mean±s.e.m. of at least six independent experiments. (D) Quantification of average Eve levels per cluster in different genetic backgrounds. Box plots depict measurements from at least 70 clusters. ***P<0.001; ****P<0.0001 (ANOVA with Tukey’s multiple comparison test). (E) Bar charts depicting the frequency of clusters with different numbers of Eve+cells from at least seven embryos.
DEVEL
O
because whole embryos rather than single cells were profiled, it is possible that Yan-Pnt co-occupancy only occurs at a small subset of targets and that the broad similarity in overall occupancy patterns primarily reflects a mix of exclusively Yan or exclusively Pnt binding at the same enhancers in different cells. Arguing against
this, the genome-wide loss of Yan occupancy inpntmutants and
normal Pointed occupancy inyanmutants positions Pointed as the
critical determinant and/or stabilizer of Yan binding and repression, with co-occupancy likely relevant to the mechanism.
We therefore speculate that Pnt is required first to set up Yan occupancy and repression and second to respond to RTK signaling by activating target gene expression; its activating function is thus epistatic to its repressive role, explaining why predominantly
loss-of-function phenotypes have been described forpntmutants. Use of
the same transcription factor to dictate both the repressive regulation
that maintains the initial multipotent state and the subsequent activation that changes it, enables a level of temporal coordination of gene expression dynamics that may be crucial to the robustness of differentiative transitions. We also note that although Yan/Pnt function has been studied primarily in the context of RTK signaling, the two are co-expressed in many tissues across development, including those presumed to have low RTK signaling input (Gabay et al., 1997; Boisclair Lachance et al., 2014), and co-occupy regulatory elements across a broad swath of signaling pathway genes and crucial developmental regulators that are unlikely all to be regulated downstream of RTK signaling. Thus, Pnt-Yan-Gro enhancer co-occupancy may provide a modular repressive mechanism that can be adapted to a variety of regulatory situations. How Pnt-Yan co-occupancy is organized/facilitated by the DNA sequence of each enhancer will be interesting to explore. One Threshold (97%)
Threshold (97%)
Threshold (97%)
Threshold (97%)
Threshold (97%)
Chr2R:5,856,000-5,881-000
2kb 60
60
800
200
200
eve TER94
CR43948 Adam CG12134
PntGFP
Yan
H3K27me3
H3K27ac
H3K4me1
A
Threshold (97%)
Threshold (97%)
Threshold (97%)
Threshold (97%)
Threshold (97%)
2kb
eve TER94
CR43948 Adam CG12134
Chr2R:5,856,000-5,881-000
PntGFP
Yan
RNA Pol II
H3K4me3
Trl
C
60 60
200
850
4000
B
200 400 600 800 1000 1200 1400 1600 1800 2000
0
-2000 0 2000
Trl Read Density at cobound regions
Distance from peak midpoint (bp)
0.1 0.2 0.3 0.4 0.5 0.6 0.7 0.8 0.9
Bab1 Read Density at cobound regions
2500 0 2500
Distance from peak midpoint (bp)
-Fig. 5. Chromatin marks and TF occupancy associated with theevelocus predict a poised chromatin state. (A) Theevelocus is associated with the poised chromatin signature comprising H3K27me3 and H3K4me1 and depletion of H3K27ac. ChIP-seq profiles of modEncode datasets (H3K27me3: stage 4-8 h embryos, modEncode 811; H3K4me3: stage 4-8 h embryos, modEncode 778; H3K27ac: stage 4-8 h embryos, modEncode 835) were visualized using IGB. Yan and Pnt ChIP datasets are shown for reference. The RefGene gene track is shown below the profiles. Blue boxes depict peaks called using IGB and a 97% threshold. (B) Trl and Bab1 are associated with Yan-, Pnt- and Gro-bound regions. Aggregate binding profiles of Trl (GAF: stage 8-12 embryos, modEncode 3397) and Bab1 (Bab1: 0-12 h embryos, modEncode 628) were generated for regions of the genome bound by Yan, Pnt and Gro. (C) ChIP-seq profiles of Trl, H3K4me3 and RNA pol II (GAF: stage 8-12 embryos; H3K4me3: stage 4-8 h embryos, modEncode 790; RNA pol II: stage 4-8 h embryos, modEncode 846) at theevelocus. Blue boxes depict peaks called using a 97% threshold with IGB.
DEVEL
O
[image:7.612.49.354.56.557.2]possibility is that Pnt initially interacts with all ETS binding sites to open up a regulatory element, but then gets displaced at a subset of sites upon recruitment of Yan, perhaps remaining bound only at sites required for subsequent activation. Alternatively, distinct sequence preferences rather than affinity differences might result in Pnt occupancy of only a specific subset of ETS binding sites, leaving others free for Yan to bind. This model also supports a variation in mechanism by which Pnt and Yan are recruited jointly, rather than sequentially, to establish the initial repressed state, with co-occupancy essential to stabilize Yan binding. Our recent work
exploring how the cis-regulatory organization of the eve MHE
organizes Yan and Pnt inputs supports the idea that distinct sequence preferences enable simultaneous occupancy and hence complex integration of repressive and activating inputs (Boisclair Lachance et al., 2018).
The mechanism by which Yan occupancy depends on Pnt also remains to be elucidated. One possibility is that Pnt recruits Yan directly. However, to date our efforts to detect Yan-Pnt
protein-protein interactions, either in vitro, in two-hybrid screens, or
in standard co-immunoprecipitation experiments, have yielded negative results. Indirect protein-level interaction mechanisms, such as bridging the complex with Gro or with another transcription factor, may thus be more likely. The strong overlap between Mad and ETS binding sites noted in Yan/Pnt-bound regions genome-wide (Webber et al., 2013a) makes the Dpp effector Mad an intriguing candidate. Alternatively, rather than nucleating specific protein complexes, Pnt may establish or interpret a local chromatin state that permits Yan binding. Analogous pioneer-like activity has been described for a few other ETS factors, including PU.1 (also known as Spi1) and ETV2 (reviewed by Iwafuchi-Doi and Zaret,
2014; Kanki et al., 2017). Aspntencodes two alternatively spliced
products, Pnt-P1 and Pnt-P2, that contain the same DNA-binding domain but different amino-terminal activation domains and exhibit different patterns of expression and signal responsiveness (Klämbt,
1993; Scholz et al., 1993; O’Neill et al., 1994; Brunner et al., 1994;
Gabay et al., 1996; Shwartz et al., 2013), it will be important to re-evaluate the role of each isoform during cell fate transitions with respect to the establishment of Yan/Gro binding, target gene repression and the subsequent switch to activation.
Regardless of the precise mechanism, Yan’s reliance on Pnt for its
stable recruitment provides a plausible explanation for a previous
unexpected finding that doubling Yan dose does not lead to increased or ectopic DNA occupancy (Webber et al., 2013a). More broadly, the strategy of the activator recruiting the repressor could provide an occupancy feedback circuit that buffers against fluctuations in activator or repressor concentrations. For example, the standard competition model predicts that a multipotent cell with lower than normal Pnt will over-recruit Yan; we speculate that such Yan-dominated repression would be sluggish in response to inductive cues. In contrast, a system in which Yan occupancy depends on Pnt might be buffered against such variation, because the consequence of lower Pnt levels would be less efficient Yan recruitment, which should maintain the appropriate Yan-Pnt balance.
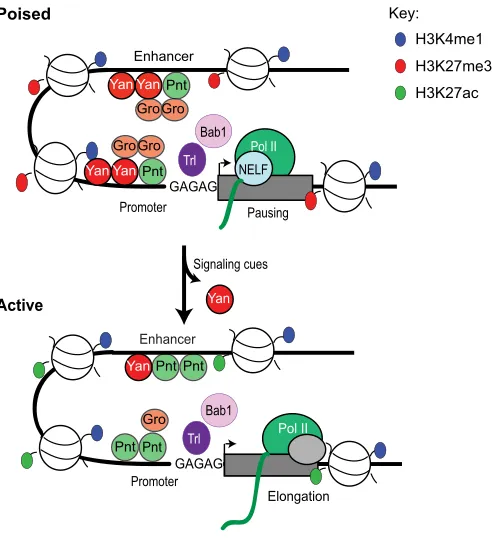
We speculate that this precisely poised Pnt-Yan-mediated repressive state is achieved through close coordination with the RNA pol II pausing machinery (summarized in Fig. 7). Several pieces of evidence support this idea. For example, not only is Pnt essential for proper Yan occupancy, but it also recruits the co-repressor Gro to the same set of regulatory elements. Prior genome-wide analyses of Gro occupancy and function in embryos and cultured cells have shown that Gro-regulated genes are enriched for epigenetic marks and promoter proximal transcripts commonly associated with paused RNA pol II (Kaul et al., 2014; Chambers et al., 2017). Our
demonstration ofevede-repression in embryos doubly heterozygous
forgroandTrlprovides the first genetic evidence of a possible direct
mechanistic link between Gro repressive complexes and the RNA pol II pausing machinery. Our study also emphasizes the likely importance of Pnt to the Gro-paused RNA pol II connection. For example, included among the set of genes showing coordinately
disrupted Yan-Gro occupancy and de-repression in pnt mutant
embryos is E(spl)mbeta-HLH, a target previously shown to be
regulated by Gro-dependent RNA pol II pausing in cultured cells (Kaul et al., 2014 and Fig. S4). The web of synergistic genetic
interactions betweenpnt,yan,groand mutants in RNA pol II pausing
factors, such as Trl, Bab1 and NELF, further supports such a model. RNA pol II pausing establishment and release is also closely
linked to Polycomb (PcG) repressive complexes in bothDrosophila
and mammals (Schwartz et al., 2010; Gaertner et al., 2012; Bernstein et al., 2006; Ferrai et al., 2017) and PcG repression has in turn been connected to Gro (Abraham et al., 2015). For example, a recent study describes how recruitment of the Hox family transcriptional activators AbdA and Ubx reduces PcG binding at RNA pol II
wt
Trl/+ pnt/T
rl
bab1
/+
pnt/bab1Nelf-E
/+
pnt/Nelf-ETrl/bab1 0
1 2 3 4 5
Relative Intensity of Eve expressio
n
**** ****
***
A
pnt/+Trl/+ pnt/
Trl
bab1
/+
pnt/bab1Nelf-E
/+
pnt/Nelf-Ebab1/
Trl
0.0 0.5 1.0
Survival to adulthoo
d
C
wt
Trl/+ pnt/T
rl
bab1
/+
pnt/bab1Nelf-E
/+
pnt/Nelf-ETr l/bab1 0.0
0.5 1.0
3 or less 4 5 6
Frequency of Eve+
clusters (%)
Cells per cluster
B
Fig. 6. Pnt interacts with the pausing machinery topoise expression ofeve.(A) Box plots of relative Eve intensity measurements from at least 30 clusters. ***P<0.001; ****P<0.0001 (ANOVA with Tukey’s multiple comparison test). (B) Bar charts depicting the frequency of clusters with different numbers of Eve+ cells from at least three embryos. (C) Adult survival rates of indicated genotypes, plotted as mean±s.e.m. of at least three independent experiments.
DEVEL
O
[image:8.612.57.482.55.265.2]paused genes to promote release and transcriptional activation (Zouaz et al., 2017). Similarly, ETS1, the mammalian ortholog of Pnt, promotes release of paused RNA pol II to activate angiogenic gene expression, although connections to PcG complexes were not investigated (Chen et al., 2017). Trl, which our study connects genetically to Pnt-Gro-Yan repressive mechanisms, helps direct PcG proteins to Polycomb response elements, or PREs, and thus contributes to PcG repressive activity (Mahmoudi et al., 2003;
Mishra et al., 2003; Mulholland et al., 2003). Given thateveis a PcG
target gene, with a validated PRE (Dura and Ingham, 1988; Fujioka et al., 2008; Kim et al., 2011), it may provide an ideal context for elucidating the molecular levels of integration between Yan-Pnt-Gro and PcG repressive complexes in relation to RNA pol II pausing.
In conclusion, we propose that, analogous to the use of conflicting epigenetic marks to poise RNA pol II, the inherent conflict of co-occupancy by an activator-repressor pair such as Pnt-Yan establishes an exquisitely sensitive and dynamic repressive mechanism that confers robustness to developmental gene expression regulation. Because loss or misexpression of ETS transcription factors contributes to many cancers and because oncogenic transformation relies on dysregulated use of normal developmental pathways, exploration of these ideas in mammalian systems may provide new insight into human disease.
MATERIALS AND METHODS Chromatin immunoprecipitation
All chromatin immunoprecipitation (ChIP) was from stage 11 embryos (approximately 5-7 h after egg lay) processed as previously described (Webber et al., 2013a) and summarized in supplementary Materials and
Methods. Sequential ChIP of Yan and Pnt was performed by first immunoprecipitating Yan (guinea pig anti-Yan; Webber et al., 2013a). The protein-DNA complex was eluted in reduced volume and diluted 1:10 in ChIP lysis buffer before performing the second round of ChIP with a rabbit GFP antibody (rabbit anti-GFP, A6455, Invitrogen, Lot# 1603336). A no antibody control (mock-treated) processed identically to experimental samples was included. For ChIP-seq, two biological replicates and an input sample were sequenced on an Illumina Hi-seq instrument according to the Illumina protocols. The raw sequence data were aligned to the April 2006D.
melanogaster genome using BWA (Li and Durbin, 2009). Following
standard practice in the field (Robertson et al., 2007; Rozowsky et al., 2009; Zhong et al., 2010), having first confirmed consistency between replicates, the two IP reads were combined and peak detection performed using MACS software with an mfold of 3.40 and otherwise default parameters. MACS-defined bound regions were assigned to the nearest gene using the UCSC genome browser and gene ontology enrichment analyses were performed (see supplementary Material and Methods for further details). Top-scoring bound regions were also subjected to Centrimo analysis to identify centrally enriched binding motifs in the Pnt ChIP-seq dataset (see supplementary Materials and Methods for more details). SPP was used to calculate genome-wide tag density profiles. Default parameters were used, with the exception that the scale.by.dataset.size=T option was used to normalize tag density by the total dataset size to make it comparable across samples (Kharchenko et al., 2008). ChIP-qPCR was performed as previously described (Webber et al., 2013a) and is summarized in supplementary Materials and Methods.
Microarray analysis
A custom expression array was designed on the Agilent GE 8×15 K platform. The microarray included 7080 probes for putative Yan target genes identified by Webber et al. (2013a) (designed using the Earray software by Agilent), 1894 probes for random genes and 536 control probes. Total RNA was extracted from stage 11 wild-type,yannull or pntnull embryos with TRIzol Reagent (Invitrogen) following the manufacturer’s protocol, and purified using the RNeasy Mini Kit (Qiagen). Total RNA was labeled and hybridized to the microarray using the Quick Amp One-Color Labeling Kit (Agilent) as described by the manufacturer. Triplicate experiments for each genotype were performed. Expression array data were first analyzed by the Feature Extraction Software (Agilent) using default parameter settings, and the processed signals for the probes were then used for downstream analysis. Linear models were generated for each array using only the probes in the random gene set, and then signals were normalized across all arrays. After normalization, the average signal for each probe across triplicate experiments of each genotype was calculated, and signal fold changes between wild type and thepntoryanmutants were computed.t-tests were performed at the probe level, and probes with a
P-value less than 0.05 were selected as significant (Table S4). For microarray validation, RNA was isolated, reverse transcribed and the resultant cDNA subjected to Real-Time PCR as described in the supplementary Materials and Methods.
Tag density analysis and generation of heat maps
Sorted bed files were produced using the BEDOPS wig2bed script (Neph et al., 2012). To manage the large number of calculations, a Visual Basic Application (VBA) for Microsoft Excel was used to generate matrices of read density data for groups of given bound regions ±5 kb from the midpoint of each individual region. The matrices were used for (1) calculating ratios of transcription factor (TF) occupancy in mutant versus wild type, (2) producing aggregate read density profiles by averaging read density across all peaks and (3) generating TF binding heat maps. For further details, see supplementary Materials and Methods.
Differential binding analysis
Bed files of MACS-defined bound regions and sequence aligned reads for wild-type and mutant datasets for each factor were generated. The differential binding analysis software, MAnorm (Shao et al., 2012), was used to generate a merged set of bound regions for each factor with quantitative values of differential binding and associatedP-values for each peak. These datasets were used to describe patterns of peak gain or peak loss, where peak
Yan
NELF
Pol II Trl
Pnt Enhancer
Pausing Poised
Signaling cues
Pol II
GAGAG Enhancer
Elongation Pnt
Yan Active
Bab1
Promoter
Yan
Gro Gro
YanPnt
Yan
Gro Gro
Pnt
Yan
Gro Pnt
Pnt Trl
Bab1
Promoter GAGAG
[image:9.612.52.300.56.325.2]Key: H3K4me1 H3K27me3 H3K27ac
Fig. 7. Proposed model of Yan-Pnt repressive synergy.Pnt promotes the recruitment and stabilization of Yan and Gro and coordinates interactions with the RNA pol II pausing machinery to maintain a poised state in progenitor cells. Following signaling cues, the disassembly of Yan, Pnt and Gro complexes would release the pol II pause and allow productive elongation. Such a mechanism could act to sense the signaling status of the cell, ensuring that pol II pausing is only released once a given signaling threshold is achieved, thereby conferring precise and perhaps synchronous gene expression.
DEVEL
O
loss corresponds to normalized M values of >0.5 and peak gain of <−0.5 (Fig. 1D,F, Tables S2 and S5).
Eve quantification
For quantification of Eve levels and numbers of Eve+cells, embryos were stained as described by Webber et al. (2013a) with either 1:10 mouse anti-Eve [3C10, Developmental Studies Hybridoma Bank (DSHB)] or 1:1000 rabbit anti-GFP (A6455, Invitrogen, 1603336). Using a Zeiss 880 confocal microscope, serial 0.8 µmz-sections were taken through the Eve-positive mesodermal cells and maximum projections generated. Expression intensity was calculated as the mean pixel intensity for each Eve+cluster minus the mean background pixel intensity, normalized to the average cluster intensity of the control imaged in the same session. For cell counts, Eve+cells were counted by going throughz-stack projections of the relevant slices. For rescue experiments, stage 11 embryos of each genotype were hand-selected, transferred to vials and incubated at 25°C until adults emerged.
Yan and Gro quantification
For Yan expression analysis, wild-type orpntΔ88embryos were stained as described by Boisclair-Lachance et al. (2014) with 1:10,000 guinea pig anti-Yan (Webber et al., 2013a). For western blot analysis described in Fig. S3, stage 11 wild-type orpntΔ88embryos were dechorionated in 50% bleach and homogenized in 50 µl of SDS sample buffer [250 mM Tris-Cl ( pH 8), 10% SDS, 50% glycerol, 50% β-mercaptoethanol, 0.04% bromophenol blue]. Samples were passed through a 27G needle 10 times and boiled for 10 min prior to running on an 8% SDS-PAGE gel. After transfer to PVDF, blots were probed with 1:100 mouse anti-Gro (DSHB) antibody and 1:2000 mouse anti-tubulin (T9026, Sigma) antibody, which served as a loading control.
Drosophilastrains and genetics
The following stocks were obtained from the BloomingtonDrosophilaStock Center: w1118, pntΔ88/TM3,Sb1, w1;Trl13C/TM6B,Sb1,Tb1, Df(3L)babAR07,
bab1AR07,bab2AR07/TM6B,Tb1 and y1,w67c23; P{w+mC]y+mDint2=EPgy2}
EY07065/TM3, Sb1,Ser1. Additional stocks used include: groMB36
(Jennings et al., 2008), pntAF397 (Rebay et al., 2000), yanER443 and yanE833(Karim et al., 1996),Pnt-GFP(Boisclair Lachance et al., 2014), and
Eve-YFP(Webber et al., 2013b). To allow genotyping of stage 11 embryos,
stocks were rebalanced overtwist-Gal4>UAS-GFPmarked second and third chromosome balancers.
Statistical analysis
Data are presented as mean±s.e.m. except where otherwise described and minimum sample sizes are reported in each figure. Data were plotted and analyzed for statistical significance using Graphpad Prism software. Statistical significance was determined either by a two-tailedt-test where appropriate, or alternatively with a one-way ANOVA in combination with Tukey’s multiple comparison tests to compare two or more groups.P-values less than 0.05 were considered to be statistically significant.
Acknowledgements
We thank Pieter Faber, Mikayka Marchuk and Abhilasha Cheruku in the University of Chicago Genomics Facility for help with ChIP-seq and microarray. Jean-Francois Boisclair Lachance, Kohta Ikegami, Rebecca Spokony and Matthew Slattery provided many helpful discussions and comments on the manuscript. We
acknowledge the BloomingtonDrosophilaStock Center (NIH P40OD018537) and
the Developmental Studies Hybridoma Bank (created by the NICHD of the NIH) for reagents.
Competing interests
The authors declare no competing or financial interests.
Author contributions
Conceptualization: J.L.W., J.Z., N.S.-L., I.R.; Methodology: J.L.W., N.S.-L.; Software: J.L.W., A.M., N.S.-L.; Validation: J.L.W.; Formal analysis: J.L.W., A.M.; Investigation: J.L.W., J.Z., A.M.; Resources: A.M.; Data curation: J.L.W.; Writing -original draft: J.L.W.; Writing - review & editing: J.L.W., I.R.; Visualization: J.L.W., A.M.; Supervision: J.L.W., I.R.; Project administration: J.L.W., I.R.; Funding acquisition: J.L.W., I.R.
Funding
This work was supported by grants from the American Heart Association (12POST12040225/Jemma Webber/2012-2014 and 15POST22660028/Jemma Webber/2015 to J.L.W.) and the National Institute of General Medical Sciences (R01 GM080372 to I.R.), and by the Genomics Core Facility through a University of Chicago Cancer Center Support Grant (P30 CA014599). N.S.-L. was supported in part by the National Institute of General Medical Sciences (T32 GM007281) and the National Eye Institute (R01 EY12549 to I.R.). Deposited in PMC for release after 12 months.
Data availability
ChIP-seq and microarray data from this study have been deposited at Gene Expression Omnibus with accession numbers GSE114092 and GSE114209, respectively.
Supplementary information
Supplementary information available online at
http://dev.biologists.org/lookup/doi/10.1242/dev.165985.supplemental
References
Abraham, S., Paknikar, R., Bhumbra, S., Luan, D., Garg, R., Dressler, G. R. and Patel, S. R.(2015). The Groucho-associated phosphatase PPM1B displaces Pax Transactivation Domain Interacting Protein (PTIP) to switch the transcription factor
Pax2 from a transcriptional activator to a repressor.J. Biol. Chem.290, 7185-7194.
Bauer, D. C., Buske, F. A. and Bailey, T. L.(2010). Dual-functioning transcription
factors in the developmental gene network of Drosophila melanogaster.BMC
Bioinformatics11, 366.
Bernstein, B. E., Mikkelsen, T. S., Xie, X., Kamal, M., Huebert, D. J., Cuff, J., Fry, B., Meissner, A., Wernig, M., Plath, K. et al.(2006). A bivalent chromatin
structure marks key developmental genes in embryonic stem cells.Cell125,
315-326.
Boisclair Lachance, J.-F., Peláez, N., Cassidy, J. J., Webber, J. L., Rebay, I. and Carthew, R. W.(2014). A comparative study of Pointed and Yan expression reveals new complexity to the transcriptional networks downstream of receptor
tyrosine kinase signaling.Dev. Biol.385, 263-278.
Boisclair Lachance, J.-F., Webber, J. L., Hong, L., Dinner, A. and Rebay, I. (2018). Cooperative recruitment of Yan via a high-affinity ETS supersite organizes repression to confer specificity and robustness to cardiac cell fate specification. Genes Dev.32, 389-401.
Bonn, S., Zinzen, R. P., Girardot, C., Gustafson, E. H., Perez-Gonzalez, A., Delhomme, N., Ghavi-Helm, Y., Wilczyński, B., Riddell, A. and Furlong, E. E. M.(2012). Tissue-specific analysis of chromatin state identifies temporal
signatures of enhancer activity during embryonic development.Nat. Genet.44,
148-156.
Brunner, D., Dücker, K., Oellers, N., Hafen, E., Scholzi, H. and Klämbt, C.(1994). The ETS domain protein pointed-P2 is a target of MAP kinase in the sevenless
signal transduction pathway.Nature370, 386-389.
Chambers, M., Turki-Judeh, W., Kim, M. W., Chen, K., Gallaher, S. D. and Courey, A. J.(2017). Mechanisms of Groucho-mediated repression revealed by
genome-wide analysis of Groucho binding and activity.BMC Genomics18, 215.
Chen, J., Fu, Y., Day, D. S., Sun, Y., Wang, S., Liang, X., Gu, F., Zhang, F., Stevens, S. M., Zhou, P. et al.(2017). VEGF amplifies transcription through ETS1
acetylation to enable angiogenesis.Nat. Commun.8, 383.
Contrino, S., Smith, R. N., Butano, D., Carr, A., Hu, F., Lyne, R., Rutherford, K., Kalderimis, A., Sullivan, J., Carbon, S. et al.(2012). modMine: flexible access
to modENCODE data.Nucleic Acids Res.40, D1082-D1088.
Dura, J. M. and Ingham, P.(1988). Tissue- and stage-specific control of homeotic and segmentation gene expression in Drosophila embryos by the polyhomeotic
gene.Development103, 733-741.
Ferrai, C., Torlai Triglia, E., Risner-Janiczek, J. R., Rito, T., Rackham, O. J. L., de Santiago, I., Kukalev, A., Nicodemi, M., Akalin, A., Li, M. et al.(2017). RNA polymerase II primes Polycomb-repressed developmental genes throughout
terminal neuronal differentiation.Mol. Syst. Biol.13, 946.
Fuda, N. J., Guertin, M. J., Sharma, S., Danko, C. G., Martins, A. L., Siepel, A. and Lis, J. T.(2015). GAGA factor maintains nucleosome-free regions and has a
role in RNA polymerase II recruitment to promoters.PLoS Genet.11, e1005108.
Fujioka, M., Yusibova, G. L., Zhou, J. and Jaynes, J. B.(2008). The DNA-binding Polycomb-group protein Pleiohomeotic maintains both active and repressed
transcriptional states through a single site.Development135, 4131-4139.
Gabay, L., Scholz, H., Golembo, M., Klaes, A., Shilo, B. Z. and Klämbt, C.(1996). EGF receptor signaling induces pointed P1 transcription and inactivates Yan
protein in the Drosophila embryonic ventral ectoderm. Development 122,
3355-3362.
Gabay, L., Seger, R. and Shilo, B. Z.(1997). MAP kinase in situ activation atlas
during Drosophila embryogenesis.Development124, 3535-3541.
Gaertner, B. and Zeitlinger, J. (2014). RNA polymerase II pausing during
development.Development141, 1179-1183.
DEVEL
O
Gaertner, B., Johnston, J., Chen, K., Wallaschek, N., Paulson, A., Garruss, A. S., Gaudenz, K., De Kumar, B., Krumlauf, R. and Zeitlinger, J.(2012). Poised RNA Polymerase II changes over developmental time and prepares genes
for future expression.Cell Rep.2, 1670-1683.
Halfon, M. S., Carmena, A., Gisselbrecht, S., Sackerson, C. M., Jiménez, F., Baylies, M. K. and Michelson, A. M. (2000). Ras pathway specificity is determined by the integration of multiple signal-activated and tissue-restricted
transcription factors.Cell103, 63-74.
Helman, A., Cinnamon, E., Mezuman, S., Hayouka, Z., Von Ohlen, T., Orian, A., Jiménez, G. and Paroush, Z.(2011). Phosphorylation of Groucho mediates RTK
feedback inhibition and prolonged pathway target gene expression.Curr. Biol.21,
1102-1110.
Hsu, T. and Schulz, R. A.(2000). Sequence and functional properties of Ets genes
in the model organism Drosophila.Oncogene19, 6409-6416.
Iwafuchi-Doi, M. and Zaret, K. S.(2014). Pioneer transcription factors in cell
reprogramming.Genes Dev.28, 2679-2692.
Jennings, B. H., Wainwright, S. M. and Ish-Horowicz, D.(2008). Differential in vivo requirements for oligomerization during Groucho-mediated repression. EMBO Rep.9, 76-83.
Kanki, Y., Nakaki, R., Shimamura, T., Matsunaga, T., Yamamizu, K., Katayama, S., Suehiro, J.-I., Osawa, T., Aburatani, H., Kodama, T. et al. (2017). Dynamically and epigenetically coordinated GATA/ETS/SOX transcription factor
expression is indispensable for endothelial cell differentiation.Nucleic Acids Res.
45, 4344-4358.
Karim, F. D., Chang, H. C., Therrien, M., Wassarman, D. A., Laverty, T. and Rubin, G. M.(1996). A screen for genes that function downstream of ras1 during
Drosophila eye development.Genetics143, 315-329.
Kaul, A., Schuster, E. and Jennings, B. H.(2014). The Groucho co-repressor is primarily recruited to local target sites in active chromatin to attenuate
transcription.PLoS Genet.10, e1004595.
Kharchenko, P. V., Tolstorukov, M. Y. and Park, P. J.(2008). Design and analysis
of ChIP-seq experiments for DNA-binding proteins. Nat. Biotechnol. 26,
1351-1359.
Kim, S. N., Shim, H. P., Jeon, B.-N., Choi, W.-I., Hur, M.-W., Girton, J. R., Kim, S. H. and Jeon, S.-H.(2011). The pleiohomeotic functions as a negative regulator
of Drosophila even-skipped gene during embryogenesis.Mol. Cells32, 549-554.
Klaes, A., Menne, T., Stollewerk, A., Scholz, H. and Klämbt, C.(1994). The Ets transcription factors encoded by the Drosophila gene pointed direct glial cell
differentiation in the embryonic CNS.Cell78, 149-160.
Klämbt, C.(1993). The Drosophila gene pointed encodes two ETS-like proteins
which are involved in the development of the midline glial cells.Development117,
163-176.
Koenecke, N., Johnston, J., He, Q., Meier, S. and Zeitlinger, J.(2017). Drosophila poised enhancers are generated during tissue patterning with the help of
repression.Genome Res.27, 64-74.
Kurada, P. and White, K.(1998). Ras promotes cell survival in Drosophila by
downregulating hid expression.Cell95, 319-329.
Lagha, M., Bothma, J. P. and Levine, M.(2012). Mechanisms of transcriptional
precision in animal development.Trends Genet. TIG28, 409-416.
Lee, C., Li, X., Hechmer, A., Eisen, M., Biggin, M. D., Venters, B. J., Jiang, C., Li, J., Pugh, B. F. and Gilmour, D. S.(2008). NELF and GAGA factor are linked to
promoter-proximal pausing at many genes in Drosophila.Mol. Cell. Biol. 28,
3290-3300.
Li, H. and Durbin, R.(2009). Fast and accurate short read alignment with
Burrows-Wheeler transform.Bioinformatics25, 1754-1760.
Liu, X., Kraus, W. L. and Bai, X.(2015). Ready, pause, go: regulation of RNA
polymerase II pausing and release by cellular signaling pathways. Trends
Biochem. Sci.40, 516-525.
Ma, J.(2005). Crossing the line between activation and repression.Trends Genet. 21, 54-59.
Mahmoudi, T., Zuijderduijn, L. M. P., Mohd-Sarip, A. and Verrijzer, C. P.(2003). GAGA facilitates binding of Pleiohomeotic to a chromatinized Polycomb response
element.Nucleic Acids Res.31, 4147-4156.
Meng, H. and Bartholomew, B. (2017). Emerging roles of transcriptional enhancers in chromatin looping and promoter-proximal pausing of RNA
Polymerase II.J. Biol. Chem.
Mi, H., Muruganujan, A., Casagrande, J. T. and Thomas, P. D.(2013).
Large-scale gene function analysis with the PANTHER classification system. Nat.
Protoc.8, 1551-1566.
Mishra, K., Chopra, V. S., Srinivasan, A. and Mishra, R. K.(2003). Trl-GAGA directly interacts with lola like and both are part of the repressive complex of
Polycomb group of genes.Mech. Dev.120, 681-689.
Mulholland, N. M., King, I. F. G. and Kingston, R. E.(2003). Regulation of Polycomb group complexes by the sequence-specific DNA binding proteins Zeste
and GAGA.Genes Dev.17, 2741-2746.
Neph, S., Kuehn, M. S., Reynolds, A. P., Haugen, E., Thurman, R. E., Johnson, A. K., Rynes, E., Maurano, M. T., Vierstra, J., Thomas, S. et al. (2012).
BEDOPS: high-performance genomic feature operations. Bioinformatics 28,
1919-1920.
Nüsslein-Volhard, C., Wieschaus, E. and Kluding, H.(1984). Mutations affecting the pattern of the larval cuticle in Drosophila melanogaster: I. Zygotic loci on the
second chromosome.Wilhelm Rouxs Arch. Dev. Biol.193, 267-282.
O’Neill, E. M., Rebay, I., Tjian, R. and Rubin, G. M.(1994). The activities of two Ets-related transcription factors required for Drosophila eye development are
modulated by the Ras/MAPK pathway.Cell78, 137-147.
Rada-Iglesias, A., Bajpai, R., Swigut, T., Brugmann, S. A., Flynn, R. A. and Wysocka, J.(2011). A unique chromatin signature uncovers early developmental
enhancers in humans.Nature470, 279-283.
Rebay, I. and Rubin, G. M. (1995). Yan functions as a general inhibitor of differentiation and is negatively regulated by activation of the Ras1/MAPK
pathway.Cell81, 857-866.
Rebay, I., Chen, F., Hsiao, F., Kolodziej, P. A., Kuang, B. H., Laverty, T., Suh, C., Voas, M., Williams, A. and Rubin, G. M.(2000). A genetic screen for novel components of the Ras/Mitogen-activated protein kinase signaling pathway that interact with the yan gene of Drosophila identifies split ends, a New RNA
recognition motif-containing protein.Genetics154, 695-712.
Reynolds, N., O’Shaughnessy, A. and Hendrich, B. (2013). Transcriptional
repressors: multifaceted regulators of gene expression. Development 140,
505-512.
Robertson, G., Hirst, M., Bainbridge, M., Bilenky, M., Zhao, Y., Zeng, T., Euskirchen, G., Bernier, B., Varhol, R., Delaney, A. et al.(2007). Genome-wide profiles of STAT1 DNA association using chromatin immunoprecipitation and
massively parallel sequencing.Nat. Methods4, 651.
Rogge, R., Green, P. J., Urano, J., Horn-Saban, S., Mlodzik, M., Shilo, B. Z., Hartenstein, V. and Banerjee, U.(1995). The role of yan in mediating the choice
between cell division and differentiation.Development121, 3947-3958.
Rohrbaugh, M., Ramos, E., Nguyen, D., Price, M., Wen, Y. and Lai, Z.-C.(2002). Notch activation of yan expression is antagonized by RTK/pointed signaling in the
Drosophila eye.Curr. Biol.12, 576-581.
Rozowsky, J., Euskirchen, G., Auerbach, R. K., Zhang, Z. D., Gibson, T., Bjornson, R., Carriero, N., Snyder, M. and Gerstein, M. B.(2009). PeakSeq
enables systematic scoring of ChIP-seq experiments relative to controls.Nat.
Biotechnol.27, 66.
Scholz, H., Deatrick, J., Klaes, A. and Klämbt, C.(1993). Genetic dissection of
pointed, a Drosophila gene encoding two ETS-related proteins.Genetics135,
455-468.
Schwartz, Y. B., Kahn, T. G., Stenberg, P., Ohno, K., Bourgon, R. and Pirrotta, V.
(2010). Alternative epigenetic chromatin states of polycomb target genes.PLoS
Genet.6, e1000805.
Shao, Z., Zhang, Y., Yuan, G.-C., Orkin, S. H. and Waxman, D. J.(2012). MAnorm:
a robust model for quantitative comparison of ChIP-Seq data sets.Genome Biol.
13, R16.
Shwartz, A., Yogev, S., Schejter, E. D. and Shilo, B.-Z.(2013). Sequential activation of ETS proteins provides a sustained transcriptional response to EGFR
signaling.Development140, 2746-2754.
Tsai, S.-Y., Chang, Y.-L., Swamy, K. B. S., Chiang, R.-L. and Huang, D.-H.(2016). GAGA factor, a positive regulator of global gene expression, modulates
transcriptional pausing and organization of upstream nucleosomes.Epigenet.
Chromatin9, 32.
Wang, X., Hang, S., Prazak, L. and Gergen, J. P.(2010). NELF potentiates gene
transcription in the Drosophila embryo.PLOS ONE5, e11498.
Webber, J. L., Zhang, J., Cote, L., Vivekanand, P., Ni, X., Zhou, J., Negre, N.,̀ Carthew, R. W., White, K. P. and Rebay, I.(2013a). The relationship between long-range chromatin occupancy and polymerization of the Drosophila ETS family
transcriptional repressor Yan.Genetics193, 633-649.
Webber, J. L., Zhang, J., Mitchell-Dick, A. and Rebay, I.(2013b). 3D chromatin interactions organize Yan chromatin occupancy and repression at the
even-skipped locus.Genes Dev.27, 2293-2298.
Wu, C.-H., Lee, C., Fan, R., Smith, M. J., Yamaguchi, Y., Handa, H. and Gilmour, D. S.(2005). Molecular characterization of Drosophila NELF.Nucleic Acids Res. 33, 1269-1279.
Zhang, Y., Liu, T., Meyer, C. A., Eeckhoute, J., Johnson, D. S., Bernstein, B. E., Nussbaum, C., Myers, R. M., Brown, M., Li, W. et al.(2008). Model-based
Analysis of ChIP-Seq (MACS).Genome Biol.9, R137.
Zhong, M., Niu, W., Lu, Z. J., Sarov, M., Murray, J. I., Janette, J., Raha, D., Sheaffer, K. L., Lam, H. Y. K., Preston, E. et al. (2010). Genome-wide identification of binding sites defines distinct functions for Caenorhabditis elegans
PHA-4/FOXA in development and environmental response.PLoS Genet. 6,
e1000848.
Zhu, S., Barshow, S., Wildonger, J., Jan, L. Y. and Jan, Y.-N. (2011). Ets transcription factor Pointed promotes the generation of intermediate neural
progenitors in Drosophila larval brains. Proc. Natl. Acad. Sci. USA 108,
20615-20620.
Zouaz, A., Auradkar, A., Delfini, M. C., Macchi, M., Barthez, M., Ela Akoa, S., Bastianelli, L., Xie, G., Deng, W.-M., Levine, S. S. et al.(2017). The Hox proteins Ubx and AbdA collaborate with the transcription pausing factor M1BP to regulate
gene transcription.EMBO J.36, 2887-2906.