IMPLEMENTATION OF ASSOCIATION RULE METHOD
AND TOPSIS METHOD TO DECISION SUPPORT SYSTEM
FOR DETERMINING EPIDEMIC DENGUE BASED ON RISK
FACTORS ASSOCIATION
1
ERMATITA, 2FATMALINA FEBRY 1
Sriwijaya University, Department of Information System, Faculty of Computer Sciences 2
Sriwijaya University, Department of Public Health, Sriwijaya University
E-mail: [email protected], [email protected]
ABSTRACT
Endemic prevention of harmful diseases such as dengue fever must be handling seriously to minimize the risk posed by the disease. Dengue Hemorrhagic Fever (DHF) is a disease that causes area endemic. There are various risk factors that can lead to endemic dengue. These risk factors usually associated with one another that could provide great potential occurrence of endemic dengue. This endemic must be overcome in order to save from dengue fever. This study developed a decision support system for prevention of dengue based risk factors association. The modeling of Decision support system used the method of Association Rule combined Technique For Others Reference method by Similarity to Ideal Solution (TOPSIS). Results of this research is a recommendation for decision making handling of endemic dengue based on risk factors associated. The system can be
handling prevention of dengue fever endemic that can be addressed quickly.
Keywords:Keywords: Decision Support Systems, TOPSIS, Endemic, Dengue Fever
1. INTRODUCTION
1.1 Background
Prevention of disease endemic Dengue Hemorrhagic Fever (DHF) is an important thing to be done by any local government or health department and the parties concerned. Endemic disease is a serious problem that is faced by an area (region).
Head of Health Office Palembang City, Anton Suwindro mentioned in a Sindo newspaper on December 23, 2013 that, dengue cases in Palembang during 2012 is recorded 725 cases and 2011 is 500 cases. While until the beginning of December 2013, the number of dengue cases can be reduced down to 450 cases. Therefore, prevention of dengue in Palembang shoud be continued.
Data in 2009 showed Palembang is one of the endemic areas of dengue fever which has highest number of cases primarillu in Ilir Timur II District with the number of 77 people, Ilir Barat I DHF patients 57 and Ilir Timur I patients with DHF 47. Therefore, it takes a work program to control the
spread of dengue fever in the city of Palembang with environmentally sound due to several contributing factor is the number of people a lot, high population mobility, hard water areas and densely populated [1].
For that need to be made a decision support system to determine priority cases of Dengue prevention methods Technique For Others Reference by Similarity to Ideal Solution (TOPSIS) based association of risk factors. This ranking method can provide for areas experiencing endemic and priority handling of dengue fever prevention. This system will provide recommendations on the priority areas that need to be addressed first.
1.2 Research Objectives
The purpose of this research is to create a decision support system dengue prevention priorities based on the risk factors associated with TOPSIS method combined with Association Rule method. While specifically, the purpose of this research is:
2) Identification of the risk factors associated with the method of association rule
3) Build Decision Support Systems determining priority areas Dengue prevention methods Technique For Others Reference by Similarity to Ideal Solution (TOPSIS).
4) Determine the priority recommendations region response to the epidemic of dengue fever.
2. LITERATURE REVIEW
2.2.1 Decision Support System
Decision support system (DSS) is part of a computer-based information system including a knowledge-based system or the management of knowledge that is used to support decision making in an organization or company. Can also be regarded as a computer system that processes data into information to make a decision on a specific semi-structured problems. According to Moore and Chang, DSS can be described as a system that is capable of supporting ad hoc analysis of data, and decision modeling, decision-oriented, the orientation of future planning, and is used in times of unusual [2].
Meanwhile, according to Keen and Scott Morton Decision Support System is an amalgamation of individual intelligence sources with component capabilities to improve decision quality. Decision Support System is also a computer-based information systems for management decision-making that deal with the problems of semi structure [2].
With the above understanding can be explained that the DSS is not a decision-making tool, it is a system that helps decision-makers to equip them with information from data that has been processed by the relevant and necessary to make a decision about a problem more quickly and accurately. So that the system is not intended to replace the decision in the decision-making process.
2.2.2 Purpose Support System
The purpose of the decision support system are:
1. To help managers in making decisions on issues of semi-structured.
2. Provide support for consideration of a manager and instead intended to replace the function of the manager.
3. Improving the effectiveness of decisions made managers more than efficiency improvement.
4. To increase computing speed. Computers allow decision-makers to do a lot of computing quickly at a low cost.
5. Increased productivity. Build a group of decision-makers, especially the experts, can be very expensive. Computerized supporters can reduce the size of the group and allows its members to be in many different locations (saving travel costs). In addition, the productivity of support staff (eg financial and legal analysis) can be improved. Productivity can also be improved using optimization tools that determine the best way to run a business. 6. Support quality. Computers can improve
the quality of decisions made. For example, more and more data is accessed, the more the alternatives can be evaluated. Risk analysis can be done quickly and the views of experts (some of them are planted in areas far away) can be collected quickly and at a lower cost. Expertise can even be taken directly from a computer system through the method of artificial intelligence. With computers, the decision makers can perform complex simulations, examining many possible scenarios, and assess the influence trending quickly and economically. All of these capabilities lead to better decisions.
7. Competitive. Management and enterprise resource empowerment. Competitive pressures led to the decision maker be a difficult task. Competition is based not only on price but also on quality, speed, Customize products, and customer support. The organization must be able to frequently and quickly change the mode of operation, reengineer processes and structures, empowering employees, and innovate. Technology decision-making could create significant empowerment in a way to allow a person to make good decisions quickly, even if they have less knowledge [7].
Overcome cognitive limitations in processing and storage. According to Simon (1977) into Turban, the human brain has a limited ability to process and store information. People sometimes difficult to remember and use an information in a manner that is free from errors [2].
Prevention is simple and does not need high technology. To combat dengue clear and simple steps are needed to foster changes in attitudes and awareness of all parties and the community must to keep to clean the environment. With a large population, supposedly helping people and worked together to clean the environment, just with simple steps conducted by 3M activity, the chain of transmission of aedes aegypti mosquitoes as the cause DHF can be cut, so as not to spread widely. Incidence of dengue cases increased more years with different clinical manifestations [8] [9] This disease is transboundary, which is actually predictable and anticipated through a model of integrated management of infectious diseases in the region based on a comprehensive perspective. [4] [6] [10].
TOPSIS method is a simple principle, whereby the selected alternative other than to have the closeness to ideal solution both positive and negative is far from an ideal solution. The ideal solution is formed if as a composite of the best performance values displayed by each alternative for each attribute. Negative ideal solution is a combination of the worst performance value. The distance to each pole of the performance is measured in terms of Euclidean, with optional weights of each attribute. [11]. This concept is widely used in some models of MADM to solve problems in a practical decision. TOPSIS method is one method that can help the optimal decision-making process to solve problems in a practical decision. This is because the concept is simple and easy to understand, computationally efficient and has the ability to measure the relative performance of alternatives in the decision of simple mathematical form. That's why TOPSIS method is suitable to be used as a decision support. [3]
TOPSIS method based on the concept that the best alternative was selected not only has the shortest distance from the positive ideal solution but it also has the longest distance from the negative ideal solution [3].
3.. RESULTS AND DISCUSSION
Modeling Association of Risk Factors with methods Association Rule Risk factors that may cause epidemics of dengue fever as described above, in this study there were 6 risk factors associated in the review and the potential to cause epidemics of dengue fever. The risk factors are: age, sex, topography, temperature increase, and climate change. To analyze the effect of concurrent risk factors that can lead to an epidemic of dengue
fever, a technique used association rule [5]. Occurrence of a particular set of items is determined by counting the frequent item sets.
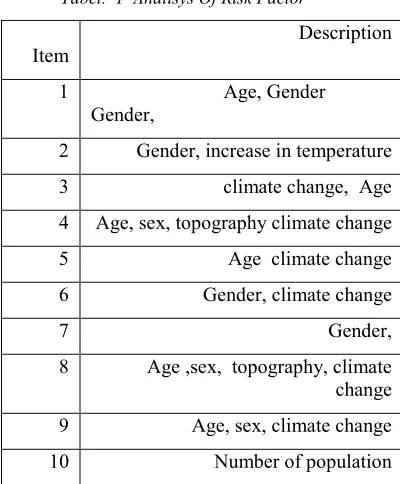
[image:3.612.326.526.204.446.2]As an illustration the following will be exemplified the use of stages in association rule in finding the rule of risk factors incidence of dengue fever. Simulated data on the incidence of risk factors in DHF:
Tabel. 1 Analisys Of Risk Factor
Item
Description
1 Age, Gender
Gender,
2 Gender, increase in temperature
3 climate change, Age
4 Age, sex, topography climate change
5 Age climate change
6 Gender, climate change
7 Gender,
8 Age ,sex, topography, climate change
9 Age, sex, climate change
10 Number of population
[image:3.612.324.528.207.445.2]Furthermore, in Association Rule task to identify each item. Items risk factors Having identified risk factor, further counting the number of risk factors for each item set. Item set frequency is the number of transactions in the first containing a certain set number of items I. Suppose we take for k = 2, required tables each pair of items in order to get a table pair for each item [5].
For {Age, Gender} If (antecedent) = Age
If consequent = Gender, then => If Age then Gender
The next step was largely determines Support and Confidence in ways as follows:
- For Support
Σ Items for risk factors that occur at the same time example above element to {age, Gender}, there are 4 of 10 transactions so as to
Support is:
4_ X 100% = 40%
10
Support = 40%
Confidence is calculated by the following formula:
∑ item
Confidence = --- x 100%
∑ Transaction
Σ Items to happen all at once like the example above the element to {Age, Gender}, there are 4
4
Confidence = --- X100%
5
while the incidence of risk factors for Confident age 5 so that it is:
Having the support and confident in can then multiply so that the percentage can support and confident. This is done for all possible item sets. To get the rule obtained is confident that generate the highest value of the support percentage. Stages in the Association Rule techniques mentioned above will find the pattern. Furthermore patterns found can be used to combat dengue fever is effective, by placing items that often the cause simultaneously[5]. The results of the calculation of the risk factors of several associations of risk factors will be used TOPSIS method for modeling decision support system.
3.2 Modeling with TOPSIS method
Step-by-step method TOPSIS
a. Make a decision matrix that is normalized. (1)
For i = 1,2,.... m and j = 1,2,... n.
b. Make a weighted decision matrix normalized.
(2)
c. Determining the ideal solution matrix of positive and negative ideal solution matrix..
(3)
(4)
d. b. c. Determining the ideal solution matrix of positive and negative ideal solution matrix.
(5)
(6)
e. b. c. e. Determining the value of the preference for each alternative.
(7)
[image:4.612.313.549.56.646.2]The criteria set out in this study are:
Table. 4 Criteria
Code Criteria
C1 Age- Gender
C2 increase in temperature -Climate change
C4 Age –Number of population
C5 Gender-climate change
With a weight of each of the following criteria::
Table 5. Bobot Criteria
Code Criteria Value
C1 Age –Gender 5
C2 increase in temperature –climate change
3
C3 Topography – Number of population
4
C4 Age – number of population
2
C5 Gender 5
[image:5.612.77.521.69.428.2]Table..5 shows the weight value within each criterion dengue epidemics. The weights of each criterion needs different each others. Here is an example of an alternative value for the five criteria above:
Table 6. Value Alternative To Criteria
Alternative code
C1 C2 C3 C4 C5
A1 5 2 1 4 1
A2 5 1 1 3 1
A3 5 3 1 4 1
Table 6 shows the value of the criteria (alternative / ALT). Example: for alternative 1 value on the criterion of age-gender / C1 worth 5, temperature changes-climate change / C2 is worth 2, Topography overcrowding / C3 is 1, the old are the population density / C4 worth 4 and Sex-change climate / C5.Dari value above calculation process is carried out according to the stage TOPSIS method as follows:
Table 7. Matrix Of Normalized Decision
Alternative
Criteria
C1 C2 C3 C4 C5
A 1 5 2 1 4 1
A2 5 1 1 3 1
A 3 5 2 1 4 1
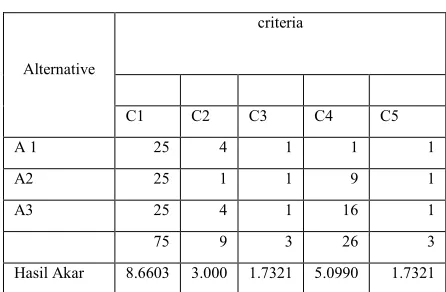
Create a normalized decision matrix. To create a matrix Here is the calculation: 1. Establish a decision matrix normalized using the formula (1)
[image:5.612.84.305.396.483.2]To create a normalized decision matrix, where the value in table 3.4 should be squared first, then calculated the root number for each - each row. For example the value of C1-value Alternative 1: (5) ² = 25 and then summed with the entire value of each alternative to C1 and the results are rooted: = 8.6603.
Table 8. Root Matrix Component Alternative To Criteria
Alternative
criteria
C1 C2 C3 C4 C5
A 1 25 4 1 1 1
A2 25 1 1 9 1
A3 25 4 1 16 1
75 9 3 26 3
Hasil Akar 8.6603 3.000 1.7321 5.0990 1.7321
Results roots in Table 8, is then used to divide the value of .9-value in the table. to produce a
normalized decision matrix.
Table 9. Matrix decision
Table.9. calculated using equation 1 where the value derived from the value of alternative KP1 1 (Table 3.4) = 5 divided by the roots to the first row = 8.6603
Ri=25/8.6603=0.05774………(3. 1)
Alternative
Criteria
C1 C2 C3 C4 C5
A 1 0.57735 0.66667 0.57735 0.78446 0.57735
A2 0.57735 0.33333 0.57735 0.58835 0.57735
[image:5.612.316.539.438.584.2]Tabel 10. Matrix Of Normalization Value Of Decision
Alternati ve
Criteria
C1 C2 C3 C4 c5
A1
0.0577
4 0.4
0.086602 5
0.117669 7
0.086602 54
A 2
0.0577
4 0.2
0.086602 5
0.088252 3
0.086602 54
A3
0.0577
4 0.4
0.086602 5
0.117669 7
0.086602 54
Creating a weighted normalized decision matrix. This matrix is obtained by multiplying the matrix has been normalized (Table.10.) With the weight of each - each criterion.
Table 11. Ideal Solution Positive And Negative Ideal Solution
C1 C2 C3 C4 C5
A+ 0.05774 0.40000 0.08660 0.11767 0.08660
A- 0.00000 0.00000 0.00000 0.00000 0.00000
Creating a weighted normalized decision matrix. This matrix is obtained by multiplying the matrix has been normalized by the weight of each - each criteria
Table 12. Weighted Normalized Reduced Decision Matrix A +
Alternative C1 C2 C3 C4 C5
A1 0 0.0000 0 0 0
A2 0 -0.2000 0 0 0
A3 0 0 0 0 0
Explanation of Table 12, using equation 2 where the value Obtained from multiplying the value in Table 3.6 C1 value alternative 1 = 0.00 with weighting criteria in
Table 12 = 5. 0,000 x 4 = 0000 ... (3.2) 3. Determine the ideal solution positive (A +) and negative ideal solution (A-) Meanwhile, to get the value of an alternative range of negative ideal solution, made the same way. Only values in Table. 11. (alt 1 (C1)) = 0.05774 to the value of the negative ideal solution that results expressed in Table 12 (min C1 = 0.05774 so 0.05774-0.05774.
Tabel.13. Ideal Distance Positive Alternative Solutions
POSITIF D1+ D2+ D3+ D4+ D5+ Total Result
A 1 0 0.00 0 0 0 0.00
A2 0 0.04 0 0.00086 0 0.041 0.202
A 3 0 0 0 0 0 0.000 0
Value Table 13 then calculated using the equation 5 where values are squared and summed for each row. The result of the summation was then diakarkuadrat to produce the ideal solution alternatives negative distance (D) stated in Table 14
Table 14. Distance Alternative Solutions Ideal Negative (D-)
Negative D1+ D2+ D3+ D4+ D5+ Result
A 1 0.003 0.16 0.0075 0.0138 0.1846 0.429743513
A2 0.003 0.04 0.0075 0.0077 0 0.058 0.242119381
A3 0.16 0.0075 0 0.1846 0.42974
From the results of the solution of the value of V (within proximity of each alternative against the ideal solution) then the value V_A3 has the greatest value, so the result is that Topography-population density is associated with the highest ranking, it indicates that the result of the determination decision recommending that the association of risk factors for dengue fever between topography and population density will be large given the risk of dengue epidemics are:
A3> A1> 0
CONCLUSION
Modeling Association Rule can identify the risk factors associated with each other that can heighten the potential for epidemic hemorrhagic fever.
The system developed for mapping the dengue fever epidemic that is based on the association of risk factors, can identify areas that have some association with the risk factors that could lead to an epidemic of Dengue Hemorrhagic
C1 C2 C3 C4 C5 Total Result
A1 0 0 0 0 0 1 0.81364
A2 0 0 0 0 0 0 0.65772
A
Fever.
Method of TOPSIS (Technique for Order Preference by Similarity to Ideal Solution), which can be used to do a comparison risk factors association of epidemic dengue fever. Based on predetermined criteria, so that the resulting information is in accordance with the weight and the desired criteria. Thus, the decision support system for the determination of epidemic dengue more efficiently and objectively.
REFERENCE
Kurniati, 2009, ”Kajian Hygiene Sanitasi Penyakit DBD di Kota Palembang Sumatera Selatan Tahun 2009”, http://www.tempo.co/
[2] Turban, E, Jaye Aronson, Peng – Liang Ting, 2005, “Decision Support Suystem And Intelegent System”, Yogyakarta, Andi.
[3] Behzadian. M,”A State of The-Art Survey of TOPSIS Application”,Vol.39,2012
[4] Dep.Kes Ri, (2002b), “Penyusunan Rencana Strategis Program Pemberantasan Sarang Nyamuk Demam Berdarah Dengeu Kabupaten Kota”, Jakarta, Dirjen P2M&PL.
[5] Ermatita and Destriatania, “Association Rule Method for Information System Epidemic Dengue Mapping Based Association of Risk Factors In Palembang”, Proceeding International Conferences on Information Technology and Business (ICITB(, 20th-21th) August 2015, ISSN 2460-7 223,pp: 65-70
[6] Gubler D.J, (1988), “The Arbovirosis epeidemiology and ecology” , US, Dept of Health and Human Services.
[7] Kusrini, 2007, “Konsep & Aplikasi Sistem Pendukung Keputusan”, Yogyakarta, Andi offset.
[8] Kusriastuti, Rita (2004) “Together Picket” ; “Community Activities In Dengeu Source Reduction In Purwokerto City, Central Java Indonesia”. Dengeu Bulletin, WHO, 7.
[9] M. Hasyimi. Wiku B,. Adisasmito, “Dampak Peran Serta Masyarakat dalam Pencegahan Demam Berdarah Dengue terhadap Kepadatan Vektor di Kecamatan Pulo Gadung Jakarta Timur. Cermin Dunia Kedokteran”, International Standard Serial Number: 0125 – 913X, 1997.
[10] Santoso, 2008, “Knowledge,Attitude and Practice Relationshipof The Community Towards Dengeu Hemorraghic Fever (DHF) in Palembang City South Sumatra Province”. Jurnal Ekologi Kesehatan, 7, 732-739.
[11] Kahraman, C, 2008, “ Multi-Criteria Decision Making Methods and Fuzzy Sets.
Fuzzy Multi-Criteria Decision Making”,
Theory and applications with recent