ENERGY AND DELAY REDUCTION ALGORITHM FOR
CLUSTER BASED CONGESTION CONTROL IN WIRELESS
SENSOR NETWORKS
1 C.J.RAMAN, 2 DR.VISUMATHI JAMES
1
Research scholar, Department of Computer Science and Engineering ,Sathyabama University, Department of Information Technology, St.Joseph’s College of Engineering, OMR, Chennai-119, Tamilnadu, India.
Email: [email protected]
2
Professor, Department of Computer Science and Engineering, Jeppiaar Engineering College, OMR,Chennai-119 Tamilnadu, India
Email: [email protected]
ABSTRACT
In Wireless Sensor Networks (WSN), delay has be reduced in delay sensitive applications at cost of increased energy consumption, since there is a tradeoff between delay and energy consumption in WSN. But most of works in WSN focus on reducing the energy rather than the delay. Hence the main aim of this work is to reduce both the delay and energy consumption in delay sensitive applications of WSN. In this paper, an efficient energy and delay reduction technique for cluster based congestion control model is proposed. In this technique, the cluster head (CH) is elected based on the energy level of the node. Each cluster member transmit the data and its remaining energy information to the corresponding cluster head as per the given time slot schedule. The delay in data transmission can be reduced by adaptively adjusting the active mode of the node based on the congestion status and distance of node. By simulation results, we show that the proposed technique reduces the energy consumption and delay of highly loaded sensor nodes.
Keywords: WSN, Energy, Congestion, Cluster, Delay Reduction
1. Introduction
A collection of small sensor nodes communicating among themselves is known as Wireless Sensor Network (WSN). WSN is organized in large scale from tens to thousands for various applications which includes monitoring of physical phenomena like temperature, humidity, air pollution and seismic events alarm detection, and target classification and detection [1]. It provides solutions potentially in low-cost for the issues of military and civilian applications which counting battlefield surveillance, environmental and health care monitoring, target tracking, wildfire detection, and traffic regulation [2]. Each sensor node in a WSN has a limited power and computation capability and WSN s strictly energy-constrained systems [3]
In WSN, the main aim of delay sensitive applications is to reduce the queuing delay by optimizing the queuing time and number of hops. But reducing delay would require sacrifices on
energy efficiency since there is a tradeoff between delay and energy consumption in WSN. But most of works in WSN focus on reducing the energy consumption alone thereby leaving the delay [4]. In most of the WSN sleep/wake protocols, energy awareness is considered as a key design issue to maximize the network lifetime at the cost of delay. [5].
In this paper, an efficient energy and delay reduction technique is proposed for the cluster based congestion control model in WSN. The main contribution of the work is energy efficient cluster head selection and adaptive adjustment of duty cycle by the cluster heads for reducing the delay.
2. Related Works
It considers three important factors: distance of the node from the sink, the node’s location and proximity from the event. Their scheduling scheme reduces end-to-end delay, minimizes the congestion at nodes and improves the throughput. Though this scheme reduces the delay, the energy consumption increases due to the multi hop transmission.
Liqi Shi et al [6] have created a nonlinear cross-layer optimization model for reducing the average energy consumption. They have proposed an algorithm for generating the TDMA schedules and provided optimized TDMA schedules with reduced delay. The algorithm utilizes the slot reuse concept to achieve minimum TDMA frame length. But it does reduce the delay involved in the sleep/wakeup scheduling.
Trong Thua Huynh et al [7] have performed a comparative study on balancing energy efficiency and delay in WSN. Their presentation includes analysis of the current state-of-the-art of routing techniques for optimizing energy-efficiency along with latency factor.
Ali Chodari Khosrowshahi1 et al [8] have enhanced the multi-channel medium access (MCSMAC) protocol. MCSMAC is a contention based MAC protocol based on the S-MAC protocol. The primary purpose of the enhanced MCSMAC protocol was to reduce the energy consumption and the delay during data transmission. In the enhanced MCSMAC protocol, the bandwidths of channels are dynamic as opposed to the standard MCSMAC protocol. But the delay due to the sleep scheduling is not resolved.
E. Srie Vidhya Janani and P. Ganesh Kumar [9] have proposed an Energy Efficient Cluster Based Scheduling Scheme for WSN that balances the network lifetime and energy efficiency. In the first phase of this scheme, the network is clustered by means of topology discovery and the cluster heads are selected based on the residual energy. In the second phase, scheduling algorithm is proposed to allocate the time slots for the cluster members. In the third phase, an energy consumption model is proposed to maintain the maximum energy level in the network. But since the sleep wakeup interval is not updated based on the traffic load, the delay will be increased.
From the above review of literature, it can be observed that there is a need for techniques which aim to provide energy efficient data transmission along with adaptive duty cycle periods in WSN.
3. Energy and Delay Reduction Algorithm
3.1 Overview
In this paper, we propose an efficient energy and delay reduction technique for the cluster based congestion control model in WSN. In this technique, the cluster head (CH) is elected based on the energy level of the node. Each cluster member transmits the data and its remaining energy information to the corresponding cluster head as per the given time slot schedule. The delay in data transmission can be reduced by adaptively adjusting the active mode of the node based on the congestion status and distance of node.
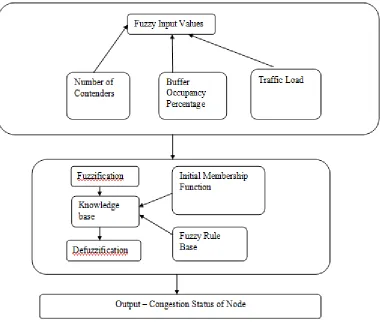
3.2 Fuzzy Based Congestion Detection
We detect the congestion status of the node using fuzzy logic technique. The parameters number of contenders, buffer occupancy percentage of parent nodes and traffic load are taken as input for the fuzzy member ship functions. These inputs are fuzzified and processed by interference system to provide congestion status of the node as output which is then de-fuzzified. The outputs are aggregated and form new fuzzy sets.
The steps that determine the fuzzy rule based interference are as follows.
• Fuzzification: This involves obtaining the crisp inputs from the selected input variables and estimating the degree to which the inputs belong to each of the suitable fuzzy set.
o Number of Contenders: It is estimated using the RTS or CTS packets which are generated by the neighbor nodes. If there are too many contenders, collision probability is higher.
o Buffer Occupancy Percentage: If the buffer occupancy percentage of the node is high, the congestion probability will also be high.
• Rule Evaluation: The fuzzified inputs are taken and applied to the antecedents of the fuzzy rules. It is then applied to the consequent membership function.
• Aggregation of the rule outputs: This involves merging of the output of all rules.
• Defuzzification: The merged output of the aggregate output fuzzy set is the input for the defuzzification process and a single crisp number is obtained as output.
[image:3.612.136.516.282.604.2]The fuzzy inference system is illustrated using Figure-3.
Fuzzification
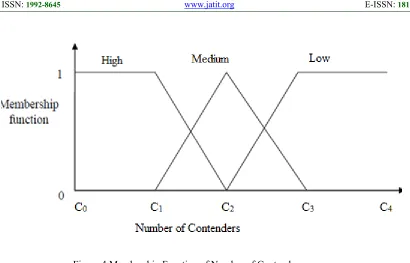
This involves fuzzification of input variables such as number of contenders (C), buffer occupancy percentage (B), and traffic load (T) and these inputs are given a degree to appropriate fuzzy sets. The crisp inputs are combination of C, B and T. We take the possibilities, high, medium and low for C, B and T.
Figure 4 Membership Function of Number of Contenders
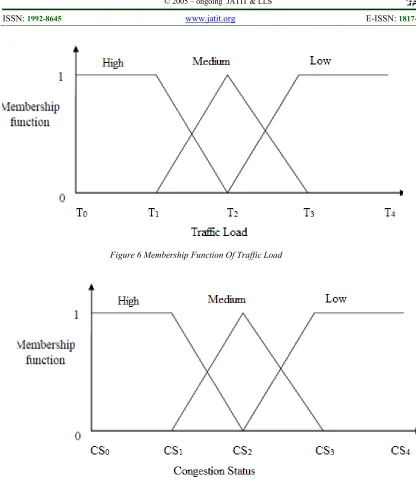
[image:4.612.125.529.369.560.2]Figure 6 Membership Function Of Traffic Load
Figure 7 Membership Function Of Congestion Status
[image:5.612.134.509.636.728.2]In table C, B and T are given as inputs and the output represents the Congestion Status (CS). The fuzzy sets are defined with the combinations presented in Table-1.
Table-1 Fuzzy Rule Base
S.No C B T CS
1 Low Low Low Low
S.No C B T CS
3 Low Low High Medium
4 Low Medium Low Low
5 Low Medium Medium Medium
6 Low Medium High Medium
7 Low High Low Low
8 Low High Medium Medium
9 Low High High Medium
10 Medium Low Medium Medium
11 Medium Low High Medium
12 Medium Medium Low Low
13 Medium Medium Medium Medium
14 Medium Medium High Medium
15 Medium High Low Medium
16 Medium High Medium Medium
17 Medium High High Medium
18 Medium Low Low Low
19 High Low Medium Medium
20 High Low High Medium
21 High Medium Low Medium
22 High Medium Medium High
23 High Medium High High
24 High High Low High
25 High High Medium High
26 High High High High
Table-1 demonstrates the designed fuzzy inference system. This illustrates the function of the inference engine and method by which the outputs of each rule are combined to generate the fuzzy decision.
For example
Let us consider Rule 26.
If (C, B, T = high)
Then
CS = high
End if
This reveals that the selected node is subject to congestion.
Defuzzification
Defuzzification is used for extracting a crisp value from a fuzzy set as a representation value. We consider the centroid of area strategy for defuzzification. df agg f fdf agg QoS
F
F
F
)
(
)
(
η
η
∫
=
(1)Where
η
agg(
F
)
= aggregated output ofmembership function
3.3 Distance from Sink to Node
The distance (dij)among the sender node (Ni) and
receiver node (Nj) can be estimated based on free
space propagation model. It considers the wavelength utilized for transmission and reception.
The Free-space propagation model is defined using the following equation
Prx = Ptx*
α
β
π
η
*
*
4
2
ijd
(2)where Prx = reception power
Ptx = transmission power
η
= wavelengthα
= transmitter gain
β
= receiver gain3.4 Estimating Scheduling Interval of the Cluster Member
The waiting time of the sensor node required for data transmission is computed based on its active or sleep mode.
The time for which the node remains active is estimated using the following Eq (3):
Tac = max min
R
t
(3)
tmin = minimum time for the sensor node to reach
the coverage area
Rmax = maximum sensing range of the node
The time for which the node remains in sleep mode is estimated using the following Eq(4):
Tsl = min
exp min maxt
R
t
(4)where tmax = maximum time for the sensor node to
reach the coverage area
Rmin = minimum sensing range of the node
The waiting time for the sensor node is estimated using the modes of the node (active or sleep)
Tw =
+
−
otherwise
Q
E
E
Q
R
E
LT
z
a
t i a i i a i,
)
(
,
)
,
(
3 2 1λ
(5)where a1, a2 and a3 = constants
Et = threshold energy level
λ
= random number between [0, Tac])
,
(
E
iR
iLT
= lifetime of the cluster group in terms of current energy and sensing range.3.5 Cluster Formation and Data Transmission
Let CMi and CHi be the cluster member and cluster
head respectively.
Cluster Head Election
The steps involved in selecting the cluster head are as follows:
1. Each sensor node randomly generates a energy probability (EP(t)) and computes the threshold value (Th(w)) using the following equation: Th(z) =
∈
−
Otherwise
N
w
E
E
EP
q
EP
EP
res t t t,
0
,
max
.
))
/
1
mod(
.
(
1
(6)where N = set of clusters Eres = residual energy
Emax = maximum energy of the node
EPt = energy probability
q = current round number
2. If E<EPt, then the relevant node is
selected as CH.
3. CHi transmits the Emax of all its CMi to its
another CHi before the expiry of last
round of transmission.
4. Each CHi collects all Emax value and
identifies the maximum value
5. The identified Emax is broadcasted to its CMi.
6. CMi then stores the Emax for future
computation of Th(w).
Data Transmission
If the cluster member wants to transmit the data to its destined node, it performs the following process:
1. The selected CH broadcasts the data packets to neighboring CMi.
2. CMi gathers the data during t and
transmits the ‘RREQ’ message to nearest CHi.
3. CHi upon receiving the RREQ constructs
the route table (RT) and time slot (TS)
based on the Time division multiple access (TDMA) schedule interval.
The time slot refers to the time taken by the CMi to transmit their data and energy
details to the relevant CHi
Table -1 Routing Table So urc e Clu ster ID Desti natio n Clust er ID Sche dulin g Statu s Net wor k Life time Tot al En erg y Le vel Seq uenc e Nu mbe r
4. CHi then broadcasts the generated
timeslots to the neighboring CMi.
5. CMi upon receiving the timeslot updates
its route table to perform data transmission.
6. Following CHi selection, each CMi
transmit the data and its residual energy to its relevant CH as per TS schedule.
7. CHi maintains the residual energy details
of each CMi.
3.6 Adjusting the Active Mode of the Node
In order to reduce the delay, the active mode (AM) is adaptively updated based on the congestion status (estimated in section 3.2) and distance from sink of each node (estimated in section 3.3.) (ie)
AM
∝
D
CS
(7)
AM is directly proportional to the congestion status and inversely proportional to the distance of the node the sink.
That is, the nodes near to the sink node have greater traffic load when compared to the nodes away from the sink node and are assigned longer active time intervals.
4. Simulation Results 4.1 Simulation Parameters
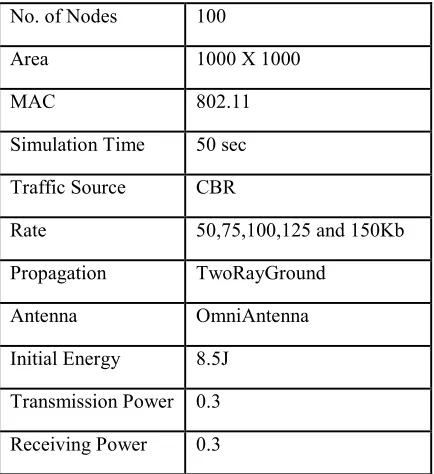
We use NS2 to simulate our proposed Energy and Delay Reduction Algorithm for Cluster based Congestion Control (EDRA) protocol. We use the IEEE 802.11 for wireless sensor networks as the MAC layer protocol. It has the functionality to notify the network layer about link breakage. In our simulation, the number of transmission rate is varied as 50, 75,100,125 and 150 Kb. The area size is 1000 meter x 1000 meter square region for 50 seconds simulation time. The simulated traffic is Constant Bit Rate (CBR).
Our simulation settings and parameters are summarized in table 2
Table 2:
Simulation parameters
No. of Nodes 100
Area 1000 X 1000
MAC 802.11
Simulation Time 50 sec
Traffic Source CBR
Rate 50,75,100,125 and 150Kb
Propagation TwoRayGround
Antenna OmniAntenna
Initial Energy 8.5J
Transmission Power 0.3
Receiving Power 0.3
4.2 Performance Metrics
We evaluate performance of the new protocol mainly according to the following parameters. We
compare the Sleep Wakeup Scheduling SSS [5] scheme with our proposed EDRA protocol. In addition to the main metrics delay and energy consumption, the packet drop and packet delivery ratio metrics are also considered for evaluation, in order to measure the reliability of delivered data.
4.3 Results & Analysis
[image:9.612.85.302.392.629.2]Rate Vs Delay
0 2 4 6 8 10 12
50 75 10 0 12 5 150
R at e( Kb )
[image:10.612.90.514.65.235.2]EDRA SSS
Fig 8: Rate Vs Delay
Figure 8 shows the delay measured for EDRA and SSS when the rate is varied. When the rate is increased from 50Kb to 150Kb, as we can see from the figure, the delay of EDRA increases
from 7.29 to 9.60 and the delay of SSS increases from 8.08 to 9.99. Due to the adaptive adjustment of active duty cycle, the delay of EDRA is 7% less, when compared to SSS.
Rate Vs DeliveryRatio
0 0.05 0.1 0.15 0.2 0.25 0.3
50 75 10 0 125 150
R at e( Kb )
[image:10.612.202.485.320.456.2]EDRA SSS
Fig 9: Rate Vs Delivery Ratio
Figure 9 shows the delivery ratio measured for EDRA and SSS when the rate is varied. When the rate is increased from 50Kb to 150Kb, there will be more congestion. As we can see from the
figure, the delivery ratio of EDRA decreases from 0.26 to 0.15 and the delivery ratio of SSS decreases from 0.20 to 0.15. Since EDRA resolves the congestion, the delivery ratio of EDRA is 29% of higher than SSS.
Rate Vs Drop
0 50 00 100 00 150 00 200 00 250 00 300 00 350 00
50 75 100 125 150
R at e( Kb )
[image:10.612.202.485.544.674.2]EDRA SSS
Fig 10: Rate Vs Drop
Figure 10 shows the packet drop measured for EDRA and SSS when the rate is varied. When the rate is increased from 50Kb to 150Kb, there
20159 and the packet drop of SSS increases from 11515 to 29866. However, since EDRA resolves the congestion, the packet drop of EDRA is 44% of less when compared to SSS.
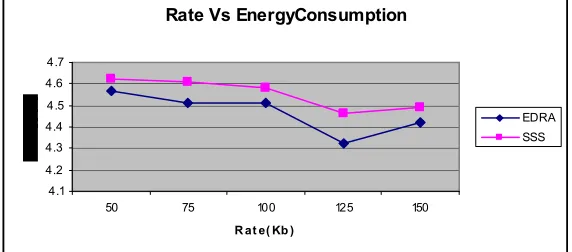
Rate Vs EnergyConsumption
4.1 4.2 4.3 4.4 4 .5 4.6 4 .7
50 75 100 125 150
R at e( Kb )
[image:11.612.200.486.158.284.2]EDRA SSS
Fig 11: Rate Vs Energy Consumption
Figure 11 shows the energy consumption measured for EDRA and SSS when the rate is varied. When the rate is increased from 50Kb to 150Kb, as we can see from the figure, the energy consumption of EDRA decreases from 4.56 to 4.42 and the energy consumption of SSS increases from 4.62 to 4.49. Since EDRA uses energy efficient cluster heads, the energy consumption of EDRA is 2% lesser than SSS.
5. CONCLUSION
In this paper, an efficient energy and delay reduction algorithm (EDRA) has been proposed for cluster based WSN. In this technique, the cluster head (CH) is elected based on the energy level of the node. Each cluster member transmits the data and its remaining energy information to the corresponding cluster head as per the given time slot schedule. The delay in data transmission can be reduced by adaptively adjusting the active mode of the node based on the congestion status and distance of node. Due to the energy efficient CH election, the proposed technique reduces the average energy consumption by 2%. Due to the adaptive adjustment of active duty cycle, the delay was reduced by 8%. Thus the proposed EDRA achieves both the objectives of the research work. The future work concretes on providing more reliability to the cluster heads and reducing their overhead.
REFERENCES:
[1].Seong Cheol Kim, Jun Heon Jeon and Joong Jae Kim, "Energy and Delay Efficient Duty-Cycle MAC Protocol for Multi-hop Wireless Sensor Networks", International Journal of Multimedia and Ubiquitous Engineering, Vol. 10, No. 2, pp. 361-370,2015.
[2].Guido Di Baccoy, Tommaso Melodiaz and Francesca Cuomoy, "A MAC Protocol for Delay-Bounded Applications in Wireless Sensor Networks",In: Proc. Med- Hoc-Net. pp. 208-220.,2004.
[3].Chilukuri Shanti and Anirudha Sahoo, "DGRAM: A Delay Guaranteed Routing and MAC Protocol forWireless Sensor Networks",IEEE ,2008.
[4].Arjan Durresi, Vamsi Paruchuri and Leonard Barolli, "Delay-Energy Aware Routing Protocol for Sensor and Actor Networks",In Proceedings of the 11th International Conference on Parallel and Distributed Systems (ICPADS'05),2005.
[5].Babar Nazir1, Halabi Hasbullah and Sajjad A Madani, "Sleep/wake scheduling scheme for minimizing end-to-end delay in multi-hop wireless sensor networks",EURASIP Journal on Wireless Communications and Networking, 2011.
[7].Trong Thua Huynh, Anh-Vu Dinh-Duc and Cong Hung Tran, "Balancing latency and energy efficiency in wireless sensor networks: A Comparative Study", IEEE,2013.
[8].Ali Chodari Khosrowshahi, Bahman Arasteh, Saeid Taghavi Afshord and Behnam Arasteh, "A New Strategy for Optimizing Energy and Delay in MCSMAC Protocol",Indian Journal of Science and Technology, Vol 7(11), 1756– 1764, November 2014.