M E T H O D
Open Access
McEnhancer: predicting gene expression
via semi-supervised assignment of enhancers
to target genes
Dina Hafez
1,2, Aslihan Karabacak
2†, Sabrina Krueger
2†, Yih-Chii Hwang
4, Li-San Wang
4, Robert P. Zinzen
2*and Uwe Ohler
1,2,3*Abstract
Transcriptional enhancers regulate spatio-temporal gene expression. While genomic assays can identify putative enhancers en masse, assigning target genes is a complex challenge. We devised a machine learning approach, McEnhancer, which links target genes to putative enhancers via a semi-supervised learning algorithm that predicts gene expression patterns based on enriched sequence features. Predicted expression patterns were 73–98% accurate, predicted assignments showed strong Hi-C interaction enrichment, enhancer-associated histone modifications were evident, and known functional motifs were recovered. Our model provides a general framework to link globally identified enhancers to targets and contributes to deciphering the regulatory genome.
Keywords: Interpolated Markov model, Enhancer to target gene assignment, Gene expression,Drosophila melanogaster, Gene regulation, Machine learning, Semi-supervised model
Background
In complex metazoan genomes, the space dedicated to encoding gene expression typically exceeds the space to encode the actual genes. Identifying and interpreting these “non-coding” regulatory regions is a crucial step towards understanding gene regulation. Transcriptional regulatory regions encompass gene-proximal promoter regions as well as gene-distal regions such asenhancers andinsulators, which can regulate target genes across long distances [1–3].
For many years, enhancers were primarily identified by functional dissection and reporter assays. Recent meth-ods to identify enhancer candidates on a genomic scale are mostly based on chromatin features. Assays such as DNase-seq or ATAC-seq have been used to map open chromatin regions across hundreds of human cell lines or diverse model systems [4–6]. Complemented by histone modification mapping, such methods were
*Correspondence: [email protected]; [email protected] †Equal contributors
1Department of Computer Science, Duke University, 27708 Durham, NC, USA 2Berlin Institute for Medical Systems Biology, Max Delbrück Center for Molecular Medicine, 13125 Berlin, Germany
Full list of author information is available at the end of the article
used as a strong indicator for active enhancers; see, for example, [7–9].
Enhancer sequences contain short DNA motifs that work as binding sites for sequence-specific transcrip-tion factors (TFs), and the combinatranscrip-tion of recruited (co-) activators and repressors determines the activity of the enhancer [10]. Under the assumption that genes with correlated expression patterns tend to be regulated by similar TFs, co-expressed genes are more likely to be controlled by enhancers that contain a similar set of transcription factor binding sites (TFBSs) [3]. Regula-tory regions are referred to as cis-regulatory modules (CRMs); they involve the dynamic interplay between sev-eral TFs as well as nucleosome and chromatin organizing proteins within a defined genomic interval. In human, various TFBSs were shown to be conserved among co-expressed genes in promoter regions [11]. Moreover, enhancers that direct similar expression share common TFBSs. The use of regulatory sequence features in putative enhancers showed promising results in predicting cell-type-specific gene expression [8, 12]. In previous work, we assigned human cell-type-specific DNaseI hypersen-sitive (DHS) regions to their closest gene, and scores for TFBSs in the associated DHSs were used as features
necessarily regulate the closest gene; they can act across intervening genes to reach their targets; and they can exist in the introns of their target genes or even those of nearby genes. Furthermore, genes are often regulated by more than one enhancer. Theeven-skippedgene ofDrosophilais one of the classic examples, where at least nine enhancers control expression in a spatially and temporally distinct fashion, but enhancers that independently direct largely similar expression patterns have also been described
for detailed assignments at the needed kilobase resolution [19]. (2) Instead, several approaches assigned enhancers to target genes based on the correlation of gene expres-sion and histone modifications in enhancers and putative target promoters. In one example, enhancer states were identified based on combinatorial patterns of chromatin marks using a multivariate hidden Markov model (HMM), and enriched TF motifs in these enhancers were matched against gene expression profiles [20]. This model was used
[image:2.595.57.537.356.654.2]to identify potential long-range interaction between pairs of predicted enhancers and genes across multiple cell lines in human [21]. PreSTIGE (Predicting Specific Tissue Interactions of Genes and Enhancers) is another approach that associates H3K4me1 ChIP-seq with RNA-seq expres-sion levels for genes that are specifically expressed in different cell types [22]. However, all of these models depend on enhancer-associated chromatin marks, which require high-resolution data at multiple conditions (e.g., time points and cell types). (3) Alternatively, expression quantitative trait loci (eQTLs) have also been used to link enhancers to target genes, via correlating sequence varia-tion to changes in gene expression levels [23]. An integra-tive random forest model to predict genes associated with human eQTLs was introduced by [24]. However, given the intrinsic challenges that usually come with eQTL analysis, such as the large number of tests needed to identify asso-ciations between gene expression and single-nucleotide polymorphism, such an approach has limited practicality for genome-wide implementation. (4) Finally, models on specific expression patterns, for which relevant TFs and genes are well known, have been utilized to link specific sets of enhancers to their target genes. For Drosophila [25], a Bayesian approach used the occupancy profile of different TFs, spatio-temporal activity for CRMs, and their genomic distances, along with occupancy peaks for six insulator binding proteins and H3K4me3 profiles at promoters. This model suggested that an enhancer could regulate multiple genes and that enhancers that are 50 kb away from a gene transcription start site (TSS) could still have influence on that gene. Recently, a linear model integrating TF motif score, expression domain, and chro-matin accessibility data across developmental stages has been shown to predict enhancer activities [26]. Again, prior knowledge of TFs and their DNA binding motifs is required.
In this paper, we utilize a different premise to develop a predictive model linking enhancers to target genes, assuming that similar spatio-temporal expression observed in target genes is causally connected to shared sequence features (e.g., TFBSs) present in their enhancers. We focus our efforts on fly embryonic enhancers: The fly genome is compact, such that enhancers are frequently close to multiple genes (e.g., within a few kilobases), and one can therefore not assume that the closest promoter is always the correct one [27, 28]. Furthermore, while intri-cate expression patterns have been extensively mapped, chromatin data is not available at matching spatio-temporal resolution that would allow for the application of chromatin-state-correlation approaches. Classifying gene expression patterns based on our assigned enhancers dramatically improves upon baseline approaches. We demonstrate the success of our strategy by agree-ment with Hi-C data, interpret informative sequence
features, and validate a subset of candidates with reporter constructs.
Approach Problem definition
Previous approaches that assign enhancers to target genes largely rely on correlation between gene expression and chromatin state: They look for cases in which changes in enhancer histone modifications correlate with changes in transcription and/or promoter histone modifications, e.g., over a set of conditions (such as cell lines) for which both expression and chromatin states have been deter-mined. While intricate spatio-temporal gene expression patterns have been measured in whole intact organisms such as fly embryos, plant roots, or mouse brains, they do not come with epigenetic information at the same match-ing resolution. This constitutes a bottleneck that limits our ability to interpret and decode functional regulatory regions.
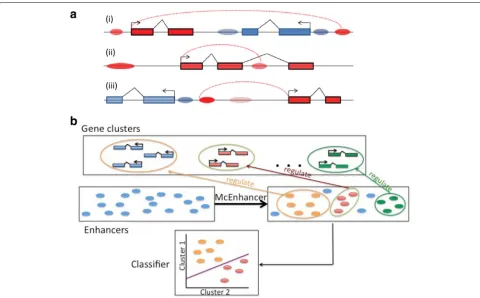
However, existing approaches do not utilize a critical feature of gene regulation, namely that co-regulated genes can be assumed to be targeted by the same (subset of ) regulatory factors, and that this is reflected in the co-occurrence of sequence features in the regions to which they bind [3]. We are therefore proposing to fill this gap via predictive sequence models. Starting from a set of genes with highly similar expression patterns, and a candi-date list of enhancers in their genomic neighborhood, the task is to infer a yes/no label for each enhancer indicat-ing its involvement in regulatindicat-ing the genes (Fig. 1b). We can then demonstrate the validity of these assignments via the improved ability to predict the expression pattern from the sequences of the selected enhancers. This strat-egy can be thought of as higher-level motif finding. In the traditional motif finding problem, one is asked to deter-mine the locations of a common motif that is shared in a set of regulatory regions. Here, there is similarly a hidden variable indicating whether an enhancer regulates a spe-cific target gene, but in place of a motif model, we learn a model for the set of selected enhancers.
Choice of biological model system and data
In this study, we specify a solution of this general idea for the model system of the fruit fly.Drosophila melanogaster has a compact genome, and an immense volume of data has been accumulated about fly biology generally and gene regulation specifically.Drosophilashares many sim-ilar regulatory features and pathways with humans on the molecular level, but its short life cycle and the avail-able genetic and transgenic tools allow us to experimen-tally validate specific candidates. These aspects make Drosophilaa powerful model organism for testing predic-tive models of gene expression regulation.
data as well as the vocabulary, ranging from 3 to 365 unique genes per cluster [30]. Out of these clusters, 29 clusters define restricted expression patterns; the remaining 10 broad clusters are grouped together and referred to as ubiquitously expressed genes. 2. Genome-wide data on putative enhancers active
duringDrosophilaembryogenesis.A curated set of all possible enhancers duringDrosophila melanogaster embryogenesis is not available, but active enhancers are known to be depleted of nucleosomes so as to make the DNA accessible and “open.” To identify accessible DNA regions in the genome, DNaseI digestion and high-throughput sequencing (DNase-seq) are usually used to mark the locations of open chromatin along the genome [4, 31, 32]. DHSs have proven to be well correlated with diverse classes ofcis-regulatory regions, including
promoters, enhancers, insulators, and other sites of regulatory factor occupancy [33–35]. It was also shown that active regulatory regions interacting with gene promoters are usually enriched for DHSs [36]. By considering the joint set of high-resolution in vivo DNase-seq assays profiled at different stages of embryogenesis [37], DHSs could be used to map the locations of regulatory regions, decreasing the search space (to 6.4% of the genome) and increasing the probability of predicting regulatory regions that are functional. Note that in our approach, chromatin data is solely used to define a superset of putative enhancers; it does not represent condition-specific activity information to link enhancers to targets. 3. Initialization of enhancer models.While motif
finding in general does not require prior knowledge to initialize models, available resources on gene regulation inDrosophila allow us to make use of information on validated enhancers and the expression patterns they confer. The most detailed, manually curated available resource for
experimentally verified fly CRMs, along with their associated genes, is the Regulatory Element Database forDrosophila (REDfly) [38]. An additional, more recent set of known enhancer-gene pairs has been
patterns. Overlapping these known CRMs from REDfly or the VT library with open chromatin regions allows us to assign a small subset of DHSs in the expression clusters to their target genes, enabling us to address the problem in a semi-supervised framework.
The McEnhancer model
In principle, one can define a complete system for enhancer-gene assignment by including assignments as hidden variables in a probabilistic sequence-based model of gene expression. Sampling over putative assign-ments of enhancers to genes, for all expression pat-terns simultaneously, should allow for computing pos-terior probabilities of assignments leading to optimal classification.
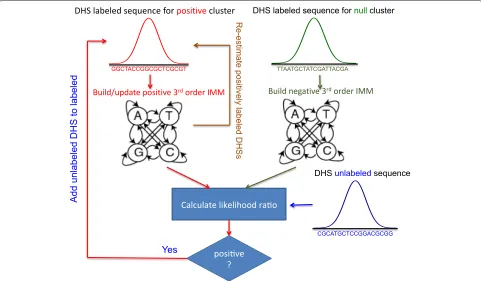
To investigate the practical feasibility and performance of such a strategy, we here propose a simpler approach dubbed McEnhancer, which also allows us to utilize the available information on enhancer-gene assignments. As a central part of our approach, McEnhancer learns rele-vant common subsequences from an initial set of known (labeled) DHS-gene pairs, then predicts assignments for other unlabeled DHSs with similar subsequences for one expression pattern at a time. This is implemented using a third-order interpolated Markov chain model (IMM) in a semi-supervised learning setup via the expectation maxi-mization (EM) algorithm. Due to the very limited number of known DHS-gene pairs to initialize the models, IMMs should be suitable to avoid overfitting. Figure 2 presents a schematic overview of the model.
Fig. 2Schematic representation of McEnhancer. Starting with known DHS-gene pairs assigned to a given cluster, it builds a third-order IMM to represent sequence features in DHSs for the positive cluster(colored red). It builds another IMM to represent the null model. In iterative rounds, the model loops on all unlabeled DHSs, calculates log likelihood ratio, and assigns a class label to each unlabeled DHS accordingly. After it finishes looping on all unlabeled DHSs, it adds the newly assigned positive DHSs to the positive cluster and re-estimates IMM parameters. Log likelihood ratios for positively labeled DHSs are re-calculated and re-added to the unlabeled set if their likelihood is low. The model iterates until it converges
Results
Mapping enhancer candidates from DNase-seq data
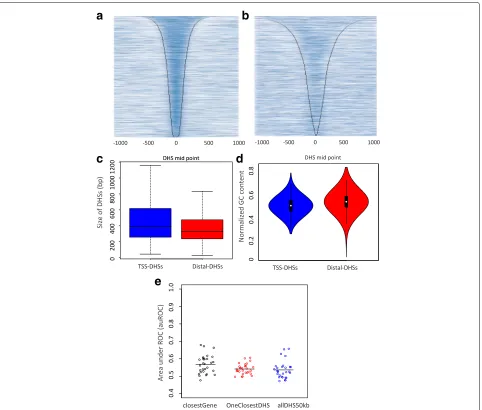
Accessibility to DNA modifying enzymes such as MNase and DNase is a generally accepted hallmark of active regu-latory regions [13, 36, 40]. DHSs were previously collected fromDrosophila melanogasterembryos at time intervals centering on stages 5, 9, 10, 11, and 14, respectively [37]. The collection of DHSs across all stages was shown to cover 6.4% of the euchromatic genome (7.6 Mb), with an average of 3.5% at any given stage. Overlapping the published DHSs with previously annotated CRMs from REDfly showed an overlap of 4077 DHSs. This over-lap decreased to 2375 DHSs when overover-lapping published DHSs with CRMs from the VT library. Due to the low signal-to-noise ratio of the processed published DNase peaks (Fig. 3b), we decided to re-map the raw data and call peaks using JAMM [41]. The overlap of the newly called DHSs was 4111 and 2784 DHSs when intersecting with REDfly or the VT library, respectively. The heatmap in Fig. 3a shows the improvement of JAMM-identified DHS peaks against the original mapped data for stage 14 of Fig. 3b (see Methods). These DHSs exhibit marginal differences according to their genomic regions: DHSs overlapping TSSs are a bit larger (median size∼400 bp),
while distal DHSs are smaller (median size ∼330 bp (Fig. 3c). Distal DHSs show marginally higher GC content than TSS-DHSs (Fig. 3d).
Assigning enhancers to their closest genes leads to relatively poor results
In the absence of complementary data, the most com-mon technique to assign enhancers to their target genes is by linking them to the nearest TSS. As a baseline, Distal DHSs were assigned to their closest genes. Then, a sparse logistic regression classifier was used to test the accu-racy of this assignment (Fig. 3e, black dots). Each of the dots represents the area under receiver operating curve (AuROC) for classification of one gene cluster (from the 29 clusters with restricted expression) against ubiquitous genes (10 broad clusters grouped together as the negative set). The average AuROC of∼0.57 for this assignment is close to random. This is markedly worse than previously indicated in human [13], where the larger intergenic space may allow for more meaningful assignments based on distance.
[image:5.595.58.539.87.368.2]c
e
d
Fig. 3Mapping enhancer candidates from DNase-seq data and baseline classifications.aJAMM-identified peaks for DHSs in stage 14, versus (b) originally processed DHSs in stage 14. Heatmaps are centered on DHS midpoint, ranked by peak width and show extended read count intensity.
cSize of all DHSs that overlap TSSs and those overlapping other regions along the genome.dNormalized GC content per each group of DHSs.e
Area under receiver operating characteristic curve(AuROC)for classification of various simple baseline methods for distal DHS-gene assignment
for this assignment that is again almost random ∼54% (Fig. 3e, red dots). Finally, when all distal DHSs in the region +/- 50 kb around each gene are associated with a corresponding gene, the classification AuROC against ubiquitous genes is∼53% (Fig. 3e, blue dots). This implies that all of these baseline enhancer-gene assignment meth-ods are not effective. A smarter model that can link DHSs to their target genes is needed for an understanding of gene regulation specificity.
McEnhancer links enhancers to their target genes
Rather than assigning a fixed subset or all candidates in a region, we would ideally infer whether any given DHS
[image:6.595.59.541.85.495.2]Known DHS-gene pairs were used for model initializa-tion (numbers shown in Addiinitializa-tional file 1: Figure S2); then McEnhancer was run, until convergence, in a pairwise manner on every possible combination, comparing one cluster against each of the other clusters. The predicted DHSs for each cluster from all of its pairwise runs were tallied up, and those above a certain threshold were con-sidered to regulate the corresponding expression pattern. A detailed description of the model is supplied in Addi-tional file 2, and the final predictions for each cluster are given in Additional file 3.
In order to allow McEnhancer to learn the best sequences specific for each gene cluster, we ran McEn-hancer in two phases. Phase I targets genes with unique expression patterns (assigned to exactly one cluster). In this phase, DHSs overlapping REDfly CRMs and VTs were used for initialization. In the next step, phase II of the model uses predicted distal DHSs from phase I to predict matching enhancers regulating non-unique genes (i.e. genes assigned to multiple expression classes).
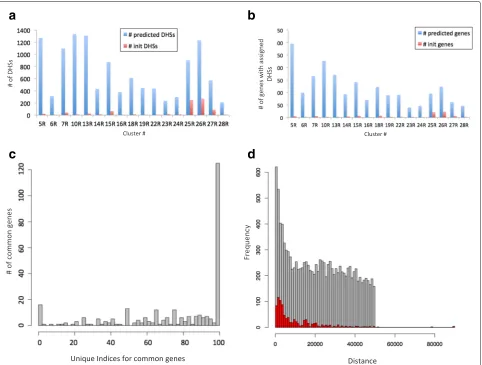
Figure 4a shows the number of unique distal DHSs that were used in initialization, as well as the total number of unique distal DHSs that were predicted for each expres-sion cluster. Figure 4b shows the number of genes with associated distal DHSs before and after learning for each of the two groups. The difference between the small num-ber of genes with known assigned distal DHSs in the initial start set compared to hundreds of genes with predicted distal DHSs after running McEnhancer is quite remark-able. In total, McEnhancer predicted 9180 unique distal DHSs regulating 1621 unique genes. On average, each patterned gene is thus regulated by 5–6 different distal DHSs. Importantly, only 23% of predicted distal DHSs were assigned to their closest genes, with the rest being assigned to more distal ones.
The results so far were based on an initialization in which we combined two datasets of enhancer-gene pairs, namely REDfly and VT libraries. To assess the robust-ness of enhancer selection and validate the accuracy of the selected DHSs, we now initialized with one of the two datasets only (REDfly), leaving the other one (VT) for an independent validation of McEnhancer across all clusters (see Methods). In this setting, McEnhancer, after phase I, correctly predicted an average of ∼90% of the enhancers from the VT set that were assigned to each cluster (Additional file 1: Figure S4-A). Overall, this quantifies the robustness of McEnhancer to recover known enhancer-gene assignments on genomic datasets. This also allowed us to rule out a possible bias for distal interactions. Additional file 1: Figure S4-B shows the distribution of enhancer-gene distances in the VT set, and in the recovered subset when initializing on REDfly only.
Distances between enhancers and their associated genes span large ranges
We next investigated the distances between predicted dis-tal DHSs and their corresponding genes (Fig. 4d). There is a preference for distal DHSs to regulate genes within closer distances, represented through the high peak at shorter distances. However, it flattens out with increas-ing distance and becomes uniform across the search space window, +/–50 kb, around the genes’ promoters. A previ-ous model presented by [25] showed that enhancers that are 50 kb away from genes’ promoters were predicted to influence their associated genes.
Setting a hard limit of a 50kb window around genes promoters may therefore have been a tight constraint. However, if multiple genes exist in the +/–50-kb region that belong to the same gene cluster, all of these genes will be assigned to the same enhancer with the same prob-ability. Additional file 1: Figure S3 shows that the total number of such genes falling within 100 kb of each other is approximately 11% per cluster. (The few distal DHSs with distances larger than 50 kb result from the initial labeling.) Increasing this window would also increase the number of genes belonging to the same cluster that fall within the same window. In compact genomes, this conundrum can effectively only be solved by using data for direct interactions.
Genes with multiple expression patterns are regulated by distinct sets of enhancers
Apart from the distance, we examined whether genes belonging to multiple expression clusters would be predicted to be regulated by different enhancers. We calculated a uniqueness index (UI) for each gene belong-ing to multiple expression clusters (see Methods). Fre-quencies of differential DHS usage are shown (Fig. 4c). It is interesting to see that almost half of the genes that belong to more than one expression cluster are regulated by completely different sets of DHSs (marked by the long bar at 100%). This indicates that genes belonging to mul-tiple expression patterns are predicted to be regulated by different modularly acting enhancers.
Temporal patterns of predicted DHSs match gene expression time points of assigned clusters
c
d
Fig. 4McEnhancer results.aNumber of unique distal DHSs used in initialization and after prediction.bNumber of unique genes used in initialization and after prediction.cDifferential DHS usage among genes belonging to more than one expression cluster. For each of the common genes, the unique index(UI)is computed measuring the percentage of uniquely predicted DHSs. A histogram of UIs for all common genes is displayed.dA histogram showing the frequencies of distances between predicted DHSs and their corresponding genes.Gray barsdisplay distances between predicted distal DHSs and their corresponding genes, whilered barsrepresent distances for distal DHSs that were still kept in the final predictions of those used in initialization
development (around stage 5), which is in concordance with increased accessibility of active enhancers driving the activity of these genes. Similarly, clusters with nervous system expression, such as clusters 13R, 14R, and 15R, have high accessibility z-scores for later (stages 11 and 14). This complies with expression of their genes, where they are mainly expressed in stages 11, 12 and 13–16.
Active enhancer-associated histone marks are enriched at predicted enhancers
To validate that McEnhancer selects functional enhancers, we first analyzed the chromatin structure in the vicin-ity of the selected regions for hallmarks of enhancer activity. Ideally, the data on chromatin structure (e.g., histone modifications) were to match the cell type in which the enhancers are active. We therefore utilized
mesoderm-specific histone modification ChIP-seq data for two enhancer-related histone marks, H3K4me1 and H3K27ac [8], and visualized peak coverage on selected DHSs for clusters 18R and 19R (genes expressed in differ-entiated somatic muscle and differdiffer-entiated visceral mus-cle; see Methods).
[image:8.595.58.540.86.451.2]Fig. 5Stage enrichments in predicted DHSs. Predicted DHSs are enriched for developmental stages corresponding to expression patterns of genes in corresponding clusters
data; see Fig. 6b. This underscores the predictive power of McEnhancer and supports the argument that H3K4me1 is elevated at active enhancers compared to non-active ones [42]. Furthermore, Additional file 1: Figure S5-A highlights the fact that enrichment of these histone marks is not simply correlated with DHS accessibility. Together, these observations support our prediction that these enhancers are indeed regulatory sequences active in mesoderm-specific tissues.
Identified Hi-C fragment-promoter interactions validate the DHS-gene predictions
In addition to histone modification enrichments that support the condition-specific enhancer function, direct evidence for enhancer-promoter interactions may be extracted from chromatin conformation data such as Hi-C. Given its relatively low resolution and experi-mental bias, Hi-C data needs to be processed by tai-lored analysis pipelines aimed at validating enhancer-gene assignments. Therefore, previously published genome-wide Hi-C raw data from Drosophila embryonic nuclei [43] was processed with the High-throughput Identifica-tion Pipeline for Promoter Interacting Enhancer elements (HIPPIE), which specifically calls significant Hi-C inter-actions between promoters and distal locations [44]. In
this way, on average,∼40% of DHS-gene pair predictions are confirmed by exact fragment-promoter assignment (Fig. 6c). To assess the significance of this overlap, we derived a null distribution from random permutations of the data, while correcting for the enhancer-gene distance skewness (Additional file 1: Figure S5-B; see Methods).
McEnhancer learns specific regulatory sequences for each expression pattern
[image:9.595.56.542.88.360.2]c
Fig. 6McEnhancer predictions are validated through enrichment of histone marks and overlap with Hi-C data. Enrichment of histone modification marks:aH3K27ac andbH3K4me1 for clusters with predicted mesodermal expression (red), compared to DHSs near these mesodermal genes but were not selected by McEnhancer (green), DHSs selected by McEnahncer but with no mesodermal activity (blue), and DHSs that were not slected to regulated any of the clusters (purple).cValidation of predicted DHS-gene pairs by overlapping with identified fragment-promoter Hi-C interactions. For each gene cluster, number of DHS-gene pairs which overlap with Hi-C fragments and for which these fragments were linked to the same genes was counted (blue bars). Percentages represented by this overlap with respect to filtered predicted DHS-gene pairs are shown by the orange line. Random refers to null expectation derived from data shuffling, see Methods
a
b
[image:10.595.59.539.85.410.2] [image:10.595.63.540.522.685.2]features for each gene’s expression pattern, and quanti-fies how much better the prediction of gene expression patterns is, across all genes and all enhancers selected, compared to the baseline models above.
Regulatory sequence information in proximal promoter DHSs sharpens the specificity of expression pattern prediction
McEnhancer is only concerned with distal DHSs; pro-moter DHSs are assumed to regulate their closest genes. To examine the effect of regulatory features in pro-moter regions in dictating the specific expression pat-tern of the cluster, DHSs overlapping gene TSSs in each expression cluster were classified against those overlap-ping TSSs of ubiquitous genes. Classification resulted in an average AuROC ∼68% (Fig. 7b, black dots). Adding promoter DHSs to distal DHSs, each as a sep-arate feature vector, resulted in a high AuROC ∼97% (Fig. 7b, red dots). This implies that information retained in promoter regions is not enough to encode specific expression patterns; however, promoters together with the McEnhancer-assigned distal enhancers allow for an almost perfect distinction between different expression patterns.
Functional validation of predicted enhancer activities for identified DHSs
To assess whether our strategy to identify enhancers by chromatin accessibility and to assign them to target genes holds true in vivo, we aimed to test several putative enhancers in developing embryos. However, because we assign DHSs to putative target genes via concordance of their k-mer content with that of verified enhancers linked to target genes of known expression classes, a first indica-tion of the quality of predicted enhancer-target linkages is k-mer content itself — do the DHSs assigned to the spe-cific expression classes contain sequence motifs for TFs likely to regulate the respective expression patterns?
DHS classes are enriched for sequence motifs for TFs known to regulate the linked expression patterns
We analyzed DHSs assigned to each expression pattern for statistical enrichment of sequence motifs (5-mers) and assigned them to TFs based on reported binding pref-erences using the Analysis of Motif Enrichment (AME) algorithm [45]. AME computes the statistical enrichment of known motifs in a set of sequences versus other con-trol sequences based on threshold-free linear regression (see Methods). TF assignment is often ambiguous because TFs can bind to a range of sequences, TF complexes (e.g., dimerization partners) may alter sequence prefer-ence, and several TFs may be assigned to the same motif. Furthermore, as we use sparse classifiers, they will only use a subset of possibly informative k-mers, and
well-known factors may be absent. Despite these caveats, we could assign many TFs that explain much of the expression behavior of the respective clusters (Addi-tional file 1: Figure S6, summarized in Addi(Addi-tional file 4).
For example, cluster 18R genes are expressed primar-ily in the somatic mesoderm (SM), and associated DHSs were enriched in motifs assigned to the Myocyte Enhanc-ing Factor 2 (Mef2), which plays a key role in SM dif-ferentiation (see, e.g., [12]). Similarly, another enriched motif maps to sine oculis (so), which is a homeodomain TF related to Six4. so is unlikely to play a role in SM development, but Six4 has a very similar binding motif [46], is expressed in the mesoderm at the appropri-ate stage, and has been shown to be a key patterning agent of the ventral mesoderm, from which the SM derives [47].
Cluster 19R genes are primarily expressed in the vis-ceral mesoderm (VM). The enriched motifs include 5-mers matching the TF tramtrack (ttk), which has recently been found to play an important role in cell fate speci-fication in the developing mesoderm and especially the VM [48], as well as motifs matching nautilus, which is involved in myogenesis. Interestingly, a motif for the well-known repressor snail [49, 50] is also enriched in 19R. Snail is expressed in the presumptive mesoderm early, but exclusively in neurogenic tissues starting at stage 10. This implies a temporal mechanism to achieve tissue-specific expression — Snail may keep genes off first in the presumptive mesoderm and later in the neu-rogenic tissues, while allowing their expression in the VM. Similarly, the Zn-finger TF abrupt is a putative new negative VM regulator; abrupt is not expressed in the mesoderm but may serve to repress VM genes in other tissues. Another enriched motif corresponds to ETS binding motifs. ETS transcriptional activators like pnt require ERK signaling, which is activated in the VM [51] — it is feasible that ETS sites act like a bimodal switch, where ETS TFBSs allow enhancer activ-ity in the VM via activated Pnt, but deny activactiv-ity of the same enhancers via the ubiquitous ETS repressor Aop elsewhere.
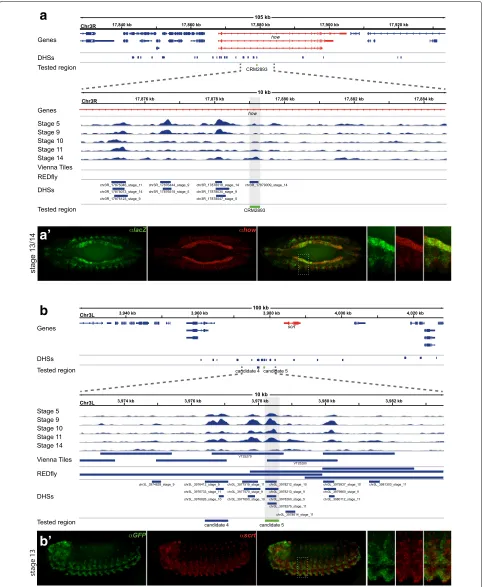
• The transgenic line CRM2893 was reported as a visceral mesoderm (VM) and somatic mesoderm (SM) enhancer at developmental stages 12–16. Temporal DHS accessibility matches reported enhancer activity (Fig. 8a), and the DHS was predicted to target the genehow. Importantly, we find near-perfect overlap betweenhow and CRM2893-directed reporter gene expression in the VM and pharyngeal muscle (Fig. 8a’), as well as significant overlap in the SM (not shown). We conclude that this DHS constitutes a developmental enhancer and was correctly mapped to its target gene. • The DHS covering a second mesodermal enhancer,
CRM6053, also appears to be a functional and correctly assigned enhancer and drives much of the expression pattern of its target genenoc from stages 8–11 (Additional file 1: Figure S7-A).
• A third DHS matching CRM5481 is accessible at stages 11–14 (Additional file 1: Figure S7-B) and was predicted to targettkv and Bsg25D. The DHS directs expression in the dorsal mesoderm (stage 11/12), SM (stage 13), and anterior VM patches (stage 15) (Additional file 1: Figure S7-B).tkv expression nicely co-localizes with reporter gene expression in all three mesodermal tissues (Additional file 1: Figure S7-B), whereasBsg25D is co-expressed only in the SM [52]. Why these two genes may be targeted
tissue-specifically by the enhancer DHS is unclear, but note that while the DHS is intronic totkv, it needs to act over 25 kb to target theBsg25D promoter. Nonetheless, it seems that this DHS enhancer has been correctly mapped to both target genes. • The fourth mesodermal enhancer DHS, CRM3775,
drives expression in the mesoderm primordium at stage 5 and in the SM at later stages, which is in agreement with accessibility data (Additional file 1: Figure S7-C). One of the two predicted target genes, CG2162, does not significantly overlap with reporter expression, but targetCG32486 shows expression very similar to that of the reporter gene in areas surrounding hindgut and foregut invagination at stage
regulatory information contained within the DHS serves to activate transcription of the reporter gene in the transgenic context but to mediate repression in the endogenous context, possibly due to CRM truncation.
Additionally, we investigated several enhancer predic-tions linked to the neurogenic expression cluster. Two of these candidates (4 and 5) are located within 1 kb of each other and may be part of the same larger reg-ulatory region. While candidate 4 directs no detectable reporter gene expression on its own (not shown), can-didate 5 directs expression in the ventral nervous sys-tem primordium (Fig. 8b). The overlap of reporter gene activity with expression of the predicted target gene scrt indicates correct target assignment for candidate 5 (Fig. 8b).
Candidate 1 was predicted to target soxN at a dis-tance of more than 20 kb, but showed no detectable regulatory activity. Candidate 3 is primarily accessible at stage 5, which is when it directs ventral expres-sion in a stripe-modulated pattern and ectodermal patches later. The predicted target genes are nuf and Dichaete, but while no reporter overlap withnuf expres-sion was detected, some limited expresexpres-sion overlap was observed for Dichaete anteriorly at stage 5, as well as in the ectodermal patches later (Additional file 1: Figure S7-E).
a
a’
b
b’
[image:13.595.58.541.86.673.2]gene associations with respect to some challenging enhancer-target assignments, specifically cases where the experimentally determined target gene is not the clos-est gene. The REDfly database [38] contains 62 such instances, of which 26 uniquely overlap with our DHSs, 14 assigned to genes with unique expression pattern, and 12 assigned to genes with multiple expression pat-terns; the latter 12 cases were not used in initialization (see Additional file 2) and thus constitute an independent test set. Out of those, the McEnhancer-target predictions directly agree in 9 cases (75%). Upon taking a closer look at the reported enhancer activity compared to that of the McEnhancer assigned gene, we determined that the accu-racy of assignment is possibly as high as 11 or 12/12 (92–100%). Two of the three questionable cases seem to be in fact correctly assigned by McEnhancer (see Additional file 5): in one case, the CRM’s activity clearly overlaps with the expression of the assigned gene, in the other it appears that not only do enhancer activity and target gene expression match, but the target gene assigned by McEn-hancer is indicated by the original publication [53] as a likely target and was simply incompletely annotated in the REDfly database. The final case is inconclusive: the enhancer activity of another DHS (accessible at>stage 9) likely matches the reported weak expression of the pre-dicted target gene(CG3838)in the ventral nerve cord [52]; although no images of the CRM’s activity are available, its activity is described as “st. 9-16 lateral epidermis (weak), CNS (weak)” [54]. Note that in the 26 cases (Additional file 5), the simple closest-gene assignment would have failed.
Discussion
We have approached the general problem of predict-ing gene expression from sequence, by linkpredict-ing enhancers to putative target genes by means of identifying a sub-set of enhancers with similar sequence composition/k-mer counts around co-regulated genes. With 62,453 DHSs, rich in putative enhancers, 13,659 protein-coding genes, and only a few known DHS-gene pairs, predict-ing enhancer-gene pairpredict-ing globally becomes a complex machine learning and data analysis challenge. DHSs were
machine learning model was built to predict linkage between DHSs and their associated target genes. For a given gene cluster, McEnhancer first builds a third-order interpolated Markov model on small starting sets of known target gene assigned regulatory regions doc-umented in REDfly and the VT library. Through appli-cation of the EM algorithm within a pairwise semi-supervised learning framework, it then scores each of the unlabeled DHSs in a +/– 50kb window around genes in the cluster. Labeled and unlabeled sets are updated accord-ingly, and the whole model parameters are re-estimated based on the newly updated sets. In this work, using inter-polated Markov chains is crucial to avoid overfitting. The algorithm iterates until convergence, and DHSs predicted to harbor regulatory information associated with specific expression clusters are identified.
Predicting gene expression from enhancer candidates has previously worked to a certain degree even when assuming that enhancers regulate their closest target [13, 39]. We could show that the prediction of expression patterns increased dramatically after selection of a subset of enhancer candidates via McEnhancer. The high perfor-mance of logistic regression classification between pre-dicted DHSs for each specific cluster against other clus-ters, as well as against ubiquitous enhancers, supported the notion that we selected a subset of enhancers relevant for the expression of the target genes. This observation was also corroborated by the match between developmen-tal stages of selected DHSs and expression time points of their associated genes. While our approach provides a two-step solution to first select enhancers and then build classifiers, it is conceivable to phrase the problem within an integrated probabilistic model that explicitly treats the enhancer-gene assignments as missing/hidden variables.
closest gene regulated by an enhancer was not part of the pre-defined expression clusters, or where an enhancer regulates its closest target gene, but in a different expres-sion context not considered here. However, other recent studies have also reported that enhancers regulate sur-prisingly few of their closest genes. For example, a study analyzing 5C data in human showed that only 27% of distal elements have an interaction with their nearest TSSs [27]. Similar results were also obtained from another study ana-lyzing ChIP-seq data in mouse [28]. Reconstruction of gene regulatory networks suggests that sometimes more distal regulatory elements control gene expression over those that are positioned closer to the gene [24]. Thus, when predicting enhancer-gene interactions, choosing the nearest gene may be globally informative, but insufficient and misleading in specific cases. Furthermore, as with all approaches that do not use evidence of direct inter-action data, we cannot resolve cases in which multi-ple co-expressed genes are located in the same genomic neighborhood (here, several genes from the same cluster within a +/– 50kb region). Using topologically associat-ing domains (TADs) instead of fixed-sized windows may resolve some of such cases, and it is in fact a matter of current debate whether co-expressed genes within a TAD are generally differentially or jointly regulated by shared enhancers.
The presence of enhancer-related histone modifications in the vicinity of enhancers is generally used to validate predicted enhancers. Enrichment of H3K27ac in pre-dicted enhancers revealed active regulatory function in bothDrosophila and human embryonic cells [7, 20, 55]. The existence of H3K4me1 marks at predicted enhancers adds an extra layer of validation, as H3K4me1 has been described as a chromatin mark associated with enhancers irrespective of activity [56].
Analyzing genome-wide Hi-C Drosophila embryonic data [43] using HIPPIE [44] showed a considerable overlap of identified fragment-promoter interactions with pre-dicted DHS-gene pairs. Here, the available read depth and the compactness of the fly genome allowed for a mean-ingful analysis at single gene loci, which is not yet feasible for most if not all available mammalian datasets; yet, it is important to note that due to read coverage bias and the current resolution of Hi-C data, the lack of interaction between two fragments in Hi-C data analysis does not rule out the existence of the interaction.
Investigating the k-mer sequences that contributed most to the expression pattern classifiers provided deeper insights into specific gene regulation. k-mers to which non-zero weights were assigned by the sparse logistic regression were mapped to TF binding preferences to identify candidate regulators. Examples of meaningful matches derived in this way included motifs known to be able to recruit crucial regulators directing expression
in and shaping the developmental trajectories of the respective expression domains.
Such analyses are necessarily incomplete and require careful interpretation as discussed, but are nevertheless useful in highlighting enriched motifs that offer potential TF candidates for regulating a specific system for further validation. Finally, we were able to test and verify the regu-latory activities of several identified DHSs. Of nine tested DHSs, seven were found to act as enhancers and were able to direct reporter gene expression in vivo. Of these, six exhibited partial overlap with the expression of pre-dicted target genes; the seventh was driving expression in a pattern curiously complementary to that of all three pre-dicted target genes. In some cases, the DHS captured the regulatory activity explaining a target gene’s developmen-tal expression pattern almost entirely. This indicates that not only are we able to predict enhancers based on DHSs, but that McEnhancer is also able to assign target genes, and even multiple target genes for a single enhancer, with considerable accuracy, which will further improve with more accurate expression classification, both temporally and spatially.
Conclusions
This study provides a new approach to the problem of assigning enhancers to the genes they regulate. Via semi-supervised machine learning, we can start from a handful of positive samples and add further unclassified samples around co-expressed genes, which look most similar in terms of their sequence composition. We also posited that successfully predicting specific expression patterns from the assigned enhancers is a highly effective approach in evaluating the success of enhancer-gene assignments. In summary, this approach provides a framework for mak-ing sense of large in vivo regulatory datasets that do not completely align with one another and do not have cell-type-specific resolution. It is an example of how machine learning provides an effective means to provide deep insights into the biology of gene regulation, and pro-vides a starting point for improved computational and experimental strategies.
Methods
DNaseI data processing and peak calling
Assembling known DHS-gene pairs (labeled data)
The gold standard for testing enhancers and their asso-ciated genes is through designed reporter assays. In these experiments, a candidate DNA sequence is placed upstream of a minimal promoter and a reporter gene. The activity of the enhancer is then measured by the abun-dance and localization of the reporter transcript, or the reporter gene is detected by enzymatic activities, fluo-rescence, or specific antibodies [10]. These experiments are very low throughput; they are designed to test exactly one specific enhancer against one gene. The broadest and most comprehensive available resource for curated exper-imentally verified fly CRMs along with their associated genes is the Regulatory Element Database forDrosophila (REDfly) [38].
Distal DHSs were overlapped with known CRMs from REDfly (v3.0) and split into expression clusters accord-ing to their associated genes. The number of known DHS-gene pairs overlapping REDfly CRMs per each gene expression cluster is shown in Additional file 1: Figure S2 (red bars). It is clear that the number of known DHS-gene pairs is fairly small in most gene expression clusters, with some clusters having not even a single known pair.
Another set of known enhancer-gene pairs is in vivo val-idated through a high throughput enhancer trapping in situ protocol using transgenic fly lines VT and systemat-ically assigned to their targets [39]. In the VT fly library, each line contains a transcriptional reporter construct with a∼2 kb candidate enhancer, minimal promoter, and GAL4 reporter gene integrated into an identical position in the fly genome. In situ images for each transgenic line were acquired, and the enhancer activity patterns were manually annotated using a controlled vocabu-lary. Out of 7705 tested candidate enhancers, 46% were active, with most of them showing specific spatial patterns during development. To associate a target gene for each of these enhancers, the expression patterns of the five upstream and downstream neighboring genes were man-ually inspected and compared to that of the enhancer in consideration. A gene was assigned to a given enhancer if the gene expression pattern matched that of the enhancer. This manual enhancer-gene pattern association analysis
file 1: Figure S2 (green bars). Since the number of known DHS-gene pairs per each cluster was still small, a combi-nation of known pairs from REDfly and VT was collec-tively considered. Some of these pairs are exactly the same, while others are different, Additional file 1: Figure S2 (purple bars). Using both sets provided us with suffi-cient known DHS-gene pairs that were used for model initialization. Gene expression clusters with no known DHS-gene pairs or with 3 pairs are discarded from the analysis. A total of 17 clusters were then used for prediction.
Calculating distances between enhancers and their associated genes
Distances are measured between gene TSSs and centers of distal DHSs. If a gene has more than one transcript, the shortest distance is used. Gray bars in Fig. 4d display distances between predicted distal DHSs and their cor-responding genes, while red bars represent distances for distal DHSs that were still kept in the final predictions out of those used in initialization.
Calculating uniqueness index for common genes
To further investigate if genes belonging to multiple expression clusters are regulated by different enhancers, we calculated a uniqueness index (UI). First, genes used by McEnhancer which belonged to more than one cluster were marked, and 303 genes were referred to as common genes. Then the symmetric difference of the clusters for which a given gene belongs to was calculated for each of these common genes, and referred to as UI. A UI is defined as the percentage of uniquely selected DHSs out of all predicted DHSs for a given gene. Using set theory, UI for a common genexthat belongs to two clustersAand Bis defined as:
UIx= (
DHSA−DHSB)∪(DHSB−DHSA)
DHSA∪DHSB
(1)
Enhancer-associated histone marks
modification (H3K4me1 and H3K27ac) and histone H3 density ChIP-seq data were obtained from [58]. Raw data was mapped to Drosophila melanogaster genome build dm3 using Bowtie2 with default parameters. Only reads that aligned uniquely to a single location were retained. PCR duplicates were removed using Picard (http:// broadinstitute.github.io/picard). Peaks for the two modi-fications were called with JAMM [41], setting parameters -e auto, -d y and -r region, using histone H3 density as control data.
Enrichments of the JAMM signal for each of the two histone marks, specifically H3K4me1 and H3K27ac, were compared across four different groups of DHSs. The first group is composed of DHSs that were pre-dicted by McEnhancer to regulate genes with meso-dermal expression pattern (clusters 18R and 19R). The second group consists of DHSs that are near meso-dermal genes, but were not selected by McEnhancer. The third group represents other predicted DHSs that were selected for other clusters, other than muscle-related ones. And finally the last group included all other DHSs that were not selected to regulate any of the clusters.
To perform this analysis, a normalized read coverage for each merged BAM file, with no duplicate reads, was obtained for each of the three histone marks. Reads were grouped in 10-bp bins along the genome with extended fragment length. Fragment length was computed as the average of the three fragment lengths after mapping each of the different time points separately. Then, for each group of DHSs, the number of reads that overlapped the corresponding regions were summarized, and the mean score for each bin (10 bp) in the interval of +/–2 kb around the center of the DHS was used to indicate the enrich-ment score. A local version of deepTools was used in this analysis [59].
Nucleosomes in the vicinity of active enhancers typically contain histone characteristics with post-translational modifications. Figure 6a shows enrichment of the H3K27ac chromatin mark at the four defined sets of DHSs. Predicted enhancers show high levels of H3K27ac, even when compared against those DHSs that were not selected. This indicates that predicted enhancers are indeed active regulatory sequences, since H3K27ac is a critical mark that separates active from poised enhancers [55]. Predicted enhancers also show high lev-els of H3K4me1, see Fig. 6b, which marks the location of enhancers.
Initialization with one exclusive dataset
To computationally validate the selection of DHSs for each cluster, McEnhancer was initialized with DHSs from REDfly only and then tested regarding how many DHSs from VT were correctly assigned. Clusters with less than
4 DHSs for initialization were excluded from this anal-ysis. In addition, two other clusters did not have any assigned DHSs from VT and were also excluded. This left us with 11 clusters to validate. McEnhancer was run in pairwise settings, comparing a given cluster with the other 10 clusters, for stage 1 of the algorithm where only genes that are uniquely assigned to a single clus-ter were considered. DHSs selected more than five times for a given cluster across all 10 pairwise comparisons were considered to predict the expression pattern of that cluster. Percentages of overlapping matches were calcu-lated based on the full initial set of DHSs that were assigned to each cluster by VT, as well as the sub-set kept by McEnhancer when training on both REDfly and VT.
Enhancer-promoter interactions from embryonic Hi-C data
Currently, the most comprehensive pipeline that tack-les many of the shortcomings of Hi-C biases is HIPPIE [44, 60]. In this pipeline, raw data is first mapped to the genome without the use of Hi-C pairing informa-tion. Because the resolution of Hi-C is constrained by the length distribution of the fragments produced by the cho-sen restriction enzyme, the reads are aggregated to each restriction fragment that represents potential DNA-DNA interacting sites (average length 413.0 bp). The extended restriction fragments with Hi-C reads are then filtered to include pairs with at least 2 reads supporting the inter-actions, for which one of the interacting pairs is a pro-moter (200 bp upstream from the TSS) and for which the non-promoter-interaction fragment overlaps with DNase-seq and known enhancer marks H3K4me1 and H3K27ac.
Given the high data biases associated with Hi-C assay, such as its relatively low resolution and experimental bias [61], this data could still be used with a tailored analysis pipeline to validate enhancer-gene predictions. There-fore, genome-wide Hi-C raw data applied toDrosophila embryonic nuclei, generated by [43], was downloaded and HIPPIE pipeline was applied.
blue bars in Fig. 6c. On average,∼40% of DHS-gene pairs predictions are confirmed by Hi-C data, as shown by the blue line in Fig. 6c. The BEDtools package Genom-icRanges was used to find the overlap between BED coordinates [62].
To assess the significance of calculated overlap, ran-dom DHS-gene pairs were generated. For each gene in the analysis, six random DHSs, from DHSs within +/– 50 kb around the gene TSS, were selected. The choice of six came from analyzing model prediction output where each gene is, on average, linked to six different DHSs. In addition, given that the predicted enhancer-gene pairs have skewed distribution towards shorter interactions, shown in Fig. 4d, random DHS-gene pairs were sam-pled with controlled distance distributions, mimicking that of the predicted pairs. The same steps for calcu-lating the overlap between predicted DHS-gene pairs and identified Hi-C fragment-gene pairs were applied on the random permuted data. This permutation was run 1000 times and the average overlap with Hi-C pairs was 15%, shown as the last blue bar in Fig. 6c. This implies the significance of predictions for every gene cluster (p-value<0.0001).
Similar procedures were then repeated, but consid-ering only Hi-C fragment-gene pairs with significant P values (p-value 0.1). The average percentage overlap was ∼22%, with an average random overlap close to 4% (Additional file 1: Figure S5B).
TF enrichment analysis in predicted regulatory regions
For further validation of predicted DHSs, we tested whether known motifs are enriched in the enhancer set selected for each cluster. We calculated enrichment scores for known position weight matrix (PWM) motifs in predicted DHSs for one cluster against DHSs pre-dicted to regulate all other clusters, using AME [45]. We combined two highly curated motif datasets and used them as a database from which the AME algo-rithm selected enriched motifs. The first set represented binding specificities of 242 Drosophila TFs generated by applying the HT-SELEX protocol [46]. The other set included motifs from the OnTheFly database. Since
matches against a set of databases. This resulted in dif-ferent sets of known motifs, each representing DHSs predicted for specific clusters. Identified PWMs were analyzed and shown to match expression patterns of their associated clusters (the full table is shown in Additional file 4).
Transgenic reporter assays
confocal scanning system; wide field images were software deconvolved.
Primers for amplification of set 2:
• candidate 1
– DHS chr2L_8851915_stage_9 ; location = [668bp=2L:8851915-8852583] cloned: chr2L:8851854-8852589
– Fwd = #544 :
nnngaattcCCAATCAAAATAAATGGCTAC – Rev = #545 :
nnnngaattcGCGATGTCAAAGGTCTTAAC
• candidate 2
– DHS chr3L_14146268_stage_9 ; location = [238bp=3L:14146268-14146506] cloned chr3L:14146267-14146516
– Fwd = #546 :
nnnngaattcTGTCTAACTGTGCATCCCTG – Rev = #547 :
nnnngaattcACAATCCCGGATACAAAAGG
Note that candidate 2 has not been tested, because it failed to be identified as a candidate after the prediction model was refined
• candidate 3
– DHS chr3L_14146763_stage_5 ; location = [398bp=3L:14146763-14147161] cloned: chr3L:14146754-14147167
– Fwd = #548 :
nnnngaattcGCTAATCGTTCGCCTTCTCG – Rev = #549 :
nnnngaattcCCTTGCAGGTCAGATGTCC
• candidate 4
– DHS chr3L_3976412_stage_9 ; location = [691bp=3L:3976412-3977103] cloned chr3L:3976411-3977103
– Fwd = #550 :
nnnngaattcCTACGTGGATGAGCTCC – Rev = #551 :
nnnngaattcAGCTAAGAGGAT-GTCATGAAC
• candidate 5
– DHS chr3L_3978213_stage_9 ; location = [392bp=3L:3978213-3978605] cloned chr3L:3978207-3978615
– Fwd = #552 :
nnnngaattcGAGTGCATCGCTTTTACC – Rev = #553 :
nnnngaattcCGAATCGTGTGTTGAGATAG
Additional files
Additional file 1:Supplementary figures. (PDF 9185 kb)
Additional file 2:Materials and methods supplement. This text explains McEnhancer in more details; phase I and II of McEnhancer, model selection parameters and cross validation. (PDF 236 kb)
Additional file 3:McEnhancer predicted DHSs for each cluster. This table shows the predicted DHSs for each cluster, along with its associated gene. Columns represent DHS coordinates (chr, start, end), DHS ID linked to its associated gene, and number of times each DHS was selected in the model’s pairwise comparisons against other clusters. (TXT 778 kb)
Additional file 4:TF motifs enriched in predicted DHSs. This table shows enriched PWMs in predicted DHSs for each cluster using the AME motif enrichment algorithm. (XLSX 28 kb)
Additional file 5:Table showing McEnhancer validation of long-range interactions reported in REDfly. This table shows all long-range interactions reported in REDfly that overlap our DHSs, selecting only those that were assigned to genes in included in our analysis, but these genes are not the closest. Columns of this table are: CRMs coordinates from Redfly, their assigned genes, whether such gene is has unique or multiple expression pattern, closest genes, coordinated of McEnhancer predicted DHSs that overlap each CRM, and whether McEnhancer prediction is correct, and a comment in case the assigned genes are different. (XLSX 59 kb)
Abbreviations
AuROC: Area under receiver operating characteristic curve; CRM: Cis-regulatory module; DHS: DNaseI hypersensitive site; EM: Expectation-maximization; HMM: Hidden Markov model; IMM: Interpolated Markov chain model; REDfly: Regulatory Element Database for Drosophila; TF: Transcription factor; TFBS: Transcription factor binding site; TSS: Transcription Start Site; VT: Vienna Tiles
Acknowledgements
We are grateful to Mahmoud M. Ibrahim for help with data analysis and Scott A. Lacadie for helpful comments and discussions. We would like to thank Eileen Furlong (EMBL, Heidelberg) for providing us with the set 1 mesodermal CRM lines, and Vladimir Benes (EMBL, Heidelberg) for providing ESTs for target genes, and the MDC’s microscopy facility for confocal access.
Funding
DH, AK, and UO were in part funded by the Human Frontier Science Program (HFSP RGY0093/2012). DH and UO acknowledge support from the Simons Foundation, which funded participation in the 2016 Algorithmic Challenges in Genomics Program at the Simons Institute for the Theory of Computing at UC Berkeley. YH and LW were funded by the National Institute of General Medical Sciences [R01-GM099962] and the National Institute on Aging [U24-AG041689 and P30-AG010124].
Availability of data and materials
McEnhancer software is available in the GitHub repository at https://github. com/dinahafez/McEnhancer.git. It is distributed under the open-source MIT License. The version of the software evaluated in this manuscript is archived at doi:10.5281/zenodo.883961. All results, DHS coordinates, gene sets, and code for running McEnhancer are available at https://ohlerlab.mdc-berlin.de/ software.
Authors’ contributions
UO conceived the study and sketched out the algorithm. DH refined, implemented, and validated McEnhancer and analyzed the data. RZ and UO planned the in vivo experimental validation. AK and SK carried out the in vivo experimental validation. YH and LW analyzedDrosophilaHi-C data and identified significant Hi-C interactions. RZ and DH analyzed the enhancer sequences and model parameters for transcription factor motifs. DH wrote the manuscript together with UO and RZ. All authors read and approved the final manuscript.
Ethics approval and consent to participate
Received: 19 May 2017 Accepted: 8 September 2017
References
1. Calhoun VC, Levine M. Long-range enhancer–promoter interactions in the Scr-Antp interval of the Drosophila Antennapedia complex. Proc Natl Acad Sci. 2003;100(17):9878–83.
2. Nobrega MA, Ovcharenko I, Afzal V, Rubin EM. Scanning human gene deserts for long-range enhancers. Science. 2003;302(5644):413–3. 3. Markstein M, Zinzen R, Markstein P, Yee KP, Erives A, Stathopoulos A,
Levine M. A regulatory code for neurogenic gene expression in the Drosophila embryo. Development. 2004;131(10):2387–94.
4. Boyle AP, Davis S, Shulha HP, Meltzer P, Margulies EH, Weng Z, Furey TS, Crawford GE. High-resolution mapping and characterization of open chromatin across the genome. Cell. 2008;132(2):311–22.
5. Thurman RE, Rynes E, Humbert R, Vierstra J, Maurano MT, Haugen E, Sheffield NC, Stergachis AB, Wang H, Vernot B, et al. The accessible chromatin landscape of the human genome. Nature. 2012;489(7414): 75–82.
6. Buenrostro JD, Giresi PG, Zaba LC, Chang HY, Greenleaf WJ. Transposition of native chromatin for fast and sensitive epigenomic profiling of open chromatin, DNA-binding proteins and nucleosome position. Nat Methods. 2013;10(12):1213–8.
7. Rada-Iglesias A, Bajpai R, Swigut T, Brugmann SA, Flynn RA, Wysocka J. A unique chromatin signature uncovers early developmental enhancers in humans. Nature. 2011;470(7333):279–83.
8. Bonn S, Zinzen RP, Girardot C, Gustafson EH, Perez-Gonzalez A, Delhomme N, Ghavi-Helm Y, Wilczy ´nski B, Riddell A, Furlong EE. Tissue-specific analysis of chromatin state identifies temporal signatures of enhancer activity during embryonic development. Nat Genet. 2012;44(2):148–56.
9. Ernst J, Kellis M. ChromHMM: automating chromatin-state discovery and characterization. Nat Methods. 2012;9(3):215–6.
10. Shlyueva D, Stampfel G, Stark A. Transcriptional enhancers: from properties to genome-wide predictions. Nat Rev Genet. 2014;15(4): 272–86.
11. Hatanaka Y, Nagasaki M, Yamaguchi R, Obayashi T, Numata K, Fujita A, Shimamura T, Tamada Y, Imoto S, Kinoshita K, et al. A novel strategy to search conserved transcription factor binding sites among coexpressing genes in human. Genome Inform. 2008;20:299.
12. Zinzen RP, Girardot C, Gagneur J, Braun M, Furlong EE. Combinatorial binding predicts spatio-temporalcis-regulatory activity. Nature. 2009;462(7269):65–70.
13. Natarajan A, Yardımcı GG, Sheffield NC, Crawford GE, Ohler U. Predicting cell-type–specific gene expression from regions of open chromatin. Genome Res. 2012;22(9):1711–22.
14. Hong JW, Hendrix DA, Levine MS. Shadow enhancers as a source of evolutionary novelty. Science (New York, NY). 2008;321(5894):1314. 15. Hare EE, Peterson BK, Iyer VN, Meier R, Eisen MB. Sepsid even-skipped
enhancers are functionally conserved inDrosophiladespite lack of sequence conservation. PLoS Genet. 2008;4(6):1000106.
16. Ferretti E, Cambronero F, Tümpel S, Longobardi E, Wiedemann LM, Blasi F, Krumlauf R. Hoxb1 enhancer and control of rhombomere 4 expression: complex interplay between PREP1-PBX1-HOXB1 binding sites. Mol Cell Biol. 2005;25(19):8541–52.
regions based on experimentally determined binding sites of more than 100 transcription-related factors. Genome Biol. 2012;13(9):48.
22. Corradin O, Saiakhova A, Akhtar-Zaidi B, Myeroff L, Willis J, Cowper-Sal R, Lupien M, Markowitz S, Scacheri PC, et al. Combinatorial effects of multiple enhancer variants in linkage disequilibrium dictate levels of gene expression to confer susceptibility to common traits. Genome Res. 2014;24(1):1–13.
23. Dimas AS, Deutsch S, Stranger BE, Montgomery SB, Borel C, Attar-Cohen H, Ingle C, Beazley C, Arcelus MG, Sekowska M, et al. Common regulatory variation impacts gene expression in a cell type–dependent manner. Science. 2009;325(5945):1246–50. 24. Wang D, Rendon A, Wernisch L. Transcription factor and chromatin
features predict genes associated with eQTLs. Nucleic Acids Res. 2013;41(3):1450–63.
25. Wilczynski B, Liu YH, Yeo ZX, Furlong EE. Predicting spatial and temporal gene expression using an integrative model of transcription factor occupancy and chromatin state. PLoS Comput Biol. 2012;8(12):1002798. 26. Blatti C, Kazemian M, Wolfe S, Brodsky M, Sinha S. Integrating motif,
DNA accessibility and gene expression data to build regulatory maps in an organism. Nucleic Acids Res. 2015;43(8):3998–4012.
27. Sanyal A, Lajoie BR, Jain G, Dekker J. The long-range interaction landscape of gene promoters. Nature. 2012;489(7414):109–13. 28. Shen Y, Yue F, McCleary DF, Ye Z, Edsall L, Kuan S, Wagner U, Dixon J,
Lee L, Lobanenkov VV, et al. A map of thecis-regulatory sequences in the mouse genome. Nature. 2012;488(7409):116–20.
29. Hammonds AS, Bristow CA, Fisher WW, Weiszmann R, Wu S, Hartenstein V, Kellis M, Yu B, Frise E, Celniker SE. Spatial expression of transcription factors inDrosophilaembryonic organ development. Genome Biol. 2013;14(12):140.
30. Tomancak P, Berman BP, Beaton A, Weiszmann R, Kwan E, Hartenstein V, Celniker SE, Rubin GM. Global analysis of patterns of gene expression duringDrosophilaembryogenesis. Genome Biol. 2007;8(7):145. 31. Crawford GE, Holt IE, Whittle J, Webb BD, Tai D, Davis S, Margulies EH,
Chen Y, Bernat JA, Ginsburg D, et al. Genome-wide mapping of DNase hypersensitive sites using massively parallel signature sequencing (MPSS). Genome Res. 2006;16(1):123–31.
32. Giresi PG, Kim J, McDaniell RM, Iyer VR, Lieb JD. Faire (Formaldehyde-Assisted Isolation of Regulatory Elements) isolates active regulatory elements from human chromatin. Genome Res. 2007;17(6):877–85. 33. Wu C. The 5’ends of Drosophila heat shock genes in chromatin are
hypersensitive to DNase I. Nature. 1980;286(5776):854–60. 34. Stalder J, Larsen A, Engel JD, Dolan M, Groudine M, Weintraub H.
Tissue-specific DNA cleavages in the globin chromatin domain introduced by DNAase I. Cell. 1980;20(2):451–60.
35. Sabo PJ, Hawrylycz M, Wallace JC, Humbert R, Yu M, Shafer A, Kawamoto J, Hall R, Mack J, Dorschner MO, et al. Discovery of functional noncoding elements by digital analysis of chromatin structure. Proc Natl Acad Sci U S A. 2004;101(48):16837–42.
36. Mifsud B, Tavares-Cadete F, Young AN, Sugar R, Schoenfelder S, Ferreira L, Wingett SW, Andrews S, Grey W, Ewels PA, et al. Mapping long-range promoter contacts in human cells with high-resolution capture Hi-C. Nat Genet. 2015;47(6):598–606.
38. Gallo SM, Gerrard DT, Miner D, Simich M, Des Soye B, Bergman CM, Halfon MS. REDfly v3. 0: toward a comprehensive database of transcriptional regulatory elements inDrosophila. Nucleic Acids Res. 2011;39(suppl 1):118–23.
39. Kvon EZ, Kazmar T, Stampfel G, Yáñez-Cuna JO, Pagani M, Schernhuber K, Dickson BJ, Stark A. Genome-scale functional characterization of Drosophila developmental enhancers in vivo. Nature. 2014;512(7512):91. 40. Song L, Crawford GE. DNase-seq: a high-resolution technique for
mapping active gene regulatory elements across the genome from mammalian cells. Cold Spring Harb Protocol. 2010;2010(2):5384. 41. Ibrahim MM, Lacadie SA, Ohler U. JAMM: a peak finder for joint analysis
of NGS replicates. Bioinformatics. 2015;31(1):48–55.
42. Koenecke N, Johnston J, He Q, Meier S, Zeitlinger J. Drosophila poised enhancers are generated during tissue patterning with the help of repression. Genome Res. 2017;27(1):64–74.
43. Sexton T, Yaffe E, Kenigsberg E, Bantignies F, Leblanc B, Hoichman M, Parrinello H, Tanay A, Cavalli G. Three-dimensional folding and functional organization principles of theDrosophilagenome. Cell. 2012;148(3): 458–72.
44. Hwang YC, Lin CF, Valladares O, Malamon J, Kuksa PP, Zheng Q, Gregory BD, Wang LS. HIPPIE: a high-throughput identification pipeline for promoter interacting enhancer elements. Bioinformatics. 2014;31(8): 1290–2.
45. McLeay RC, Bailey TL. Motif Enrichment Analysis: a unified framework and an evaluation on ChIP data. BMC Bioinforma. 2010;11(1):165.
46. Nitta KR, Jolma A, Yin Y, Morgunova E, Kivioja T, Akhtar J, Hens K, Toivonen J, Deplancke B, Furlong EE, et al. Conservation of transcription factor binding specificities across 600 million years of bilateria evolution. Elife. 2015;4:04837.
47. Clark IB, Boyd J, Hamilton G, Finnegan DJ, Jarman AP. D-six4 plays a key role in patterning cell identities deriving from theDrosophilamesoderm. Dev Biol. 2006;294(1):220–31.
48. Ciglar L, Girardot C, Wilczy ´nski B, Braun M, Furlong EE. Coordinated repression and activation of two transcriptional programs stabilizes cell fate during myogenesis. Development. 2014;141(13):2633–43.
49. Zinzen RP, Senger K, Levine M, Papatsenko D. Computational models for neurogenic gene expression in theDrosophilaembryo. Curr Biol. 2006;16(13):1358–65.
50. Rembold M, Ciglar L, Yáñez-Cuna JO, Zinzen RP, Girardot C, Jain A, Welte MA, Stark A, Leptin M, Furlong EE. A conserved role for Snail as a potentiator of active transcription. Genes Dev. 2014;28(2):167–81. 51. Gabay L, Seger R, Shilo BZ. Map kinase in situ activation atlas during
Drosophilaembryogenesis. Development. 1997;124(18):3535–41. 52. Tomancak P, Beaton A, Weiszmann R, Kwan E, Shu S, Lewis SE, Richards S,
Ashburner M, Hartenstein V, Celniker SE, et al. Systematic determination of patterns of gene expression duringDrosophilaembryogenesis. Genome Biol. 2002;3(12):0081–8.
53. Ochoa-Espinosa A, Yucel G, Kaplan L, Pare A, Pura N, Oberstein A, Papatsenko D, Small S. The role of binding site cluster strength in Bicoid-dependent patterning inDrosophila. Proc Natl Acad Sci U S A. 2005;102(14):4960–5.
54. Jones BW, Abeysekera M, Galinska J, Jolicoeur EM. Transcriptional control of glial and blood cell development inDrosophila:cis-regulatory elements of glial cells missing. Dev Biol. 2004;266(2):374–87.
55. Creyghton MP, Cheng AW, Welstead GG, Kooistra T, Carey BW, Steine EJ, Hanna J, Lodato MA, Frampton GM, Sharp PA, et al. Histone H3K27ac separates active from poised enhancers and predicts developmental state. Proc Natl Acad Sci. 2010;107(50):21931–6.
56. Heinz S, Romanoski CE, Benner C, Glass CK. The selection and function of cell type-specific enhancers. Nat Rev Mol Cell Biol. 2015;16(3):144. 57. Langmead B, Salzberg SL. Fast gapped-read alignment with Bowtie 2.
Nat Methods. 2012;9(4):357–9.
58. Bonn S, Zinzen RP, Perez-Gonzalez A, Riddell A, Gavin AC, Furlong EE. Cell type-specific chromatin immunoprecipitation from multicellular complex samples using BiTS-ChIP. Nat Protoc. 2012;7(5):978–94. 59. Ramírez F, Dündar F, Diehl S, Grüning BA, Manke T. deepTools: a flexible
platform for exploring deep-sequencing data. Nucleic Acids Res. 2014;42(W1):187–91.
60. Hwang YC, Zheng Q, Gregory BD, Wang LS. High-throughput identification of long-range regulatory elements and their target promoters in the human genome. Nucleic Acids Res. 2013;41(9):4835–46.
61. Yaffe E, Tanay A. Probabilistic modeling of Hi-C contact maps eliminates systematic biases to characterize global chromosomal architecture. Nat Genet. 2011;43(11):1059–65.
62. Lawrence M, Huber W, Pages H, Aboyoun P, Carlson M, Gentleman R, Morgan MT, Carey VJ. Software for computing and annotating genomic ranges. PLoS Comput Biol. 2013;9(8):1003118.
63. Gupta S, Stamatoyannopoulos JA, Bailey TL, Noble WS. Quantifying similarity between motifs. Genome Biol. 2007;8(2):24.
64. Construction V. New Drosophila transgenic reporters: insulated P-element vectors expressing fast-maturing RFP. Biotechniques. 2004;36(3):436–42. 65. Rubin GM, Spradling AC. Genetic transformation ofDrosophilawith
transposable element vectors. Science. 1982;218(4570):348–53. 66. Kosman D, Mizutani CM, Lemons D, Cox WG, McGinnis W, Bier E.
Multiplex detection of RNA expression inDrosophilaembryos. Science. 2004;305(5685):846–6.
• We accept pre-submission inquiries
• Our selector tool helps you to find the most relevant journal
• We provide round the clock customer support
• Convenient online submission
• Thorough peer review
• Inclusion in PubMed and all major indexing services
• Maximum visibility for your research
Submit your manuscript at www.biomedcentral.com/submit