Technology (IJRASET)
Modelling of Single Point Cutting Tool Deflection
due to Cutting Forces under Variable Side Rake
Angle
Vishrant Kalasua1, Gaurav Tiwari2, Ankit Thakur3
# Mechanical Department, Mewar University
Abstract: The purpose of this study was to determine the Single point cutting tool deflection due to cutting forces which were developed because of different parameters like feed, depth of cut, cutting speed and also because of geometrical parameters of cutting tool like side cutting edge angle and side rake angle. Firstly the cutting forces were measured using dynamometer. Then finite element method (FEM) was used to obtain the cutting tool deflection which is finite element analysis (FEA). The FEA results were then validated using cantilever beam model results. The predicted results from FEA were very close to the theoretical study. Though the prediction from FEA and the theoretical results are reasonably accurate, FEA modelling seems to be more preferable due to significantly less computational time and space.
Keywords: Single point cutting tool, Deflection, Cutting Forces, Finite element analysis, Cantilever beam model.
I. INTRODUCTION
The research work in single point cutting tool deflection is important on the basis of accuracy. Cutter deflection consist of different directional deformation such as axial deformation, tangential deformation, radial deformation due to cutting forces exist during cutting. Also other factors like depth of cut, cutting speed, and feed also effects on the accuracy of ideal geometry. However the deflection of tool under the action of cutting forces could be beyond acceptance level especially when the geometric condition of tool is changed. Over the years many researchers focused to compensate many different factors affected by cutting forces and geometrical changes of tool. Flank wear of single point cutting tool due to cutting forces by varying side cutting edge angle can be calculated by using shear area of cutting process [1]. Cutting force varies as there is change in cutting condition such as width of cut, thickness of cut, feed, depth of cut and tool cutting edge angle. So the cutting forces are influenced not only by the cutting condition but also the cutting edge geometry and material of workpiece [2]. Cutting parameters (cutting speed, feed rate and depth of cut) have influence tool temperature, tool wear, cutting forces and surface roughness of carbide coated tools [3]. Using von-Misses theory tool life’s increment can be achieved by increasing back rake angle. The resultant von-Misses stress can be calculated using FEA simulation [4]. Deflection of tool affects on their tool life, surface roughness and dimensional correctness. The results can be calculated using Taguchi’s experimental design method and FEM analysis using ABAQUS finite element program [5]. As no one has worked on the deflection of tool under when side rake angle is changed, this research work shows results of tool deflection under variable side rake angle using finite element analysis. Analytical solution may not predict the deflection very accurately whereas the more realistic prediction by FEA requires extensive computational time and space. Thus in the present work the tool deflection is predicted by FEA prediction and results are compared and validated with beam model. Cantilever beam model predicts the deflection to very close accuracy similar to finite element. The predicted deflections in axial, radial, tangential directions by FEA are compared with Beam model results at different side cutting edge angle and increasing side rake angle for single point cutting tool for tungsten carbide.
II. MATERIALS AND METHOD
A. Finite Element Analysis
Finite element analysis is carried out to study the cutting tool deflection in three directions e.g., axial, radial and tangential direction due to simultaneous action of all three cutting forces namely axial force (Fa), radial force (Fr), tangential force (Ft).
Technology (IJRASET)
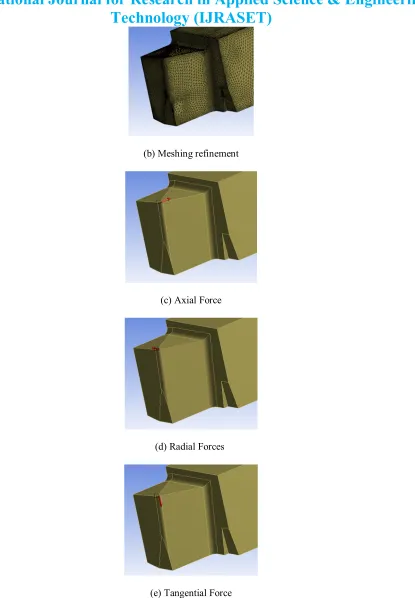
force. The three-axis component forces are Axial cutting force acting in X axis, Radial cutting force acting in Y axis and tangential cutting force acting in Z axis. Below the cutting forces are shown graphically in Fig 1(a), 1(b), 1(c). Nine different tools having variable side rake angle according to increasing side cutting edge angle as shown in the following tables having tungsten carbide material properties (Yield strength 1404 MPa, Tensile strength 344 MPa, Young’s modulus 669 GPa, Poisson’s ratio 0.25) is considered for present simulation. Figure 2(a) shows the CAD model of single point cutting tool. Complete cutting tool geometry is meshed with 25554 tetrahedral elements (51793 nodes) with mesh refinement. Figure 2(b) shows meshing of tool. Experimentally measured axial, radial, tangential forces are applied on the edge of nose radius in respective direction [shown in Fig 2(c), 2(d), 2(e)]. Axial, radial, tangential forces at different side rake angle are applied with different DOC (d = 0.5, 0.75 and 1 mm), whereas feed (f = 0.3 mm/min) and cutting speed (N = 160 rpm) is kept constant. The tool deflections are predicted by FEA under the simultaneous changes in side rake angle. Shank of cutting tool ( upto the length to which it is hold ) is fixed and remaining shank length along with the flank length of tool behaves like cantilever beam. Average measured forces after the stabilization is used to calculate the tool deflection by FEA as well as beam model. After the simulation, the deflection in axial (δa), radial (δr) and tangential (δt) direction are extracted and compared with beam model results.
(a) Cutting forces for Side cutting edge angle 20o
(b) Cutting forces for Side cutting edge angle 30o
[image:3.612.200.418.263.501.2](c) Cutting forces for Side cutting edge angle 40o
Figure 1 – Graphical representation of experimental cutting forces due to DOC 0
200 400 600
0.5 0.75 1
C u tti n g F o r c e s (N ) DOC (mm) Axial (X) Radial (Y) Tangential (Z) 0 200 400 600
0.5 0.75 1
C u tti n g F o r c e s (N ) DOC (mm) Axial (X) Radial (Y) Tangential (Z) 0 200 400 600
0.5 0.75 1
[image:3.612.196.418.549.671.2]Technology (IJRASET)
[image:4.612.193.422.297.435.2]Table 1.1 Parameters of Single Point Cutting Tool for Side Cutting Edge Angle 20o
Table 1.2 Parameters of Single Point Cutting Tool for Side Cutting Edge Angle 30o
Table 1.3 Parameters of Single Point Cutting Tool for Side Cutting Edge Angle 40o
(a) CAD Model
Angle Tool 1 Tool 2 Tool 3 End Relief Angle 10 10 10 Side Rake Angle 10 20 30 Side Relief Angle 10 10 10 Side Cutting Edge
Angle
20 20 20 End Cutting Edge
Angle
15 15 15 Back Rake Angle 10 10 10
Angle Tool 1
Tool 2 Tool 3 End Relief Angle 10 10 10 Side Rake Angle 10 20 30 Side Relief Angle 10 10 10 Side Cutting Edge
Angle
30 30 30 End Cutting Edge
Angle
15 15 15 Back Rake Angle 10 10 10
Angle Tool 1 Tool 2 Tool 3 End Relief Angle 10 10 10 Side Rake Angle 10 20 30 Side Relief Angle 10 10 10 Side Cutting Edge
Angle
40 40 40 End Cutting Edge
Angle
[image:4.612.192.420.471.704.2]Technology (IJRASET)
(b) Meshing refinement
(c) Axial Force
(d) Radial Forces
[image:5.612.115.530.50.648.2](e) Tangential Force
Figure 2 – Single point cutting tool, meshing and boundary condition used for FEA.
B. Beam Modelling
Technology (IJRASET)
found out using Castigliano’s theorem.
A force based model for cutter deflection is developed by considering the cutting tool as cantilever beam with forces and moments. The total strain energy (Ua) stored in the tool of length (L), cross sectional area (A) and young’s modulus (E) due to axial force (Fa)
is given by
= ∫ (1)
The total shear strain energy (Ur,t) stored in the tool with modulus of rigidity (G) due to radial force (Fr) and tangential force (Ft) is
given by
= ∫ , (2)
The total strain energy (Um) stored in the tool with moment of inertia (I) due to bending moment (M) is given by
= ∫ (3)
The total strain energy stored (Ut) in the tool with polar moment of inertia (J) due to Torsion is given by
= ∫ (4)
Total strain energy is calculated as
=
2 +
,
2 + 2 + 2
= + + + + + (5)
According to Castigliano’s theorem, the displacement corresponding to any force is given by
= (6)
Therefore, by using Castigliano’s theorem, the deflection in the direction of axial (δa), radial (δr) and tangential (δt)
obtained as
δ = = (7)
δ = = + (8)
Technology (IJRASET)
III. RESULT AND DISCUSSIONThe FEA analysis results show decrease in axial deflection at some extant, continues increase in radial deflection, and varying deflection results for tangential deflection for increasing side rake angle. In Fig 3(a), 3(b), 3(c) FEA predictions for deflection are shown below.
(a) Axial Deflection
(b) Radial Deflection
\
[image:7.612.231.383.135.608.2](c) Tangential Deflection
Figure 3 – Sample force plot and sample FE results of single point cutting tool deflection.
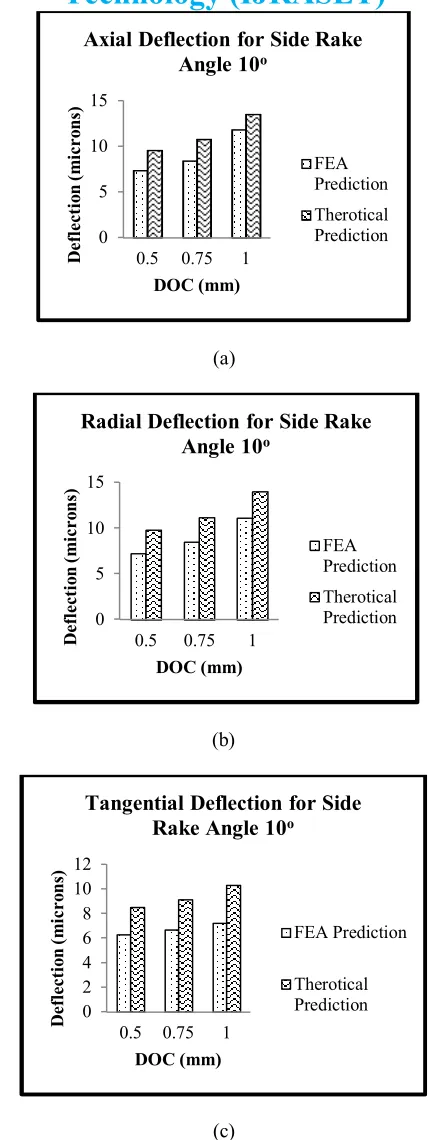
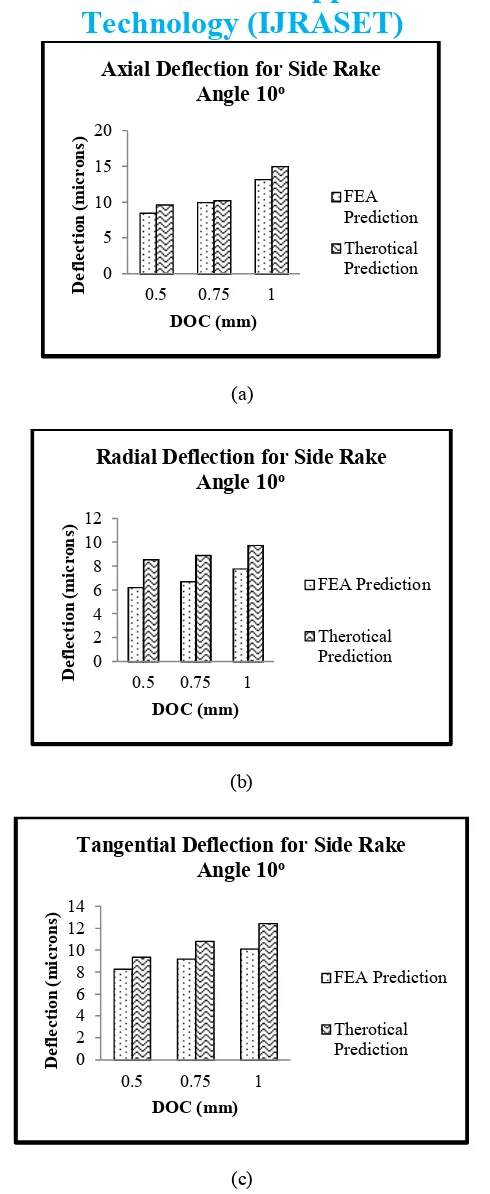
Figure 4 shows the comparison of deflection in axial, radial, tangential direction between FEA and Beam modelling for side rake angle 10o with side cutting edge angle 20o. The process parameters are given as cutting speed 160rpm, feed 0.3 mm/min and DOC = (0.5, 0.75, and 1). The can be observed that axial deflection and tangential deflection are very closely predicted by FEA and beam modelling with maximum error less than 10%. However, deviation in radial deflection can be observed between FEA and beam modelling.
Technology (IJRASET)
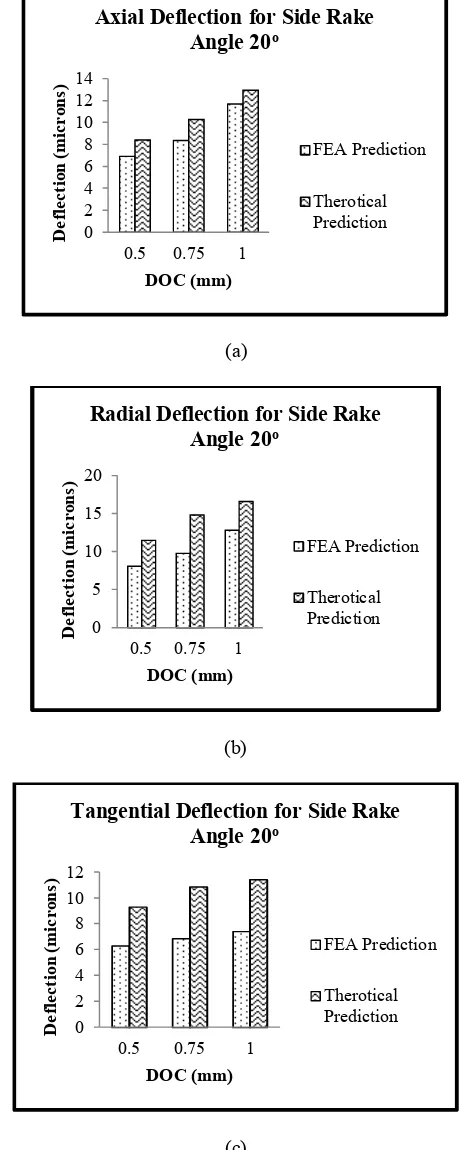
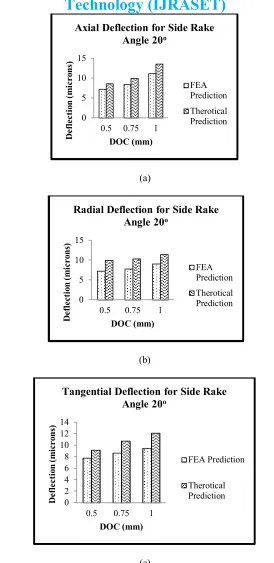
angle 20o with side cutting edge angle 20o. The process parameters are given as cutting speed 160rpm, feed 0.3 mm/min and DOC = (0.5, 0.75, and 1). The can be observed that axial deflection and tangential deflection are very closely predicted by FEA and beam modelling with maximum error less than 10%. However, deviation in radial deflection can be observed between FEA and beam modelling.
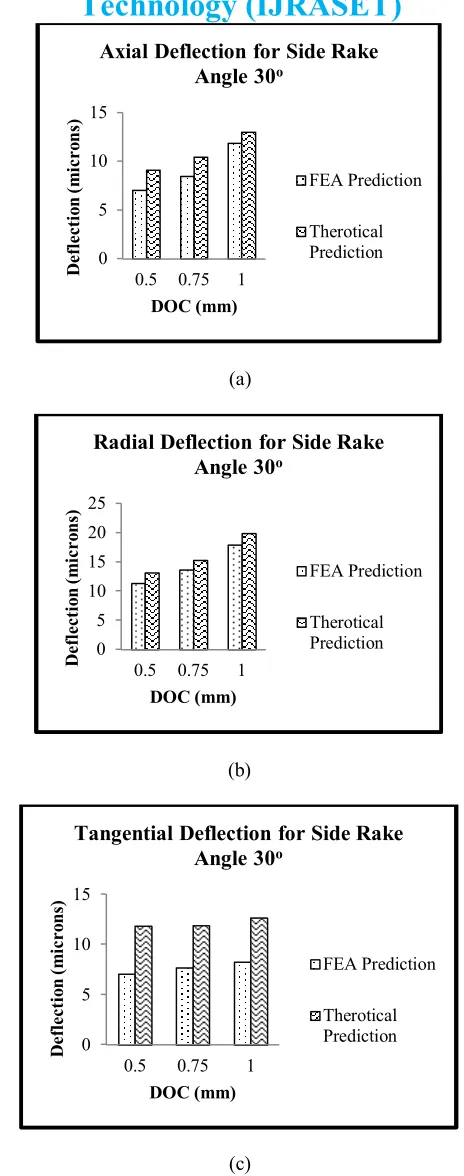
Figure 6 shows the comparison of deflection in axial, radial, tangential direction between FEA and Beam modelling for side rake angle 30o with side cutting edge angle 20o. The process parameters are given as cutting speed 160rpm, feed 0.3 mm/min and DOC = (0.5, 0.75, and 1). The can be observed that axial deflection and tangential deflection are very closely predicted by FEA and beam modelling with maximum error less than 10%. However, deviation in radial deflection can be observed between FEA and beam modelling.
Figure 7 shows the comparison of deflection in axial, radial, tangential direction between FEA and Beam modelling for side rake angle 10o with side cutting edge angle 30o. The process parameters are given as cutting speed 160rpm, feed 0.3 mm/min and DOC = (0.5, 0.75, and 1). The can be observed that axial deflection and tangential deflection are very closely predicted by FEA and beam modelling with maximum error less than 10%. However, deviation in radial deflection can be observed between FEA and beam modelling.
Figure 8 shows the comparison of deflection in axial, radial, tangential direction between FEA and Beam modelling for side rake angle 20o with side cutting edge angle 30o. The process parameters are given as cutting speed 160rpm, feed 0.3 mm/min and DOC = (0.5, 0.75, and 1). The can be observed that axial deflection and tangential deflection are very closely predicted by FEA and beam modelling with maximum error less than 10%. However, deviation in radial deflection can be observed between FEA and beam modelling.
Figure 9 shows the comparison of deflection in axial, radial, tangential direction between FEA and Beam modelling for side rake angle 30o with side cutting edge angle 30o. The process parameters are given as cutting speed 160rpm, feed 0.3 mm/min and DOC = (0.5, 0.75, and 1). The can be observed that axial deflection and tangential deflection are very closely predicted by FEA and beam modelling with maximum error less than 10%. However, deviation in radial deflection can be observed between FEA and beam modelling.
Figure 10 shows the comparison of deflection in axial, radial, tangential direction between FEA and Beam modelling for side rake angle 10o with side cutting edge angle 40o. The process parameters are given as cutting speed 160rpm, feed 0.3 mm/min and DOC = (0.5, 0.75, and 1). The can be observed that axial deflection and tangential deflection are very closely predicted by FEA and beam modelling with maximum error less than 10%. However, deviation in radial deflection can be observed between FEA and beam modelling.
Figure 11 shows the comparison of deflection in axial, radial, tangential direction between FEA and Beam modelling for side rake angle 20o with side cutting edge angle 40o. The process parameters are given as cutting speed 160rpm, feed 0.3 mm/min and DOC = (0.5, 0.75, and 1). The can be observed that axial deflection and tangential deflection are very closely predicted by FEA and beam modelling with maximum error less than 10%. However, deviation in radial deflection can be observed between FEA and beam modelling.
Technology (IJRASET)
(a)
(b)
[image:9.612.194.409.71.641.2](c)
Figure 4 – Comparison of (a) axial (b) radial (c) tangential deflection due to DOC for side cutting edge angle 20o
0 5 10 15
0.5 0.75 1
D e fl e c ti o n ( m ic r o n s) DOC (mm)
Axial Deflection for Side Rake
Angle 10o
FEA Prediction Therotical Prediction 0 5 10 15
0.5 0.75 1
D e fl e c ti o n ( m ic r o n s) DOC (mm)
Radial Deflection for Side Rake
Angle 10o
FEA Prediction Therotical Prediction 0 2 4 6 8 10 12
0.5 0.75 1
D e fl e c ti o n ( m ic r o n s) DOC (mm)
Tangential Deflection for Side
Rake Angle 10o
FEA Prediction
Technology (IJRASET)
(a)
(b)
[image:10.612.188.419.82.657.2](c)
Figure 5 – Comparison of (a) axial (b) radial (c) tangential deflection due to DOC for side cutting edge angle 20o
0 2 4 6 8 10 12 14
0.5 0.75 1
D e fl e c ti o n ( m ic r o n s) DOC (mm)
Axial Deflection for Side Rake
Angle 20o
FEA Prediction Therotical Prediction 0 5 10 15 20
0.5 0.75 1
D e fl e c ti o n ( m ic r o n s) DOC (mm)
Radial Deflection for Side Rake
Angle 20o
FEA Prediction Therotical Prediction 0 2 4 6 8 10 12
0.5 0.75 1
D e fl e c ti o n ( m ic r o n s) DOC (mm)
Tangential Deflection for Side Rake
Angle 20o
FEA Prediction
Technology (IJRASET)
(a)
(b)
[image:11.612.186.418.65.653.2](c)
Figure 6 – Comparison of (a) axial (b) radial (c) tangential deflection due to DOC for side cutting edge angle 20o
0 5 10 15
0.5 0.75 1
D e fl e c ti o n ( m ic r o n s) DOC (mm)
Axial Deflection for Side Rake
Angle 30o
FEA Prediction Therotical Prediction 0 5 10 15 20 25
0.5 0.75 1
D e fl e c ti o n ( m ic r o n s) DOC (mm)
Radial Deflection for Side Rake
Angle 30o
FEA Prediction Therotical Prediction 0 5 10 15
0.5 0.75 1
D e fl e c ti o n ( m ic r o n s) DOC (mm)
Tangential Deflection for Side Rake
Angle 30o
FEA Prediction
Technology (IJRASET)
(a)
(b)
[image:12.612.185.430.56.653.2](c)
Figure 7 – Comparison of (a) axial (b) radial (c) tangential deflection due to DOC for side cutting edge angle 30o
0 5 10 15 20
0.5 0.75 1
D e fl e c ti o n ( m ic r o n s) DOC (mm)
Axial Deflection for Side Rake
Angle 10o
FEA Prediction Therotical Prediction 0 2 4 6 8 10 12
0.5 0.75 1
D e fl e c ti o n ( m ic r o n s) DOC (mm)
Radial Deflection for Side Rake
Angle 10o
FEA Prediction Therotical Prediction 0 2 4 6 8 10 12 14
0.5 0.75 1
D e fl e c ti o n ( m ic r o n s) DOC (mm)
Tangential Deflection for Side Rake
Angle 10o
FEA Prediction
Technology (IJRASET)
(a)
(b)
[image:13.612.161.435.63.626.2](c)
Figure 8 – Comparison of (a) axial (b) radial (c) tangential deflection due to DOC for side cutting edge angle 30o
0 5 10 15
0.5 0.75 1
D e fl e c ti o n ( m ic r o n s) DOC (mm)
Axial Deflection for Side Rake
Angle 20o
FEA Prediction Therotical Prediction 0 5 10 15
0.5 0.75 1
D e fl e c ti o n ( m ic r o n s) DOC (mm)
Radial Deflection for Side Rake
Angle 20o
FEA Prediction Therotical Prediction 0 2 4 6 8 10 12 14
0.5 0.75 1
D e fl e c ti o n ( m ic r o n s) DOC (mm)
Tangential Deflection for Side Rake
Angle 20o
FEA Prediction
Technology (IJRASET)
(a)
(b)
[image:14.612.164.428.65.659.2](c)
Figure 9 – Comparison of (a) axial (b) radial (c) tangential deflection due to DOC for side cutting edge angle 30o
0 5 10 15 20
0.5 0.75 1
D e fl e c ti o n ( m ic r o n s) DOC (mm)
Axial Deflection for Side Rake
Angle 30o
FEA Prediction Therotical Prediction 0 5 10 15 20
0.5 0.75 1
D e fl e c ti o n ( m ic r o n s) DOC (mm)
Radial Deflection for Side Rake
Angle 30o
FEA Prediction Therotical Prediction 0 5 10 15 20
0.5 0.75 1
D e fl e c ti o n ( m ic r o n s) DOC (mm)
Tangential Deflection for Side Rake
Angle 30o
FEA Prediction
Technology (IJRASET)
(a)
(b)
[image:15.612.179.423.67.644.2](c)
Figure 10 – Comparison of (a) axial (b) radial (c) tangential deflection due to DOC for side cutting edge angle 40o
0 5 10 15 20
0.5 0.75 1
D
e
fl
e
c
ti
o
n
(
m
ic
r
o
n
s)
DOC (mm)
Axial Deflection for Side Rake
Angle 10o
FEA Prediction
Therotical Prediction
0 5 10 15
0.5 0.75 1
D
e
fl
e
c
ti
o
n
(
m
ic
r
o
n
s)
DOC (mm)
Radial Deflection for Side Rake
Angle 10o
FEA Prediction
Therotical Prediction
0 5 10 15
0.5 0.75 1
D
e
fl
e
c
ti
o
n
(
m
ic
r
o
n
s)
DOC (mm)
Tangential Deflection for Side Rake
Angle 10o
FEA Prediction
Technology (IJRASET)
(a)
(b)
[image:16.612.182.419.77.637.2](c)
Figure 11 – Comparison of (a) axial (b) radial (c) tangential deflection due to DOC for side cutting edge angle 40o
0 5 10 15
0.5 0.75 1
D e fl e c ti o n ( m ic r o n s) DOC (mm)
Axial Deflection for Side Rake
Angle 20o
FEA Prediction Therotical Prediction 0 5 10 15 20
0.5 0.75 1
D e fl e c ti o n ( m ic r o n s) DOC (mm)
Radial Deflection for Side Rake
Angle 20o
FEA Prediction Therotical Prediction 0 2 4 6 8 10 12 14
0.5 0.75 1
D e fl e c ti o n ( m ic r o n s) DOC (mm)
Tangential Deflection for Side Rake
Angle 20o
FEA Prediction
Technology (IJRASET)
(a)
(b)
[image:17.612.183.417.67.645.2](c)
Figure 12 – Comparison of (a) axial (b) radial (c) tangential deflection due to DOC for side cutting edge angle 40o
0 5 10 15 20
0.5 0.75 1
D e fl e c ti o n ( m ic r o n s) DOC (mm)
Axial Deflection for Side Rake
Angle 30o
FEA Prediction Therotical Prediction 0 5 10 15 20 25
0.5 0.75 1
D e fl e c ti o n ( m ic r o n s) DOC (mm)
Radial Deflection for Side Rake
Angle 30o
FEA Prediction Therotical Prediction 0 5 10 15
0.5 0.75 1
D e fl e c ti o n ( m ic r o n s) DOC (mm)
Tangential Deflection for Side
Rake Angle 30o
FEA Prediction
Technology (IJRASET)
IV. CONCLUSIONThe FEA analysis shows that the tool deflection depends not only on the cutting forces but geometrical parameters, higher the cutting force higher will be the value of tool deflection, but whereas for the side rake angle the deflection decreases for some extent and then increases. From the results it was concluded that a deflection value varies throughout the tool. It is maximum at tool tip and minimum at holding position. The critical analysis of results shows that when side rake angle along with side cutting edge angle is varied by keeping others parameter constant, the deformation values seemed to be more sensitive to it. It means the value of deflection decreases to certain extent with the increase in side rake angle, which decreases the tool deflection. Axial deflection decrease to certain extent for increase in side rake angle, whereas Radial deflection increase in every case. Tangential deflection varies with side cutting edge angle. The results of theoretical deflection are more than FEA results.
REFERENCES
[1]. C.S. Chang and K.H. Fuh, 1995, A force model of single point cutting tool with a chamfered main cutting edge when wearing has occurred. Journal of Materials Processing Technology 66(1997) 49,62.
[2]. R. Miroslav, 2006, Experimental determination of cutting forces by longitudinal turning of C60E steel. Romanian Technical Science Academy. Vol. 2.
[3]. F. M. Aherio et al., 2008, Turning hardened steel using coated carbide at high cutting speed. Journal of the Brazilian society of Mechanical Science and Engineering vol, 2, 1109.
[4]. D. Lathwal and D. Bhardwaj, 2013, Study and analysis of single point cutting tool under variable rake angle. IJRASET vol. 1, issue 1.
[5]. V.B. Renjith, 2013, Influence of process parameters on cutting forces and Taguchi based prediction of T42-CT H.S.S single point cutting tool deflection. International Journal of Science and Research Publication vol. 3, issue 7.
[6]. L. S. Srinath, 2009, Advance mechanics of solids. Tata McGraw hill education private limited, New Delhi. [7]. Dr. S. K. Singh, 2012, Production Engineering.
AUTHORS BIOGRAPHY
Vishrant Kalasua – Post Graduate Student, Mechanical Engineering Department, Mewar University, Rajasthan, India,
Gaurav Tiwari – Head of the Department, Mechanical Engineering Department, Mewar University, Rajasthan, India,
Ankit Thakur – Assistant Professor, Mechanical Engineering Department, Mewar University, Rajasthan, India,
![Fig 2(c), 2(d), 2(e)]. Axial, radial, tangential forces at different side rake angle are applied with different DOC (d = 0.5, 0.75 and 1](https://thumb-us.123doks.com/thumbv2/123dok_us/8586004.862424/3.612.200.418.263.501/axial-radial-tangential-forces-different-angle-applied-different.webp)