5
VIII
August 2017
Locating Tumours in the MRI Image of the Brain
by using Pattern Based K-Means and Fuzzy
C-Means Clustering Algorithm
N. Yashwanth1, Naveen Kumar. G. N2
1M.Tech student, 2Assistant Professor, Department of Electronics & Communication Engineering
CMRIT Bengaluru 560037, Karnataka, India
Abstract: This paper presents a powerful segmentation method which is the integration of Pattern based K-means also modified Fuzzy C-means (PKFCM) gathering calculation for trademark extraction with versatile gamma amendment which result in better upgraded picture contrast with other existing strategies. In this strategy, the model is selected based on the convolution between the gray level intensity in the small portion of the brain image and the image of the brain tumor. The K algorithm means emphasizing the initial segmentation through proper model selection. Updated membership is obtained using the distances from cluster centroid to cluster data points, until it reaches the best. This Euclidian distance depends on the different characteristics, namely intensity, entropy, contrast, dissimilarity and homogeneity of the coarse image, which only depended on its similarity to conventional FCMs. Then, depending on the upgrade and automatic cluster selection, a sharp segmented image with a red marked tumor is obtained by modified FCM technique. The small deviation of the gray level intensity of normal and abnormal tissue is detected through PKFCM. The performance of the PKFCM method is analyzed through the neural network which provide better regression and less error. The performance parameters show significant results that they are effective in detecting brain tumors based on multiple intensity MRI images of brain.
Keywords: Pattern based K-means and Fuzzy C-means algorithm, Cluster data points, Euclidian distance, FCM, updated membership.
I. INTRODUCTION
In recent decades, effective brain tumor detection in the context of MRI has been a major challenge for medical science. Magnetic resonance technique has a good contrast compared to different techniques. However, an adequate segmentation of brain magnetic resonance imaging is evident to detect anomalies in the brain. As the brain understands the complicated structure so the segmentation of magnetic resonance requires good care and needs to be accurate.Segmentation describes salient image regions to procure by region (s) of interest (ROIs) such as legions, tumors, edema, and necrotic brain imaging tissue [1].
For segmentation of brain image, numerous image processing has been proposed, such as region growth threshold, classifiers, artificial neural networks (ANN), grouping, etc.
Scalar segmentation of images by creating a binary partition of the image intensity is performed according to the threshold. Due to the complexity of the brain tissue structure, the appropriate threshold value is very difficult to achieve. The main disadvantage is that the threshold cannot be applicable for multi-channel images. It also provides spatial characteristics, which makes it susceptible to noise and non-uniform intensity. Also, the threshold restriction also used collectively with other classifier methods, ANN, grouping, etc. Based on some predefined criteria, i.e. intensity and edges information, the linked region of an image is extracted in the growing region [2].
In addition, precise anatomical information is needed to locate single or multiple seed pixels for each region associated with homogeneity is called region growing [3-4]. The main limitation to the region's growth is that the seed point is established through manual interaction. In the Classifier method, you need an errorless pixel classifier for retraining data. Inadequate training and classifier are time-bound and leads to hilarious results [2]. In the cluster technique, Fuzzy c-means (FCM) clustering and
expectation maximization (EM) algorithms are most often clusters, due used for clustering.
sensitivity to the initial hypothesis (speed, local minima), noise sensitivity is expected and a low (or even no), and noisy point. But for optimal results in this field we must minimize the limitation of the individual methods described here [5].
In this paper we proposed a different technique for the detection of brain tumors through MRI image, based on the combination of K-means model-based and modified FCM (PKFCM). The pattern or gray level selection and noise of FCM method and region growing is reduced. The k-means extension is based on models applied through the position of pixel intensity. Very little Pixel intensity is not avoided, as the model is selected according to the number of gray-level to use and the coarse image. The FCM algorithm is modified based on updated membership and the number of cluster members for the filtered image. Updated membership is based on features such as intensity, entropy, contrast, and homogeneity of the brain magnetic resonance imaging. By choosing the input membership and appropriate output variables together with the set number of functions and clusters, the tumor detection is completed neatly. The total yield is analyzed through the neural network, which is widely accepted in the segmentation field. It is executed to prepare and train the data for the suitable image through the network which has feedforward backpropagation algorithm.
II. METHODOLOGY
A. K-Means Algorithm
Historically, the average K-mean cluster is usually introduced to group a set of data points { } into clusters K [6]. It has high computational efficiency and can support multidimensional vectors. Therefore, it reduces the minimization measurement distortion of a cost function such as:
Here, ||. || Measure the distance from the center. The center and number of dots in the group are represented by the and , variables, respectively.
B. Fuzzy C-Means Algorithm
The Fuzzy C-means clustering (FCM), introduced by Bezdek, is an improvement of previous clustering methods [7]. It is based on the minimization of an objective function with respect to the membership of fuzzy U and centroids of clusters V:
In is a P × N data structure, where P represents the dimension of each of the 'characteristic' vectors
vectors and N represents the number of Vector image function. C is the number of clusters. Is the function of
the vector xj to the ith gathering, which satisfies Beyond what many would consider
possible is conceded as:
V={ } which is a P×C cross section which implies the bundle highlight center takes after:
|| . || it can be defined as a direct generalization or Euclidean distance as the distance of Mahalanobis. The X vector feature in the MR image represents the intensity of the pixel P = l. The FCM algorithm optimally optimizes (U, V) with continuous U and V update, for
Until where l is the measure of cycles.
III. PROPOSEDALGORITHM
The algorithm proposed is the integration of k-means and Fuzzy c-means with some modifications. The model is added together with the traditional means k, which is identified by the intensity of the gray level or the intensity of the brain image. In addition to fuzzy c-adhesion media and the Euclidean distance is altered by the characteristics of the image [8]. The k-means based on the model and F-modified by Fuzzy segmentation of the grouping algorithm can write the equation as follows:
Where M and N are the row and column , a binary image matrix. The center of gravity of the group, the number of data points in groups, and the number of groups defined by R, K and C, respectively. The last stroke is defined as blurred c-media whose Euclidean distance depends on the characteristics of the image. The central part is used as a conventional k-means algorithm, defined by the distance from each point to the center of the cluster. Here, B ( ) is the coarse image is marked in describing the desired pattern can be below the equation.
Organization based window is picked by which is given as:
In this equation, there is an image matrix based on the number of gray intensity temperament number, and the number of squares G, S that is used to detect the nature of P ( ). ) of the image. Here is the temperament-based convolution matrix and cause the image to get the model of the k-means algorithm image [8].
In the diffused medium is the function of belonging to which the Euclidean distance d (x, y) is updated by the value image
features F= { }, the degree of confusion M, and the center has V= { } is expressed as:
In previous studies, this Euclidean distance is used based on one of the features of such a similarity [18], but in our method it is based on features such as contrast, homogeneity, entropy, etc.
Center groups from which cluster locations are detected and tumor can be defined as:
A. We have Extracted the following Five Characteristics for the Classification Category
1) Energy:
2) Here, G is the gray level co-occurrence matrix.
3) Contrast:
.
5) Entropy:
6) Dissimilarity:
B. Summary of PKFCM Algorithm
1) Characterize number of dim level and decide square network,
2)
3)
4) Where A is square network or matrix and P is picture lattice
5) Introduce format of pattern
6) Decide coarse picture, B(xi,yj) from layout, Tmn
7) Reshape format based k-implies portioned picture matrix
8) 9) Rehash step 2 to 4 until
10) Post prepare the P1
11) Decide group centroid, C and level of fluffiness, m.
12) Instate enrollment
13) Compute group focus,
14) Decide picture highlights
15) Apply adative gamma corections
16) Calculate tumor region using
IV.BLOCKDIAGRAMOFPKFCMALGORITHM
Cerebrum MRI pictures were gathered from various restorative focuses. These cerebrum MRI pictures were changed over into two dimensional lattices utilizing MATLAB (R2015b).This illustration demonstrates a few picture improvement approaches. Three capacities are especially reasonable for differentiation upgrade: imadjust, histeq, and adapthisteq.
A. Flow Chart
Fig -2: Flow chart of PKFCM algorithm
The whole method that has been proposed for the detection of tumor in brain MRI image using pattern based K-means and modified fuzzy C-means is described in the flow chart. In this flow chart firstly there is manipulated acquisition of brain MRI image, and then it is processed and given at the input of pattern based k-means segmentation method. The results from the modified fuzzy C-means with updated membership is obtained, then the extracting the last cluster (ROI) and feature extraction is processed with the adaptive gamma correction, finally the tumor is detected (red line marked) [8].
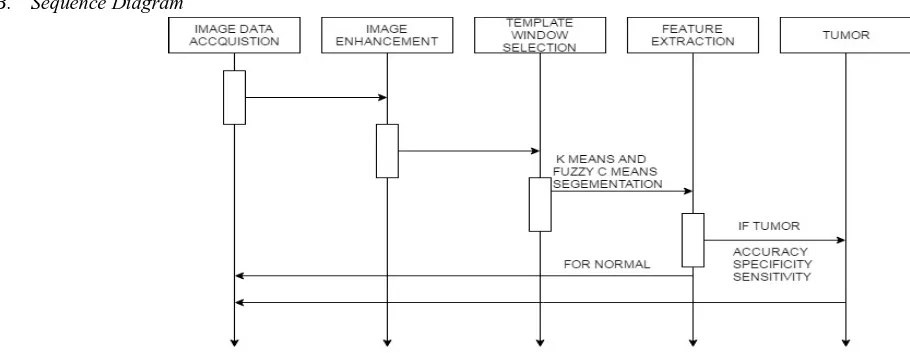
[image:6.612.43.498.540.720.2]B. Sequence Diagram
V. RESULTSANDANALYSIS
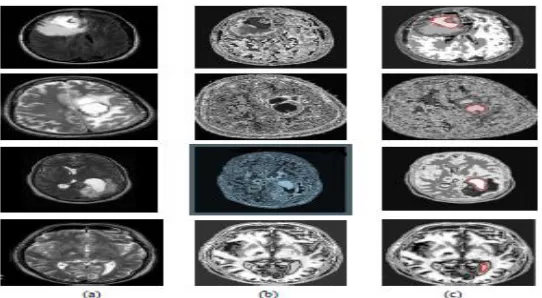
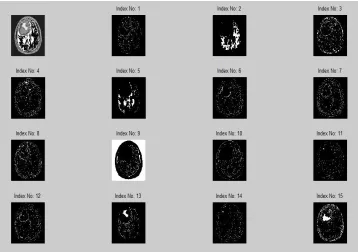
[image:7.612.129.480.316.514.2]There is a brain tumor image database 30 shown in Figure 5. We arrived at the database through various complex brain tumor images. These images are collected by [6-11] and processed to enhance our algorithm application. Then we processed these images together with Mat lab and obtained the final consumption database shown in Figure 5. The tumor in this image is so critical that it is difficult for common people to identify it so easily. In this algorithm we used PKFCM 3, 5, 10, 27 digital imaging databases to detect the tumor position shown in Figure 6. Hence a small portion of brain tumor not avoided. The input image is first processed through a filter, then in Figure 6 (b) is a first segmentation of images using media patterns k (TK), which is segmented based on the intensity of gray color and temperament. After that, the tumor is detected and reported as a red line in Figure 6 (c) using fuzzy modified c-media (FCM) based on the Euclidean distance from the cluster center for each data point it mainly depends on the different characteristics. This may be important to understand the importance of this modified and embedded method. Based on the intensity of the gray level, the modified FCM is performed for 15 groups. The grouped image is known as an image with smaller gray levels and separates color intensity between them consecutively. For example, multiple images grouped for the incoming image do not. 3 are shown in Figure 7. Here, the tumor portion is selected with another portion of the image shown in a separate image, based on the tumor feature. Here, index no. 13 is automatically selected and marked as a red line in Figure 6. The network-based selection criteria based on the performance of this technique shown in Figure 8. Here the network consists of 30 layers of input vector, a hidden layer neuron 17, and an output layer. Typically, the network consists of three layers such as input layer, hidden layer, and output layer. The input level and output is user-defined, but the hidden layer is selected based on the performance. Hidden layer can be one or more of the analysis, but it is required in the hidden layer n. Layer should be less numbered.
Fig -5: The collection of 30 mind tumor MRI picture
[image:7.612.172.443.545.694.2]Fig -7: Several bunched pictures for information picture
Fig -8: The Neural Network architecture
[image:8.612.135.479.364.523.2]A. Input MRI Image 1
Fig -9: Algoritham output for abnormal MRI input image
Fig-10: Result & analysis of abnormal MRI image
[image:9.612.203.410.305.398.2]B. Input MRI Image 2
Fig-11: Algoritham output for abnormal MRI input image
[image:9.612.157.454.443.597.2]C. Input MRI Image 3
[image:10.612.168.446.302.387.2]Fig -13: Algoritham output for normal MRI input image
Fig-14: Result & analysis of normal MRI image
D. Input MRI Image 4
Fig -15: Algoritham output for normal MRI input image
[image:10.612.139.469.428.593.2] [image:10.612.181.430.623.703.2]these are the result which is obtained by using our preposed algoritham.and the performance parameters can be calculated for the 30 brain tumor images through following mathematical expression.
TP=True Positive, TN=True Negative, FP= False Positive, FN= False Negative. These terms are validation metrics used to verify the quality of a segmented image. In a scenario where you want to compare a segmented image with ground truth, taking the image of truth as a comparison basis can assume that the close planes are pixel "white" and "black" pixels are true. The terms which have mentioned is:
True positive (TP): unhealthy people correctly identified as unhealthy (shown in fig-9) False Positives (FP): healthy people incorrectly identified as unhealthy (shown in fig-15) True negative (TN): healthy people correctly identified as healthy (shown in fig-13) False Negatives (FN): unhealthy people incorrectly identified as healthy (shown in fig-11)
In general, Positive = analyzed and negative = discarded. Therefore:
1) True positive = correctly analysed
2) False positive = incorrectly analysed
3) True negative = correctly discarded
4) False negative = incorrectly discarded
Using these constraints the sensitivity, specificity and accuracy is calculated and show.
Sensitivity = TP/ (TP+FN) * 100 Specificty = TN/ (TN+FP) *100
Accuracy = (TP+TN)/ (TP+TN+FN+FP) * 100
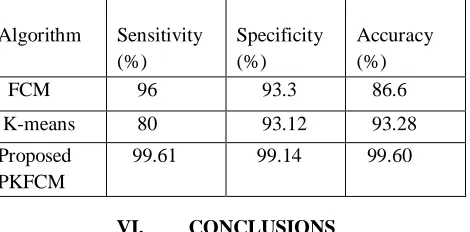
[image:11.612.193.428.359.475.2]Once more, the time required for seeing every tumor picture is 40-50sec, in the Matlab2015b with Core2duo processor. Table -1: Comparison of existing methods & proposed PKFCM
Algorithm Sensitivity
(%)
Specificity (%)
Accuracy (%)
FCM 96 93.3 86.6
K-means 80 93.12 93.28
Proposed PKFCM
99.61 99.14 99.60
VI. CONCLUSIONS
In this project, we proposed a new approach, that is, based on the modified model K-means and Fuzzy C-means algorithm. It is used to eliminate the limitation of the K-means algorithm and FCM for a conventional MRI conventional brain tumor image. The model is selected based on the convolution of the gray level intensity in a small portion of the brain image and the brain tumor. The algorithm is K-means initial voltage through an appropriate selection of the segmentation model. Current adhesion is obtained by measuring the distance from the center of gravity to the groups until it reaches its maximum. Based on the cluster membership up to date and automatically selected, acute segmented image with modified FCM tumor technique is obtained. The segmented tumor is shown as red marked with its detected position. The yield is analyzed by neural networks, which shows greater precision and fewer errors. The precision, sensitivity and specificity of the show that is better than the traditional methods. Although less sensitive to noise, but for some images where the difference in gray level intensity is very small cause problems to select the perfect model.
VII. ACKNOWLEDGMENT
I am very thankful to Assistant Prof. Naveen Kumar G.N for guiding and supporting me in preparing this paper.
REFERENCES
[1] N. Noreen, K. Hayat, and S. A.Madani, “MRI Segmentation through wavelets and Fuzzy C_Means,”World Applied Sciences Journal 13(Special Issue of Applied Math): pp.34-39,2011.
[2] D. L. Pham, C. Xu, and J. L. Prince, “Current Methods in Medical Image Segmentation,” Annual review on Biomedical Engineering, vol.2, pp.315-337, 2000.
[3] A. R. Robb, Biomedical Imaging, Visualization, and Analysis. New York: Wiley, 2000.
[5] K. V. Leemput, F. Maes, D. Vandermeulen, and P. Suetens, “Automated model-based tissue classification of MR images of the brain,” IEEETransaction Medical Imaging, vol. 18, no. 10, pp. 897–908, Oct. 1999.
[6] W. Narkbuakaew, H. Nagahashi, K. Aoki, and Y. Kubota, “Integration of Modified K-Means Clustering and Morphological Operations for Multi-Organ Segmentation in CT Liver-Images,” Recent Advances inBiomedical & Chemical Engineering and Materials Science, pp.34- 39,March.2014.
[7] (2015) PE- Brain tumour website. [Online]. Available: http:// www.mayfieldclinic.com /
[8] Rasel Ahmmed,Md. Foisal Hossain “Tumor detection in brain MRI image using template based K-means and Fuzzy C-mean clustering algorithm”2016 International Conference on Computer Communication and Informatics (ICCCI -2016), Jan. 07 – 09, 2016, Coimbatore, INDIA
[9] S. C. Huang, F. C. Cheng and Y. S. Chiu, “Efficient Contrast Enhancement using Adaptive Gamma Correction with Weighting Distribution,” IEEE Transactions on Image Processing, Vol. 22, No. 3, pp. 1032-1041, March 2013.