Human Resource Development for IT and
Technology Adoption in the Industrial Sector
Fadzilah Siraj
University Utara Malaysia School of computing College of Arts & science
Md. Rajib Hasan
University Utara Malaysia School of computing College of Arts & science
Juhary Ali
University Utara Malaysia School of business College of Business
ABSTRACT
This paper is based on a research study to assess the development of the human resources based on the application of information technology in the industrial sector in Malaysia. This is a field study on the form of a survey research using a random sample of organizations representing the industrial and government sectors in Malaysia. A total of 1000 firms was selected in which questionnaires were sent, and 120 usable returns were received representing a 12% response. The distribution as the sample suggests a high concentration within the ICT industry and high-technology industry in the central and northern regions of Malaysia. Results of the study showed a moderate number of employees using IT were present in the organizations with more than half of the sample reported having employees with IT skills. There is also a low degree of technology and IT adoption among the sample with only half invested in technology and/or IT. This can be seen as a motivating factor towards encouraging more organizations to adopt IT and changing the way employees perform their business activities moving towards achieving the long-term competitiveness in the knowledge economy.
Keywords
Knowledge Worker, IT Adoption, IT Skill, IT Training, High Technology.
1.
INTRODUCTION
Malaysia is fast moving towards the knowledge economy underpinned by innovation and enterprise. This can be further expedited by the industries known to encourage innovation, promote competitiveness, and create employment and wealth across society [1]. Industries can play an important role in leveraging the nation’s economy by having a workforce that is highly skilled, trainable in new technology, and knowledgeable. They have the capability to be more innovative and can provide greater flexibility to the economy and encourage the creation of new jobs. They also encourage healthy competition both within the domestic market and internationally. It is common now with globalization those industries are going international with the help of IT, especially the Internet, to enable e-commerce and remain competitive [2].
A knowledge-based economy would require a workforce that is highly skillful, learned, possess a positive motivation and attitude, innovative and possess an entrepreneurial skills to grab the many opportunities that are widely available as a result of globalization and the proliferation of advanced technology. To achieve this, greater emphasis should be given in enhancing the workforce equipped with academic
credentials, technical requirements and the right skill set that can increase the work efficiency with positive attitude and creativity. These so-called knowledge workers (K-Workers) are vital ingredients for the nation to transform itself into a knowledge-based economy.
Reports on the current scenario of human resource development of SMIs in Malaysia have not been encouraging. SMIs in Malaysia are still operating in the traditional way with mostly family-based[3], using traditional and obsolete technology to produce cheap and low quality products with limited market penetration. Among the problems faced by SMIs include lack of able personnel to negotiate funding’s [4], lack of expertise in using and managing technology [5]; [6], lack of skilled workers [7], low level of IT skills and knowledge [8]; [9]; [10], and poor user attitude towards technology[11].
Previous studies have shown a close relationship between the individuals and the organizations they belong. This is linked with the characteristics of a human resources as contributing to the organizational development, which include flexibility and adaptability [12]; [13]; [13]; [14]; increase in individual competency [15]; [16]; [17]; [18]; [19] and; Individual workability [20]; [21]; [22], and High Achievement [23]. In today’s era of k-economy, human-resource development is focused on the capability of individuals and the organization, they support to adapt themselves with the latest information and communication technology (ICT). This is to ensure that the organization is able to compete globally in accordance with the current demands. This paper attempts to make an assessment of the development of a human resources based on the application of ICT and other related technology in Malaysia.
2.
IT ADOPTION IN THE INDUSTRY
making. This many benefits encouraged more and more firms in the industrial sector to adopt IT.
However, studies have also shown that the industrial sector, constituting more than 90% small and medium industries [1], generally have end-users with the low level of computer literacy and received elementary formal education. In addition, these industries also lacked qualified IT personnel, no specific policy and planning on IT adoption, lack of formal IS methodology, lack of end-user participation and minimal technology diffusion throughout the firm [27]. It is also the intention of this paper to assess the level of IT adoption of the Malaysian industry as well as the public sector in terms of the end-users, IT personnel, education and training, and the types of technology and IT products used as a form comparison.
3.
METHODOLOGY
The study was based on a field study in the form of a survey research using a cross-sectional approach where a sample of firms representing the production and manufacturing firms listed in the Federation of Malaysian Manufacturers [28]; [29] and government and government linked companies were sought. Sampling technique in the form of proportionate random sampling was used taking into account the different sample frame sizes according to the industries [30]. A total of 1000 firms was selected in which questionnaires were sent, and 120 returns were received. Out of this 46 firms were categorized as small have less than 50 employees, 29 firms were medium sized having in between 50 to 199 employees, and 45 were large with 200 and more employees.
Questionnaires with the self-address stamped envelopes were sent to the selected firms based on the FMM list together with a cover letter describing the aims for the study and instructions on filling the questionnaire. A supporting letter from the Ministry of Science Technology and Environment (MOSTE) was also included to support the study and to encourage better response. The 12% rate of return was considered small but represents the typical response reported by other studies involving SMIs which was between 10% to 20% [31]; [32];[33] ; [34].
Data entry was carried out using a statistical package within which a database of the returns was created. Data analysis was then carried out using descriptive statistics on the firms’ demography, manpower requirements, technology and IT adoption, and training.
[image:2.595.308.550.93.270.2]4.
ANALYSIS OF FINDINGS
[image:2.595.310.547.377.625.2]Table 1 shows the distribution of respondents according to the States in Malaysia. As it can be seen, all States are included within the exception of Sabah, and only one respondent each coming from the States of Sarawak and Negeri Sembilan. The highest percentage of respondents to the sample came from the States of Penang and Selangor each with 19.2 percent of the total sample size of 120. Next came Kedah with 15 percent and this is followed by Perak (13.3 percent). Smaller samples came from the State of Johore (7.5 percent), Federal Territory Kuala Lumpur (5.8 percent), States of Melaka (5 percent), Kelantan (4.2 percent), Trengganu (4.2 percent), and Pahang and Perlis each at 2.5 percent.
Table 1. Distribution of sample respondents according to States
No. State Frequency Percent
1. Penang 23 19.2
2. Selangor 23 19.2
3. Kedah 18 15.0
4. Perak 16 13.3
5. Johore 9 7.5
6. Kuala Lumpur 7 5.8
7. Melaka 6 5.0
8. Kelantan 5 4.2
9. Terengganu 5 4.2
10. Pahang 3 2.5
11. Perlis 3 2.5
12. Sarawak 1 0.8
13. Negeri Sembilan 1 0.8
Total 120 100 %
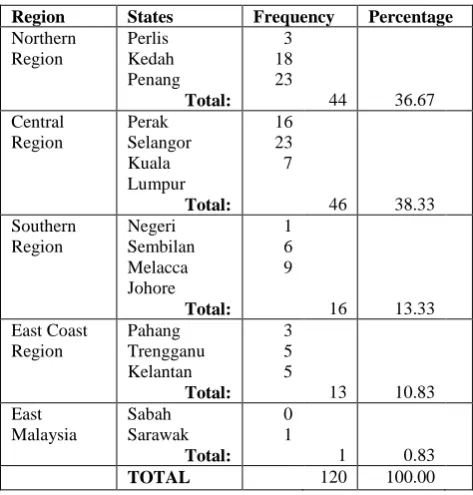
[image:2.595.309.549.377.625.2]Distribution of the sample by region shows that the majority of the sample respondents came from the Central Region with 38.33 percent. This is followed closely by the Northern Region with 36.67 percent. The Southern Region and East Coast are less represented with each account for 13.33 percent and 10.83 percent, respectively. Table 2 shows the distribution of the sample respondents by region.
Table 2. Distribution of sample by region
Region States Frequency Percentage
Northern Region
Perlis Kedah Penang
Total:
3 18 23
44 36.67 Central
Region
Perak Selangor Kuala Lumpur
Total:
16 23 7
46 38.33 Southern
Region
Negeri Sembilan Melacca Johore
Total:
1 6 9
16 13.33 East Coast
Region
Pahang Trengganu Kelantan
Total:
3 5 5
13 10.83 East
Malaysia
Sabah Sarawak
Total:
0 1
1 0.83
TOTAL 120 100.00
The survey also examined the number of MSC status companies in order to have a feel of companies involved in the Multimedia Super Corridor initiative driven by the government of Malaysia. However, only a small percentage (10 percent) of the sample has indicated that their companies attained the MSC status. A closer look at these companies shows that they are all located in Cyberjaya, Selangor. Figure 1 shows the percentage distribution of MSC and non-MSC status companies in the sample. Note that 100 companies out of the 120 sample size have responded to this question.
Figure 1. Distribution of MSC and non-MSC status companies
In terms of ownership of companies, majority of the companies in the sample are Malaysian and locally owned accounting for 58.3 percent. Foreign owned companies account for 22.5 percent of the sample, leaving the remaining 19.2 percent from the government sector. It will be interesting to make comparisons on the human resource development for both technology and ICT usage between these three major sectors as presented later in this report.
General background of the responding companies participated in the survey will not be complete without examining the size of the companies in terms of the number of employees. Table 3 shows the distribution of the companies in the sample by category, that is, small, medium and large. The table shows that small companies in the survey with employee size of less than 50 accounts for 38.3 percent of the sample. Medium sized companies with 50 to 199 employees made up 24.2 percent of the sample. Large companies of 200 and above employees constitute the remaining sample amounting to 37.5 percent. From the sample it can be seen that majority of the respondents belonged to the small and medium enterprises (SMEs) accounting for 62.5 percent of the sample.
Table 3. Category of company by size of employee
Information on the respondent representing the company forms part of the general background information. The study explicitly requested those who are responsible for the technology or ICT to fill up the questionnaire. Figure 2 shows the distribution of the respondent’s position in the company. About 38 percent of the respondents indicated they are in the managerial position either as a general manager, operations
manager, sections manager or productions manager. Majority of the respondents (62.2 percent) however did not indicate their position in the questionnaire.
Figure 2.Position of Respondent in the Company
[image:3.595.58.273.182.326.2]The next section of the survey analyzes availability of skilled workers for the technology and/or ICT adoption in the company.
Figure 3.Availability of Skilled Workers in technology
and ICT adoption
As can be seen from Figure 3, more than half of the sample indicated having skilled workers in both technology and ICT with both categories have about the same proportion. Though this may look encouraging, quite a significant proportion (46 percent) of respondents indicated they did not have adequate skilled workers in both technology and ICT. Considering the majority of the sample respondents came from the industrial areas, this finding is quite disturbing as significant number of organizations within the industry are still finding it difficult to fill up positions that requires skills and expertise. A closer look at the distribution of skilled workers shows that for the technology industry, slightly above 30 percent have 10 or less skilled workers. Twenty-three percent of the technology sample indicated having more than 50 skilled workers, and about 45 percent have skilled workers in the range 10 to 50. For the ICT category, 25.5 percent have less than 10 skilled IT workers, and the same proportion indicated having more than 50 skilled workers. The remaining half of the sample of ICT category has between 10 to 50 skilled workers. Figure 4 shows the distribution of the technology and ICT samples according to the range of skilled workers available.
Category Size of
Employee
Frequency Percent
Small 49 and
below
46 38.3
Medium 50-199 29 24.2
Large 200 and
above
45 37.5
[image:3.595.320.540.330.458.2]Figure 4. Technology and ICT industry with enough skilled workers
[image:4.595.315.542.134.264.2]Figure 5 shows the distribution of management workforce according to the different management levels. The questionnaire also examined the current workforce based on the 2004 figure and the anticipated demands for each management levels in the next 5 years from 2005 to 2010. The result shows that majority of the companies have 25 or less employees in all the management level categories, ranging from as low as 64.2 percent at the operations level to 75.8 percent at the middle level management and increased to 92.6 percent at the top management level in the current situation. This trend seems to be consistent even for the next 5 years as the figures indicated, though there is a slight decrease in the demand for management workforce across all three management levels. However the decrease is only slight particularly at the top level management. This may suggest that the respondents believe that there will not be any increase in the demand for workforce in the next 5 years in companies with 25 or less employees across all management levels. However, for bigger sized companies, the trend appears to be the opposite, where there seems to be an increase in management workforce demand for the next 5 years across all 3 management levels with the operations level showing the highest increase as shown in Figure 5. This may indicate larger companies are expected to have more job openings for all management categories particularly at the operations level in the technology and ICT industry in Malaysia within the next 5 years.
Figure 5. Distribution of workforce by management category
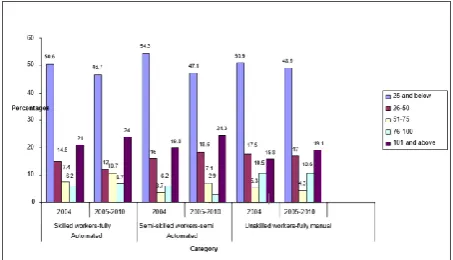
Workforce trend in the technology industry shows equally distributed proportion of workforces across all 3 categories of skilled workers, semi-skilled workers and unskilled workers for companies with 25 or less employees. It is interesting to note that about half of the sample has 25 or less employees across all 3 categories. Examining the future trends, it can be observed from Figure 6 that there is a slight decrease in the demand for technology workforce in the next 5 years for the
25 and below employee category across all 3 skilled, semi-skilled and unsemi-skilled worker categories. However, the biggest decrease is in the semi-skilled worker category with almost 7 percent drop. For unskilled workers, there is the least drop in demand with only 2 percent decrease as shown in Figure 7.
Figure 6. Distribution of workforce by technology
Again, as in the previous arguments, larger companies tend to have increased demand for skilled, semi-skilled and unskilled workers in the next 5 years as indicated by Figure 6. This may again suggest that while smaller companies tend to have less demand for technology workforce in the future, larger companies on the other hand tend to have more demand for technology workforce within the next 5 years. This is particularly true in the semi-skilled category where the demand appears to be the greatest.
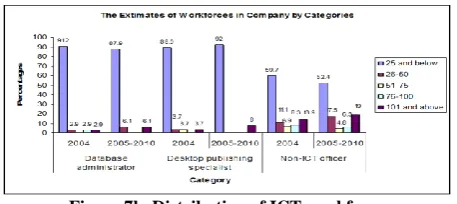
Figures 7a and 7b show the distribution of workforce and future workforce demand in the ICT industry. As can be seen, the highest proportion of sample came from the computer support specialist category for the 25 and below employee group accounting for 92.2 percent. Second is database administrator with 91.2 percent. Next is the systems analyst category with 89.2 percent of the 25 and below employee sample. This may indicate the current demand for ICT workforce is in the ICT support category, followed by the database administrator, systems analyst or application developer category and desktop publishing. The demand for hardware or computer engineering category is comparatively lower at 79.1 percent of the 25 and below employee sample. However, in the next 5 years, the demand for computer engineers is predicted to increase by 2 percent as suggested by the trend in Figure 7a. This is also true for desktop publishing specialists which are predicted to increase even more at 3 percent in the next 5 years as can be observed in Figure 7b. Computer support specialists, systems analysts, and database administrators are expected to see a drop in demand for the next 5 years with between 3 to 4 percent decrease.
Figure 7a. Distribution of ICT workforce 30.8
25.5
7.7 9.8
11.5
7.8
17.3 19.6
9.6 11.8
23.1 25.5
0 5 10 15 20 25 30 35
Tehcnolgy ICT
P
e
rc
e
n
ta
g
e
s
[image:4.595.59.276.549.673.2]Figure 7b. Distribution of ICT workforce
[image:5.595.324.535.258.385.2]Demand for non-ICT officer who uses computer in their daily operation shows quite a significant proportion of the sample. For companies with 25 and below employees, 59.7 percent of the sample indicated employing non-ICT officers. This shows that almost 60 percent of the sample employs non-ICT officers as knowledge workers, which can be considered as a significant development towards becoming a knowledge society. However, in the next 5 years the number of non-ICT workers is expected to drop by 7 percent for companies who employ 25 or less employees. A closer look at the data shows an upward trend in the demand for non-ICT workers in the larger-sized companies. For instance in companies employing more than 100 employees, a 5.1 percent increase in the number of non-ICT workers is expected in the next 5 years. Similarly for the 26 to 50 employee category, a 6.4 percent increase has been predicted. This may suggest that larger companies requires more non-ICT workers in the future or the demand for k-workers is expected to increase for larger companies as opposed to small companies.
Figure 8. Comparison of level of ICT adoption
Figure 8 shows the comparisons on the level of ICT adoption in the administration, operation, and software usage. With the exception of software usage, the level of ICT adoption appears to be higher in the administration compared to the operations. In the administration, an average of 55.6 applications is used as semi-automated and only 31 applications are fully automated. In the operations, an average of 49.4 applications is used as semi-automated and only 28.2 applications are fully-automated. The results indicate semi-automated applications are dominant in both administration and operations functions. It is interesting to note that there is still manual usage of traditional word processing (usage of typewriter), manual spreadsheet, project planning, and human resource planning though on the average only 8.43 applications are manually done. It is understandable that software usage in fully-automated applications is the highest with an average of 61.9 percent. The sample respondents also indicated that a number of applications are in their planning with software usage top the list at 4.86 applications. The results also show more operations applications are in the pipeline as compared to the applications supporting the administration function.
Figure 9 shows the usage of e-business applications among the respondents. Three categories of e-business were captured. Business-to-business (B2B) is electronic transactions between companies, whereas business-to-customer (B2C) is the availability of electronic facilities provided by a company to its customers. Business-to-government (B2G) is part of the e-Business-to-government initiative that provides online access for companies and individuals to access government services. The results show that only a small percentage of the sample has never experience e-business, ranging from 20 percent for B2C, to 21.7 percent for B2B and 25.8 percent for B2G. In other words, the results indicate up to 80 percent of the sample has the experience of participating in e-business and among the highest e-business participation is in the B2C category. This is followed closely by the B2B category. The B2G category however is the least though it is at 74.2 percent of the sample.
Figure 9: Usage of E-Business Applications
Among the most frequently used e-business is the B2C category, and the least used is the B2G category. There is still a wide opportunity to expand the e-government initiatives, particularly at the state, local government and down to the district and housing or village level. Only with such initiatives implemented can Malaysia fully realize the potential to achieve knowledge based economy with a knowledge base society.
On technology adoption, intermediate technology appears to be dominant in the fully and semi-automated categories. This may suggest that solutions for technology adoption are currently most popular in the intermediate technology which could be more economical than integrated technology but have the power and capability that goes beyond stand-alone technology. Intermediate technology is also dominant in the fully manual category. For future planning however, the trend indicates a shift to the integrated technology. This may suggests the direction the industry should take towards integrated technology as integrated solutions become more and more feasible and economical as organizations enter the era of globalization and become more competitive.
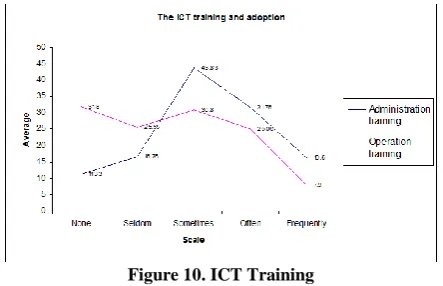
[image:5.595.61.272.396.493.2]Figure 10. ICT Training
Figure 11 shows the frequency of technology training according to the three technology categories Stand-alone, Intermediate and Integrated technologies. The graph indicates a worrying trend in technology training, where in all the three technology categories a high proportion of the sample indicates having none or very little training in the technology they adopted. The result shows a decrease in the average technology training in all three categories as the frequency of training increases. Well competent and skillful technology adopters comes with adequate training and firms must be prepared to allocate appropriate training budget.
Figure 11. Technology training
[image:6.595.53.281.341.459.2]The last part of the questionnaire examined the productivity of the respondent companies based on whether the companies are production based or service based companies, or both. Figure 12 shows the result of the productivity trends from low, moderate to high productivity as indicated by the respondents. The result indicates that service based companies have better productivity performance than production based companies. The graph indicates productivity performance for service based industry increases from double in the low to moderate productivity to almost triple at the high productivity category. This result may suggest that more focus should be given to the service industry in order to help accelerate the Malaysian economy, particularly in our efforts to become a fully developed nation in the not too distant future
Figure 12. Measurement of productivity
5.
DISCUSSION AND CONCLUSION
The development of human resource is to ensure contribution to sustainable productivity for continued economic growth. In line with that, this study provides an assessment of the development of human resource based on the application of information technology in the industrial sector, specifically in the small-medium manufacturing enterprises in Malaysia. The study suggested that the awareness by the industrial sector in adopting ICT and other advanced technology is important in order to generate higher value-added economy.
This study has shown a large vacuum exists for well-educated skilled manpower in the areas of IT and other high technology in the SMEs’ industrial sector. The findings may not be favorable in today’s era of k-economy where the need for progress in high technology development and IT is in high demand in order to facilitate globalization. The findings reveal a low level of IT manpower and a low technology adoption among the SMEs. The requirements for skilled human resource in ICT and other technologies skilled level have shown high percentages of fulfillment of manpower requirements (see figure 2). The k-workers, i.e employees with technology and ICT skills, adopted IT products in carrying out their job functions. The percentage of K-Workers with technology skilled was found higher when compared with ICT skilled (see figure 3).
The number of k-workforce at the managerial level at top-level management found fulfilled the requirement. However greater job demands are expected in the future for all three managerial levels and an anticipation of high staff turnover as other companies expanded their operations as a result of recent economic recovery (see figure 4, 5, 6).
The results of the study on technological skill suggest the current need for all categories of skilled and unskilled workers are almost being fulfilled. However, the future may see an increase in the demand for skilled and unskilled workers (see figure 7, 8 and 9).
In addition, based on the results from the study it is suggested that the relevant training programs should be given to the relevant employees and firms should also be encouraged to support re-training to address the issues of trainees not being adequately trained. In addition, firms should consider introducing incentives to encourage more ICT literate employees and likewise, the government may consider giving subsidy in terms of tax incentives on training programs to encourage SMEs to invest in training.
With the current capability of technology and ICT, further research and development works should be carried out to determine the best usage of technology and ICT to help facilitate training, either through computer-assisted learning and instruction, e-learning and/or using virtual reality and other modeling and prototype development
[image:6.595.53.281.642.756.2]6.
REFERENCES
[1] DTI, “Competitiveness UK: Speech by the Right Hon. Margaret Beckett MP, President of the Board of Trade,”
1997. [Online]. Available:
http://www.dti.gov.uk/Minspeech/ compspch.html. [Accessed: 11-Aug-2013].
[2] P. Westhead, M. Wright, and D. Ucbasaran, “International market selection strategies selected by ‘micro’ and ‘small’ firms,” Int. J. Manag. Sci., vol. 30, no. 1, pp. 51–68, 2002.
[3] S. Hodge, “The SME/SMIs,” IT Annu. Roundup, vol. 1, no. 1, pp. 11–18, 2001.
[4] P. . Chee, A study of small entrepreneurial development program in Malaysia. Kuala Lumpur, 1st ed. Sintok: UM Press, 1979.
[5] L. Raymond, “End-user computing in the small business context Raymond, L. (1990). End-user computing in the small business context: Foundations and directions for research, Data Base, 20(4): 20-26.,” Annu. Meet. NCA 93rd Annu. Conv., vol. 20, no. 4, pp. 20–26, 1990. [6] R. T. Anderson, Profit in small firms. United Kingdom:
avebury aldershot, 1987.
[7] A. Moha Asri and B. Mohd Isa, Small and medium enterprise in Asia Pacific: Prospects in the New Millenium. New York: Nova Science Publisher, 2000. [8] S. M. Hussain, “Cultural Constraints In Leading
Malaysian SMEs To Global Markets,” 2ND Natl. Conf. Entrep. SMALL Bus., vol. 40599, no. 1, pp. 1–19, 2012. [9] Z. Dahalin, “IN SMALL BUSINESS,” Int. Conf. Glob.
Bus. Econ. Dev., vol. 12, no. 2, pp. 41–52, 2005. [10] S. . Hussein and M. . Zulkhairi, “Firm competitiveness
and the challenges of globalization: Selected case studies from the IT industry in Malaysia,” in International Conference on Global Business and Economics Development, 2004.
[11] J. . Lees and D. D. Lees, “Realities of small business information system implementation,” J. Syst. Manag., vol. 38, no. 1, pp. 6–13, 1987.
[12] B. M. Goldberg and C. Jules, “Organization Development and Human Resources Why the Uneasy Alliance ?,” vol. 42, no. 4, pp. 36–39, 2010.
[13] L. M. Shore, B. G. Chung-Herrera, M. a. Dean, K. H. Ehrhart, D. I. Jung, A. E. Randel, and G. Singh, “Diversity in organizations: Where are we now and where are we going?,” Hum. Resour. Manag. Rev., vol. 19, no. 2, pp. 117–133, Jun. 2009.
[14] B. M. Minahan, “OD and HR Do We Want the Lady or the Tiger ?,” OD HR, pp. 17–22, 2004.
[15] D. Mcguire, “COMPETENCIES & WORKPLACE LEARNING: THE RHETORIC & THE REALITY,” Work. Learn., vol. 13, no. 4, pp. 144–164, 2001. [16] P. Cappelli and A. Crocker-Hefter, “Distinctive Human
Resources are a firm’s core competencies,” Organ. Dyn., vol. 28, no. 2, pp. 7–21, 1996.
[17] K. Gorsline, “A competency profile for human resources, no more shoemakers children,” Hum. Resour. Manage., vol. 35, no. 1, pp. 53 – 66, 1996.
[18] L. Holms, “HRM and the irresistible rise of the discourse of competence,” Pers. Rev., vol. 24, no. 4, pp. 16–28, 1995.
[19] D. Lei and M. A. Hitt, “Dynamic core competencies through meta learning and strategic context,” J. Manage., vol. 22, no. 4, pp. 549–561, 1996.
[20] M. B. Arthur and D. M. Rousseau, “The boundaryless career as a new employment principle,” in in The Bounderless Career, M. G. Arthur and D. M. Rousseau, Eds. New York: Oxford University Press, 1996.
[21] T. Bates and S. Bloch, “Employability: How to get your career on the right track.” London, 1965.
[22] B. R. Ellig, “Employment and employability: Foundation of the new social contract,” Hum. Resour. Manag., vol. 37, pp. 173–175, 1998.
[23] J. Sandberg, “Understanding human competence at work: an interpretive approach,” Acad. Manag. J., vol. 43, no. 1, pp. 9–17, 2000.
[24] A. Parish and J. Richardson, “THE UK ELECTRONICS INDUSTRY E-COMMERCE INITIATIVE,” 2002.
[25] oecd, “Small businesses, job creation and growth: facts, obstacles and best practices,” 2000, 2000. [Online]. Available: www.oecd.org/industry/smes/2090740.pdf.
[26] R. Hyötyläinen, Implementation of information systems as an organisational construction, vol. 28, no. 1. JULKAISIJA – UTGIVARE, 2013, pp. 1–178.
[27] A. R. Montazemi, “An analysis of information technology assessment and adoption in small business environment,” Inf. Syst. Oper. Res., vol. 25, no. 4, pp. 321–337, 1987.
[28] H. Abdullah, “DESIRABILITY AND EXISTENCE OF HRD STRUCTURE IN MALAYSIAN,” J. Int. Soc. Res., vol. 2, no. 8, pp. 1–10, 2009.
[29] FMM, “Federation of Malaysian Manufacturers,” 2002.
[30] N. Kerlinger, Foundations of Behavioral Research, 3rd ed. New York, 1986.
[31] P. Palvia, D. B. J. Means, and W. . Jackson, “Determinants of computing in very small businesses,” Determ. Comput. very small businesse, vol. 17, no. 167– 174, 1994.
[32] K. Lai, B. Phung, and T. Blackburn, “Application of data mining on partial discharge part I: predictive modelling classification,” IEEE Trans. Dielectr. Electr. Insul., vol. 17, no. 3, pp. 846–854, Jun. 2010.
[33] Lai, “A survey of rural small business computer use: Success factors and decision support,” Inf. Manag., vol. 26, no. 1, pp. 297–304, 1994.