Towards a Self-service Data Analytics Framework
Mohamed M Zaghloul
Computer and SystemsDepartment, Faculty of Engineering, Mansoura University,
Egypt
Amr Ali-Eldin
Computer and SystemsDepartment, Faculty of Engineering, Mansoura University,
Egypt
Mofreh Salem
Computer and SystemsDepartment, Faculty of Engineering, Mansoura University,
Egypt
ABSTRACT
The need
for Self-service data analytics is inevitable as it supports the business in making the right decisions. In
this paper, we argue that self-service analytics frameworks should be based on a process-centric approach and
visualized self-service components in order to meet current business demands. Further, we
enunciate the need for mainly three components: Map component, Process Flow component
and a Control Model component. Furthermore, we explain the architecture of a self-service
analytics framework based on these components. Some parts of the proposed framework were deployed to
different sites and are discussed in detail in this paper. The obtained results showed a clear
enhancement of data warehouse operation spent from the IT departments' side compared to
the traditional BI architecture.General Terms
Self Service Business Intelligence, Self Service Data Analytics .
Keywords
Extraction, Transformation, and Loading (ETL), Business Intelligence (BI), Process-centric collaboration, Self-service data analytic, Control model Operational Data Store (ODS)
1.
INTRODUCTION
Business Intelligence provides corporate with analytical reports that transform data into information enabling business users to take the right decisions at the right time [1], [2]. This model provides corporate with their competitive edge and allows them to generate new business opportunities. However as per Gartner reports [3], the current BI environment is not an enabler for such ambitions and is still under the required level in a way that does not cope with the ever-evolving business changes [3].
As per Gartner, Self-service BI is defined as business users being able to generate the reports they need throughout their daily work cycle without seeking the help of their IT department [3], [4]. This means the IT should be separated from the business, which is very useful as it will lead to quicker access to data and the ability to transform it into information faster; however, it is not that simple [3], [4].
integrate more data sources to respond to new business requirements, and much more [3], [4].
This is actually what this paper is trying to address. The researchers are suggesting a new Self-service business analytic framework able to eliminate the difficulties business users will face, and consequently enable Self-service business analytics to become a useful approach corporate can start applying successfully.
This paper organized into the following sections; Section 1 presents a short Introduction. Section 2 discusses the research challenges and describes traditional architecture challenges. Research objectives are described in section 3. The traditional BI architecture approach is presented in section 4 while the proposed Architecture is presented in section 5. Experimental work of the proposed framework is described in section 6 followed by an analysis of the results and a discussion in section 7. Section 8 presents related works and afterwards the paper is concluded in section 9 .Section 10 References .Section 11 Appendix.
2.
RESEARCH CHALLENGES
So what are the challenges that meet business users while using the traditional BI software and that the suggested framework will be able to eliminate.
2.1
Changing Business Demands
Business Intelligence software is accused by not being able to cope with the business analytics requirements that continuously change every now and then. As business grows, the data traffic becomes higher in the corporate transactional systems, and thus new analysis requirements start to arise. The analytics requirements that BI software is actually covering compared to the real analytics needs become lesser every day.
This is due to the fact that BI software is dealing with an underlying set of data marts responsible for generating these business analytics. Business users are not able to extend the existing data marts to include new data needed, and thus generate the new required analytics. To do so, they have to refer to their IT department, and here starts the latency and the cost increase.
2.3
Multiple Software Applications
To produce the different analytics needed by the business, corporate use separate BI software applications that are not gathered in one framework and consequently do not provide an intuitive interface for layman business users. One of the most difficult challenges is integrating advanced analytics using data mining algorithms among others within the same framework. Advanced analytics is a difficult task as it requires complex methodologies, including
problem definition, data preparation, model selection, and model evaluation [4].2.4
Big Data Challenges
Big Data challenge; There is a tremendous increase in the volumes, velocity and vector of data. Big data is being analyzed and stored in data warehouses and experimental areas. This data is used for complex advanced, embedded and streaming analytics. There are now very interesting sets of data in BI, which is certainly different from the traditional, more strategic or tactical forms of BI. This doesn’t diminish the need for traditional BI; it just means there is a need to expand the BI architectures to embrace these new areas [4], [5].
Note that there might be other challenges, however, we will consider the above as the most considered challenges that will be addressed by the suggested framework. However, in this paper, detailed experimental work will show how the proposed conceptual framework will meet the research challenges.
3.
RESEARCH OBJECTIVES - HOW TO
MEET RESEARCH CHALLENGES?
The objective of the proposed framework is to enable business users meet the challenges of the traditional BI software by responding to the new analytics requirements of the business in an easy manner. To do so, the proposed framework depends on a process-centric architecture in addition to a visual interface that delivers business analytics quickly and effectively responding to the changing and imprecisely articulated needs of the BI and IT users.
To understand how the framework will achieve this, the process-centric architecture will be highlighted as this is the core idea and foundation of the suggested framework.
3.1
Process-centric Architecture
The idea of the proposed framework is to gather all the software applications, needed to generate the analytics, and encapsulate them to act as components functioning within one process flow. Each software is transformed into a group of functions (Called Component) inside this process flow. Once the component is done, the next group of functions (from another software) are initiated to start working based on specific business rules. The integration touch points needed between the different groups of functions as well as the changes needed to be done on the business logic and rules will be implemented on the process-flow level. The process flow
will also allow embedding complex data mining algorithms required to generate advanced analytics like forecasting for example.
The proposed framework will include the same layers as the ones currently used in the traditional BI architecture but with different functions. The framework is also designed to be technology-independent, which provides more flexibility for customers to pick up the software they mostly like to be embedded within the framework. Customers who already have BI software are not obliged to purchase new licenses or research new products to check if they fulfill their needs. The process-centric architecture, materialized by the process flow idea, represents the suggested framework backend responsible for doing the work necessary to eventually generate the needed analytics. This is the main idea of the framework, a more detailed explanation of each of its components will be provided in the proposed Framework .
3.2
What is a Operation Manager
In order to make the life of the framework users easier, an intuitive graphical user interface is developed to represent the front end of the suggested framework. An abstract layer reflects all the framework functionalities through the interface.
Operation Manager is provided for both the business users who need to generate the analytics and the technical users responsible for monitoring the backend activities implemented by the framework.
4.
TRADITIONAL BI – HOW DID IT
WORK?
4.1
Traditional BI Layers
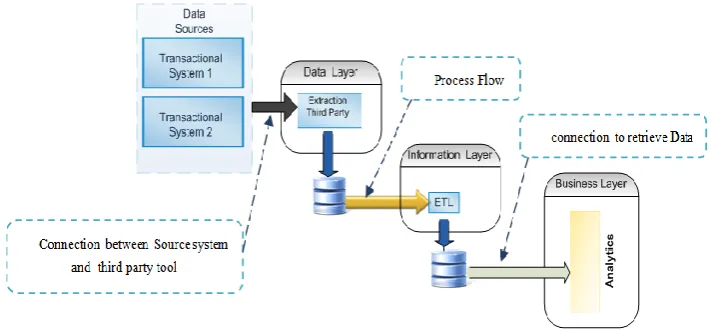
The traditional BI architecture is composed of three layers:
Data Layer
Information Layer
Business Layer
4.2
Data Layer
The function of this layer is to extract data from multiple systems scattered across the organization.
4.3
Information Layer
The Information Layer contains data marts that offer business users the option to generate the business analytics they need. Data marts provide aggregations, summaries and hierarchies of the data extracted by the first type of software discussed in the previous section. Here comes the use of a second software type which is the ETL needed to perform the required data transformations.
4.4
Business Layer
Figure 1: Traditional BI Architecture
4.5
How Challenges are not met?
Now let us discuss, for each of the previous layers of the traditional BI architecture, how the challenges are not met.
On the Data Layer level, a third-party tool is used to extract data which results in additional operational costs. Moreover, the data extraction layer must be fully accomplished before the ETL starts, which makes the process operations slower. [Multiple Software Applications challenge] and [High Operational Cost challenge].
On the Information Layer level, a monitoring tool is needed to manage the performance of the extraction and loading processes, and adjust the errors that occur. This incurs operational costs for the team responsible for monitoring the process and adjusting the errors. [High Operational Cost challenge].
On the Business Layer level, business users' evolved requirements might require to make changes in the data
marts which lead to a slower response in fulfilling the changing business analytics requirements. [Changing business demands challenge] An extra software is also needed to generate the advanced analytics like the data mining software, dashboards, and scorecard software [Multiple Software Applications challenge].
5.
THE PROPOSED ARCHITECTURE
The proposed conceptual framework shows how the Self-service data analytics framework will be built using a process-centric approach. The conceptual framework is composed of the three main layers of the traditional architecture: Data Layer, Information Layer, and Business Layer but with different components for each. Three main components will play the role of connecting these layers together (as shown in Figure 2): the Map Component, Process Flow and Control Component. In order to understand the architecture of the suggested framework, an explanation of the role of each of these components is provided in details.
Map
Source Database1
Data Layer Information Layer Business Layer
Control Model
Main Process Flow
Operation Manager
Process Flow Component
Map Process Flow
Component
Process Flow Component
[image:3.595.82.488.520.706.2]5.1
Proposed Architecture Process Centric
Components
5.1.1
Map Component
The Map component assumes the function of the data extraction, transformation, and loading (ETL). It starts from the Data Layer (Where data is being cleaned and standardized) and continues till the Business Layer (where data is being transformed according to specific aggregations and summaries to produce the required analytics). The idea of the map component is to encapsulate the function of data extraction (used as third-party tool in the traditional architecture), transformation, loading and embed them in the suggested process flow. The Map component starts functioning of the ODS phase : this is the phase where only needed data is extracted from the source systems and stored in an interim database, called ODS, to be ready for data cleansing and quality operations all done as Map components
5.1.2
Process Flow Component
The Process flow component is a component responsible for allowing the other components to function. It represents the main idea of the suggested architecture and is responsible for allowing the next function in the flow to start automatically once the previous function is done. The Process flow actually represents the backbone of the suggested architecture including all the business rules required to move from one function to the other.
5.1.3
Control Model
The Control model is responsible for managing and monitoring all the activities of the Map component and any other component that might be integrated within the suggested
framework, in the future, to execute any other functions. When integrating external components within the framework, a metadata about that component will require to be encapsulated in the Control component to enable to execute and manage the activities of all process flows and map components.
The Control model is the main player that contributes in decreasing the operational cost usually needed to operate and manage the BI architecture within the organization.
As all the functions of the framework are integrated on the process flow level as mentioned before, the Control enables the management and monitoring of all the activities executed, by the framework, in order to eventually generate the analytics required by the business users.
Any other external software that will be used like the ODS (responsible for dealing with the source systems from where data is extracted) and data mining algorithms (responsible for generating advanced analytics) in this case, will be integrated also on the process flow level. This is to enable the Control component to centralize the monitoring of each and every function executed by the suggested framework. This leads to a unified process automation of the whole process flow which results in less operational costs and an ease of use of the control model for non-expert users especially that this monitoring will be done through an intuitive user interface (To be discussed in the User Interfaces section).
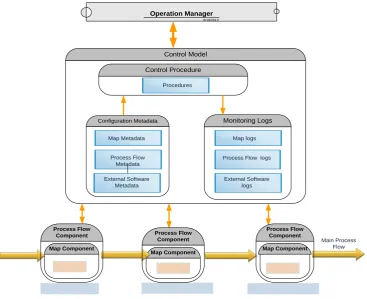
Figure 3 explains the Control model and its different functions.
Control Model
Configuration Metadata Monitoring Logs Control Procedure
Map Component
Map Component Map Component
Data Layer Information Layer Business Layer
ETL External
Software ETL
Map Metadata
Process Flow Metadata External Software
Metadata
Process Flow logs
External Software logs Map logs Procedures
9/19/2013
Operation Manager
Main Process Flow
Process Flow
Component Process Flow
Component
Process Flow Component
[image:4.595.113.481.429.728.2]The Control model consists of a number of procedures, configuration metadata, monitoring logs, internal and external integration points.
The procedures embed the logic needed to allow the process flow, map components to function in a sequential or parallel way. Procedures are also responsible for updating the monitoring logs with new changes that occur.
The configuration metadata include all metadata
definition related to map components , process flows, and other external software. Metadata is configurable and is designed to also include setup data.
The monitoring logs include togs to monitor map
components , process flow and external software functions.
The internal integration points include APIs to
integrate between the map components, process flows, data mining functions, the Control component and any other software to be integrated in the future.
The external integration points include APIs to
integrate the control component with the IT user and business user interfaces (to be discussed in the Visual Interfaces section).
The functions assumed by the Control model can be summarized in the following points:
Manage and monitor the process flow of each map
Provide metadata information required for each map and process flow
Schedule and monitor the map and processes components in order to eliminate an errors that might occur when running different software tools within the same flow
Load backdated data by changing some configurations in the metadata of the process flow and the map component
Integrate any external software within the main flow by providing its metadata definition to the map component and the process flow.
Integrate any external data mining software into the main flow by transforming the different functions involved in the data mining algorithms into sub processes functioning as per the rules configured in the main flow.
Rollback data easily as monitoring is already done on the record level.
5.1.4
Operation Manager
The framework is reflected by two user interfaces: one for the business users called (User Interface), and another one for the technical users responsible for managing the process flow operations.
The main purpose of the interfaces is to represent a single point of
access that allows users (IT and Business) to monitor, run, control and configure
most of the proposed framework functions.array of advantages and benefits. Through the DW Manager they can:
- Have access to one interface through which all mappings, process flows components and metadata definitions can be managed and monitored,
- Define map component, process flows settings.
- Have a central point of meta data control and monitoring,
- Through the ETL Scheduler, one of the operation Manager functional capabilities, users will be able to:
- Create new jobs (scheduled task) for process flows, dimensions, fact tables and aggregations.
- Set the new ETL jobs to run either manually or
automatically according to different time frequencies: by Seconds, by Minutes, by Hours, by Days, by Weeks, by Months and by Years.
- Roll back ETL processes (aggregations and fact tables only)
6.
EXPERIMENTAL WORK
The suggested framework was already deployed at some of the telecommunications operators who have installed Data warehouse solution covering areas like Products & Services, Customer Churn, Competitive Intelligence, and
Credit Control.6.1
Experimental Work Objective
The objective of using the proposed framework:
1. Enrich the IT users experience by enable more control capabilities to monitor the data movement from source A to source B by using control model and visual IT interface .
2. Enhance data manipulation performance using process centric framework and control model.
6.2
What Was the Customer Pains
The customer was shocked from the operation cost needed to support the data warehouse operations. The Operation required appointing ten resources onsite working 24/7. Knowing that the customer has already paid a lot of money to have the data warehouse system installed in addition to the performance issues they faced with due to a slow data refresh and errors occurring every day. Errors track led to delay in data loading that reached 7 days and sometimes was extended to 18 days. Business users were not able to obtain any type of analytics during this period. They consequently lost trust in the data warehouse and BI system and were very frustrated. The pains illustrated as below :
ETL performance : The Audit Daily Loading Statistics : 1. Day-1 = 30 Hours.
2. Day-2 = 24 Hours. 3. Day-3 = 13 Hours. 4. Day-4 = 18 Hours.
3. Loading Delay leads to affect business users to trust the data warehouse system .
4. Data extraction leads to delay the whole daily loading data flow.
5. Unable to monitor map component execution on record level .
6. Unable to monitor process flow execution on map level and record level .
6.3
Experimental Work Specification
Software used have the following specification: Software used have the following specification : Software specification :
o Database : Oracle DB 11g Rel 2
o ETL Tool : Oracle Warehouse Builder 11g Rel 2.0 o Extraction Tool : Fast reader for Large data volume
extraction.
o Programming Language: Java Programming o Java Virtual Machine : JDK 1.5.
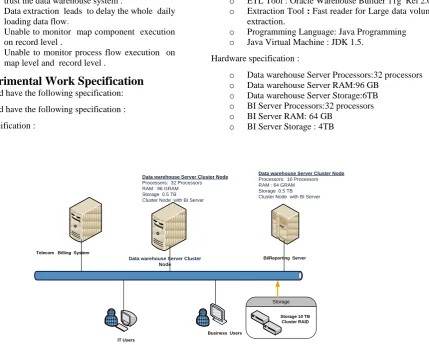
Hardware specification :
o Data warehouse Server Processors:32 processors o Data warehouse Server RAM:96 GB
o Data warehouse Server Storage:6TB o BI Server Processors:32 processors o BI Server RAM: 64 GB
o BI Server Storage : 4TB
Telecom Billing System
Data warehouse Server Cluster Node
BI/Reporting Server
Data warehouse Server Cluster Node Processors: 32 Processors RAM : 96 GRAM Storage 0.5 TB Cluster Node with BI Server
IT Users
Business Users
Data warehouse Server Cluster Node Processors: 16 Processors RAM : 64 GRAM Storage 0.5 TB Cluster Node with BI Server
Storage
[image:6.595.104.534.87.432.2]Storage 10 TB Cluster RAID
Figure 4: Customer’s Hardware specifications
6.4
Operation Manager
The operation Manager GUI in Figure 6 is a powerful, easy-to-use, integrated tool, developed to represent a single-point of access that allows users to monitor, run and configure most of the backend activities and tasks required to manage Data Warehouse operation . The operation Manager is a state-of-the art tool, fully-developed using the latest Java technologies, using
Oracle JDeveloper, and entirely embedded within the data warehouse Portal, which acts as the single gateway to all the Data warehouse
[image:6.595.148.449.582.743.2]The Operation Manager contain ; Map Setting that configure metadata for map , ETL scheduler that create job for scheduling Map , ETL Monitoring that monitor the execution and display logs .
6.5
Experimental Work Results
Some results relative to the deployment of the proposed conceptual framework will be illustrated here.
6.5.1
Daily Loading Performance
[image:7.595.55.275.201.317.2]The results come from the deployment of the proposed framework in different customers' sites, in figure 7 illustrated the daily loading performance from deploy the proposed conceptual framework compared with the traditional framework .
Figure 7: Response time for the proposed framework
6.5.2
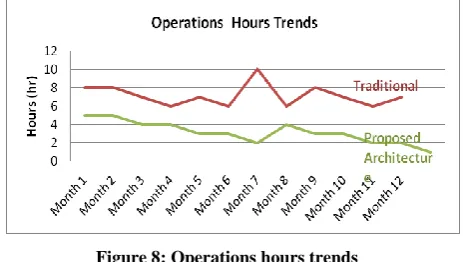
Operational Cost Trends
This section illustrates the number of hours needed to support the traditional architecture per month. In the proposed framework, the
control model enables the IT to discover the operational errors in a fast and
easy manner as errors are tracked on the record level as previously mentioned. [image:7.595.318.534.219.350.2]So in brief the IT users have full logs about each record, from where it is inserted, from which map, and from which process flow, at what time, etc. The control model allows IT administrators to rollback the wrong set of records re-load this set, in figure 8 illustrated the operation Hours spend to operate the proposed conceptual framework compared with the traditional framework .
Figure 8: Operations hours trends
6.5.3
Change Requests and Support Issues
According to use the control Model that enable high
Run a job now rather than at the scheduled time (manual run).
View currently scheduled jobs.
Delete existing jobs.
Fully monitor all the map component and process flows component .
Roll back map/ processes (aggregations and fact tables only).
Figure 9 highlights the difference between the number of change requests and issues per year when using the proposed architecture versus the traditional architecture.
Figure 9: Traditional versus proposed architecture with respect to no. of change requests and issues
6.5.4
IT Users Learning Man Days
[image:7.595.317.533.440.610.2]Due to using operation Manager Figure 10 highlights the difference in the number of man days required to train the customer's IT on how to operate the system when using the proposed architecture versus the traditional architecture.
Figure 10 : Traditional versus proposed architecture with respect to customer’s learning time
7.
RESULTS ANALYSIS AND
DISCUSSION
0 5 10 15 20
1 2 3 4 5
Old Architectur e
(hrs)
Propsed Architectur e (hrs)
Iterations
0 5 10 15 20
M1 M3 M5 M7 M9 M11
Traditional Architectu re
Proposed Architectu re
0 10 20 30 40 50 60 70 80 90
U
se
r
1
U
se
r
2
U
se
r
3
U
se
r
4
U
se
r
5
U
se
r
6
U
se
r
7
Traditional Architectu re
[image:7.595.53.285.511.642.2]4. If a difference between the interested rows and select rows can be discovered .
5. Able to monitor map component execution on record level.
6. Able to monitor process flow execution on map level and record level.
7. Use Visual interface for IT users that can use to manage the operation this application can deploy on mobile and send notification with loading status .
8.
RELATED WORK
The most BI vendors available in the market today such as SAS [6],
IBM/SPSS [7], KXEN [8], Oracle [9], Angoss [10], and TIBCO Spotfire
[11]
provide different analytics features, and other core functions. In case an end-user
organization felt ambitious today about BI tools, they will generally do a great job of
getting the right information to the right people. A lack of accountability to provide collaborative & adaptive environment for business /IT users that
can develop, validate, publish, share, and extend models from unified
framework and no need to use different software to do the job. Allow IT and Business users to fully leverage and
extend their company’s investments in the areas of BI, data warehousing (DW), data
management, and other analytics infrastructure.
In Appendix section 1, some
evaluation criteria based on Gartner [11], [13] between Market leader BI vendors can be found.9.
CONCLUSIONS AND FUTURE
WORK
In this paper, we proposed the Self-service business analytics framework that is based
on a process-centric collaborative architecture. Further, we
argued the need for mainly three components: Map component, Process Flow component
and a Control Model component. Furthermore, we explained the architecture based on these components. Some parts of the proposed framework were implemented and were discussed in detail in this paper. The obtained results showed a clear
enhancement of data warehouse performance and operations compared to
the traditional BI architecture.
In the future, we will be looking to big Data within the
proposed
framework as well as deploying
the proposed framework into the cloud.10.
REFERENCES
[1] Evelson, B. June 12, 2012. The Forrester Wave™: Self-Service Business Intelligence Platforms, Q2 2012. Forrester.
[2] Business-Software.com. 2012 Edition. Top 10 Business Intelligence Software Report. Business-Software.com. [3] Imhoff, C. and White, C. Third Quarter 2011.
Self-Service Business Intelligence: Empowering Users to Generate Insights. TDWI Research.
[4] Sherman, R. 2012. A Better Way to Fuel Analytical Needs. Sponsored by Composite Software, White Paper. [5] Endeca Technologies. 2011. Big Data Analytics:
Emerging Techniques and Technology for Growth and Profitability. Webinar.
[6] SAS. 2012. The Current State of Business Analytics: Where Do We Go From Here? White Paper, Prepared by Bloomberg Businessweek Research Services.
[7] IBM/SPSS. www.ibm.com,last visit 1/1/2013. [8] Kxen. www.kxen.com,last visit 30/7/2012. [9] Oracle. www.oracle.com,last visit 1/4/2012. [10]Angoss. www.angoss.com,last visit 1/1/2012. [11]Tibco. http://www.tibco.com,last visit 1/1/2012.
[12]Eckerson, W. 2012. Business-driven BI: Using New Technologies to Foster Self-Service Access to Insights. Tableau Software.
[13]Eckerson, W. Research Report Excerpt: Essential tips for building a next-generation BI architecture: Hadoop, data warehouse hubs, in-memory BI sandboxes explained. Sponsored by BeyeNETWORK.
[14]
Emerson, M. 2011. Embedding BI Into Your Software Solution — Best Practices. White Paper.[15]Fields, E. and Sheppard, B. 2012. A New Approach to Business Intelligence: Rapid-fire BI. Tableau Software, White Paper.
APPENDIX
Table 1: Evaluation criteria between Market Leader BI vendors [1], [3]
Evaluation Criteria Item SAS Oracle IBM Microsoft Micro
Strategy
Collaboration Collaborative analytic platform N N N N N
Analytics Easy to use predictive analytic [1], [3] N N N N N
Ad Hoc Support Y Y Y Y Y
Predictive analytic Support [1], [3] Y Y Y Y Y
Big Data Analytic Support Y Y Y Y Y
Integration(BI infrastructure )
ETL software bundle within the Platform N N N N N
Data Quality software bundled within the platform
N N N N N
Big Data Integration Support Y Y Y Y Y
High Operation Cost of Data Management Y Y Y Y Y
Integration
(Developments & Visualization )
Business User Easy to use and learn N N N Y Y