Semantic Indexing based Remote Sensing Image
Retrieval: An Intelligent Decomposition Approach
Kiran Ashok Bhandari
Asst. Professor, Department of CMPNTCET Kandivali (E) Mumbai.
Manthalkar Ramchandra R,
Ph.D Professor, Department of Electronics andTelecommunication SGGS IE & T Vishnupuri, Nanded
ABSTRACT
Without formulating physical contact with the object, Remote sensing is the achievement of information about an object or phenomenon. The contact of remote sensing (RS) images will turn into more complicated due to the vast data quantity, to defeat this challenges the users can admittance remote sensing images based on semantics. In the existing method, the Quin-tree is used for the decomposition of Content Based Image Retrieval in Remote Sensing, but it has poor retrieval accuracy. So the intelligent decomposition phase is used in our proposed method, which decomposes the image based on the spatial-spectral heterogeneity. The proposed method will perform visual feature, object semantic, spatial relationship semantic, scene semantic based retrievals to ensure fine retrieval schema, which will obtainedby applying mapping and the SS modelling in the decomposed remote sensing image. The human intervention will be introduced in the system to ensure the high retrieval accuracy. The implementation result shows the effectiveness of proposed technique, in segmenting the text lines from the input document. The performance of the proposed method is evaluated by comparing the result of proposed method with the conventional SBRSIR technique. The comparison result shows that our proposed method more accurately retrieves the images based on the VF, OS and SS than the conventional SBRSIR technique.
Keywords
CBIR, Remote sensing (RS) images, Visual Features (VF), Object Semantics, Watershed Segmentation, SVM, Attribute Relational Graph (ARG), Spatial-spectral Heterogeneity, Scene Matching model
1. INTRODUCTION
At an escalating rate, Image database systems are being produced. The conventional image databases use an alphanumeric index for images retrieval [1]. On the other hand, based on their alphanumeric indices, human beings are not applied to get back images. Only some years ago, an incorporated feature removal and object recognition method is being examined by researchers to permit queries on large databases by means of example images, user-constructed sketches and drawings, colours and texture patterns, and other graphical information [2]. The algorithms and methods being improved in such a circumstance has been specified the name of content-based image retrieval (CBIR) [3].
Content-based image retrieval (CBIR) technology was suggested in 1990s by image vision contents such as colour, texture, shape, spatial relationship, not using image notation to search images [4] [5]. Vast growth has been prepared in theory and applications in the presently stages and so image retrieval system is moreover had a view of text-based image retrieval system [7]. This kind of system only retrieves scenes based on geographical location, spatial characteristic of the imaging instrument, acquisition date and etc. [8]. It determines a few
traditional image retrieval problems, for instance, physical notations for images get users a large amount of workload and imprecise subjective explanation. It has been improved as content-based vision information retrieval technology together with image information and video information after more than one decade [6]. Though, queries can never practice this type of information, as the text-based method spotlights on the search for a scene that allocates a parallel ground cover feature with definite query scene [9] [10].
Remote sensing images attained by multispectral sensors, such as the extensively applied Landsat Thematic Mapper (TM) sensor, have demonstrated their effectiveness in various earth observation (EO) applications [11]. In common, to differentiate between different land-cover classes, the comparatively small number of acquisition channels that distinguishes multispectral sensors may be adequate. Their unfairness capability is very restricted when dissimilar types (or conditions) of the similar species (e.g., different types of forest) are to be identified on the other hand [13] [12]. It is then not astonishing that, in the past, much of our achievement in remote sensing, whether for civilian, military, terrestrial, or extraterrestrial purposes has relied upon the fabrication of precise imagery all along with efficient human interpretation and study of that imagery [14].
Due to advances in sensor technology for both high spatial and temporal resolution, the volume of distantly sensed image prolongs to grow at a vast rate [15]. NASA Earth Observing System (EOS) is planned to get one terabyte of image data per day when it is completely operational [17]. Based on sensor type, active information systems permit formulating only easy queries geographical location, and date of capture [16]. The data enclosed in simple queries is frequently less related than the content of the remote sense image because of this the regained remote sensing the images are not that appropriate. The significance of human visual perception is moreover apparent when we judge that vision processing consumes a disproportionately large part of human brain function [18] [19]. As a result to increase the real exploitation of satellite examinations, novel technologies are required to easily and selectively contact the information substances from the image archives [20].
The reminder of this paper is organized as follows. In section 2, a brief discussion about the research works related to the content based image retrieval in remote sensing images is given. In section 3 the problem statement and the contribution of our proposed system has been described. Our proposed Semantic Indexing based Content Based Image Retrieval method with an Intelligent Decomposition Approach is briefly explained in section 4. The implementation results and conclusion of the paper is given in section 5 and 6.
2. RELATED WORKS
suggested by DevisTuiaet al. [21]. In their technique, an entire hierarchical explanation of the data is specified followed by sampling and labeling of pixels. This helped to find out the data partitioning that best matches with the users anticipated classes. Cheng Qiao et al. [22] have utilized spectral matching ideas and considered spectral and spatial data to launch adaptive feature extraction method for content remote sensing image retrieval system. In this effort, through end member selection and then accomplished absolute extraction via “whole-local” scale spectral matching, the necessary spectral representation of thematic object was regarded.
T. Blaschke [23] has revealed the importance of object based image analysis; particularly geospatial object based image study while Marco Quartulli et al. [25] have demonstrated the importance of content based image retrieval in earth examination image archives and examined the condition of the art techniques.
Brandt Tsoet al. [24] has suggested semantic-based image retrieval in which a one dimensional unseen markov models (HMM) has been planned in terms of „observation-sequence‟ and „observation-density‟ manipulation strategies. An ontology strategy for semantic-based image retrieval in remote sensing archives has been offered by Ruan et al. in 2006 [26], though the importance of the semantic features are not well offered in the approach. In [27], Wang and Song launched scene semantic (SS) matching for CBIR in remote sensing archives. They initially mapped the low level image visual characteristics into multilevel spatial semantics through visual features extraction, objected based categorization of support vector machines, spatial relationship inference and SS modeling.
3. THE PROBLEM STATEMENT
Section 3, reviews the recent research works related to the Semantic Indexing based Content Based Image Retrieval in Remote Sensing Archive. The review of recent research works has demonstrated the advancements and progress of various content based remote sensing images retrieval systems in the recent past, however state-of-the-art works [24] [26] [27] focus mainly on semantic based image retrieval concepts, especially in remote sensing archive [26] [27]. Despite lot of problems have been addressed in the literature [25], developing a well-structured intelligent feature extraction methods are considered to be the most complex challenge that prevails in the current system. This problem has been addressed by Wang and Song in their work [27] and resolved by mapping low level features to
spatial semantic concepts. In addition, they have introduced coarse-to-fine retrieval scheme to improve the retrieval efficiency. However, the decomposition phase, which shall be considered as the cornerstone of the entire system, suffers due to lack of intelligence to distinguish the heterogeneity of the subjected image along with order of heterogeneity.
3.1 Contributions of the Paper
The main contributions of the paper are,
Decomposition of remote sensing image based on the spatial-spectral heterogeneity instead of Quin- tree decomposition.
Mapping and SS modeling have been done.
Visual Feature, Object Semantic, Spatial Relationship Semantic, Scene Semantic based retrievals to ensure fine retrieval schema.
4. PROPOSED RSIR USING SEMANTIC
INDEXING
Remote sensing image retrieval (RSIR) systems present mechanisms for choosing the data items that resemble most a particular question among all the accessible data in a database. The idea of remote sensing image retrieval (RSIR) is to retrieve, from actual data accumulated in a database, data that is related to a question. From the database by semantic matching, the same remote sensing images can be recovered based on this query image. It plan highly depends on the image domain in employ. The competent retrieval of these remote sensing images in semantic matching the suggested technique has been progressed. At this point, the object semantic visual characteristic semantic and the scene semantic were regarded.
The proposed system will be mainly comprised of four stages namely,
Visual Feature Extraction Using Spatial-Spectral Heterogeneity
Object Feature Extraction Using Marker-Controlled Watershed Segmentation Method
Scene Feature Extraction Using Scene Semantic (SS) Modeling
Retrieval Phase
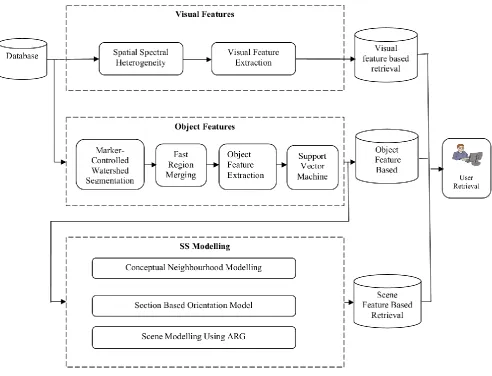
Figure. 1. Block diagram for Remote Sensing Image retrieval by Semantic Indexing
Let Id:d1,2,n be a database images, where d the number of images from the database is and Ix is the one of the image in the database Id. The image Ix is considered as the query image and the similar images like query image are retrieved from the database Id based on the visual features, Object features and the scene semantics features. The query image is first decomposed using the spatial spectral heterogeneity for the visual features image extraction. This decomposed image is called as IxD and the resultant images like query images are stored in the database. Then the marker controlled watershed segmentation is applied on the original image Ix and the image has been segmented like parcels. This segmented image is known as the IxP and the fast region merging is conducted to merge the small parcels in a hierarchical manner. This merged parcel imageIxM extracts other images from the database, which have similar object features like query image. After object feature extraction the object classification will be done based on the support vector machine (SVM) and the support vector machine applied image isISx
. The SS modelling will applied in IxS for the retrieval of similar scene images from the database, which is similar to the query image. The detail about this RSIR is described in below sections.
4.1 Visual Feature Extraction Using
Spatial-Spectral Heterogeneity
The images which have the similar visual features like the query image were retrieving by using the spatial spectral heterogeneity. For that an image from the database has been chosen and it has the size asF12. The visual features that which are consider in our proposed work are Colour and the texture.
4.1.1 Spatial Spectral Heterogeneity
The large image has been decomposed into several blocks for suitable retrieval. In our work we are using the spatial spectral heterogeneity. Here large image is decomposing into five sub blocks and each sub block has the same size. The imageIxis taken for decomposition. The middle block has no necessary to decompose. Because the middle block is the combination of the upper left, upper right, lower left and lower right block. Then the each block central portion has been found out and the intensity difference between the 4 block has been calculated with the fifth block central position intensity. The minimum intensity value of the block is calculated by using equation (1) and the fifth block is move into that minimum intensity valued block at a particular range. The range for movement of this block is represented by equation (2)
)} min{(
)
min(dist BnIntesityBCIntensity
*min( ) )
min( ,
max(DBD dist dist
DBD Range
(2)
Where min(dist)the minimum intensity is difference of block
andBnIntesity is the intensity value of each block. In first level decomposition the value of n=4 and BCIntensity is the central block intensity value and DBD is the diagonal distance of a block (each decomposition the diagonal distance of the block is same). The spatial spectral decomposed image is called IxDand this image is next passed for segmentation.
4.2 Object Feature Extraction Using Marker
Controlled Watershed Segmentation Method
The similar image like that of the query image has been retrieved from the database based on the object feature extraction method. In this Object feature extraction method the marker controlled watershed segmentation and the fast region merging will be conducted. In our proposed method the object features that which is considered as water body, Metro area, Forest and Desert
4.2.1Marker Controlled Watershed Segmentation
Watershed Segmentation obtains its name from the way in which the algorithm segment areas into Catchment basins. The watershed method is one of the classics in the field of topography which sections an image into homogenous parcels to assist sequent analyses, is the primary and most significant step of object-based image study. In here the image Ix is employed by the marker controlled watershed and the unique image that which is changed into the gray level image. From this gray level changed image the gradient magnitude has been computed, for that the effortless arithmetic is applied. The ascent magnitude is far above the ground at the borders of the objects and mainly it is low inside the objects. Numerous systems like morphological filter are applied to mark the foreground objects from the ascent magnitude image; this operation will make flat maxima within each object by employing the morphological operators like erosion, dilation, opening and closing....etc. After concluding the foreground object marking the background object has to been noticeable and the dark pixels are belongs to the background but preferably don't require the background markers to be too close to the edges of the objects we are trying to section. Merely regional minima have been employed for the foreground and the background marker. Subsequently compute the watershed transform of the fragmentation function and picture the result. One visualization method is to overlay the foreground markers, background markers, and fragmented object boundaries on the original image. At this point to make definite aspects, we can apply dilation as required, such as the object boundaries, more evident. This revelation demonstrates how the positions of the foreground and background markers influence the result. In a pair of positions, partly occluded darker objects were combined with their brighter neighbour objects since the occluded objects did not have foreground markers. [28].Thus the images were segmented like parcel and the fast merging is conducting this segmented parcel image IxP, that is described in the below section.
4.2.2 Fast Region Merging
For combine the small parcels in a hierarchical way, fast region merging is carried out on the watershed imageIxP [29].
Merging is performed under the control of a scale parameter that stopped the merging process when the minimal parcel merging cost going beyond its power. In here the quick merging is made only the neighbourhood parcel. Imagine B, C is the two nodes which is neighbour of the node A. next the fast merging has been used in those three nodes. Merge A, B if the merging cost of this node pair is under various particular thresholds, and next generate a novel node in the output. If exceeding the threshold, then a replica of node A has been prepared. In the above merging, if B has been combined before, then A will be openly merged into C and no novel nodes will be formed. For discovering the minimal cost function the beneath equation is applied.
Shape
Colour W P
P W F
C( ) (1 )
(3) Where C(F) the minimum is cost function, Pcoloris the colour of the parcel, PShape is the shape of the parcel and W is the parcel weight. The parcel colour and weight can be calculated by using equation (4) and (5)
( V) ( 1 V 2 V)
C C
color W n P nP n P
P
(4)
smt Cmt Cmt
Cmt
Shape W P W P
P (1 )
(5)
Cmt
P AndPsmt are the compactness and the smoothness of the parcel and represent the perimeter of the parcel and is the perimeters of the bounding box were the parcels are contain
andPVis the variance of the parcel.
) ( 2 2 2 1 1 1 n L n n L n n L n
PCmt
(6) ) ( 2 2 2 1 1 1 H L n H L n H L n
Psmt
(7)
The fast region merging is conducted on the watershed
image P x I
by applying the minimal cost function and the parcels are combined. This parcel merged image is identified as
the M x I
. In this merged parcel image the object characteristics has been removed. The desert, water body, metro area and forest are the object characteristics in our suggested method and for the object classification the support vector machine (SVM) is employed. The support vector machine for object categorization is explained in the beneath section.
4.2.3 Support Vector Machine
For the object categorization, the support vector machine has been used in the quick region merged image. In here the parcels are vectorized based on the spectral characteristics. The spectral mean value of the parcels and standard variation are regarded as the spectral characteristics of the parcel, the spectral mean values of these parcels are mapped into a high-dimensional feature space by applying a definite kernel function. The optimal hyper plane is generated in the high dimensional space, and the object categorization is executed to maximize the margin, which is named as the distance of the closest vectors in definite classes to the hyper plane. The best hyper plane can be computed based on the subsequent equations.
) ( 2 1 1 , 1 j i j i j n j i i n i
i SS y y
X
(8)
can be defined by equation (9), where T is the threshold value of the classification.
) ) , ( sgn(
1
T y y K S
X i i
n
i
i
(9)
The object classified image IxS can be attain from the fast region merged image and the same images like query image have been recovered from the database and it is accumulated.
4.3 Scene Feature Extraction Using Scene
Semantic (SS) Modeling
For the recovery of similar scene images like the query image from the database, Scene semantics are applied. In here for similar scene retrieval we are applying three models. They are (i) Conceptual neighbourhood Model, (ii) section- based orientation model and (iii) Scene modelling using ARG. All this three model were employed after using the object classification by means of SVM, i.e. Image IxS
4.3.1Conceptual Neighbourhood Model
We are regarding for two usual object based scene in conceptual Neighbourhood model. In here if two nodes are connected with an edge next that nodes are named as the abstract neighbourhoods. In here regard a scene have the two usual objects first object is in north direction and the second objects in south direction then the scenes which are analogous to that of the query image is recovered from database based on the conceptual neighbourhood graph. The scenes that which have within six steps in neighbourhood graph are regard as the related scene objects. These scenes are recovered from the database and are analogous to that of the query image.
4.3.2 Section based Orientation Model
[image:5.595.316.547.216.349.2]In section based orientation model were regard as for the uneven objects. If a scene has two uneven objects and we have to examine the position of these two objects, for that the nine-section orientation matrix is erected around the smaller object by employing its minimum bounding rectangle. The Second object position has been found out based on the first object. Now the standard value of the second object which is lying on the block value has been computed. If we got the standard value next the position of the second object has been found out from this value.
Figure. 2.Section Based Orientation Model
As explained in Figure. 2 the first object is in black colour and second object in gray colour, the location of second object in Figure2(a) is (1+2+3+4)/4=2.5, in Figure 2(b) the location of the second object is (−1+0+1)/3=0. In here index 7 should be changed to −1 to formulate the index array never-ending. In Figure 2(c) second object covers sections 0 to7, that mean the second object fully have first object and added calculations are no longer required.
4.3.3 Scene Modeling Using ARG
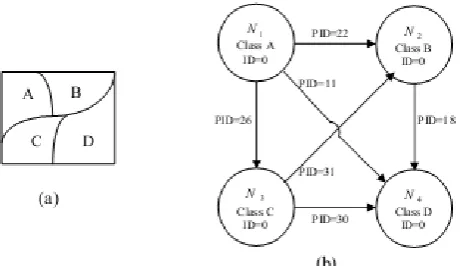
The scene modeling applying Attribute relational Graph (ARG) is a further procedure for finding the scene semantic images from the database. In here the objects are regard as the nodes and there edge is regard as the ID. If the two objects contain the link between each other then there ID is erected by applying the conceptual neighbourhood model. The similar scene images that of the query image has been recovered from the database by applying the scene modelling. Let‟s regard A, B, C, D are four categorization classes in a scene and the characteristic relational graph for this A, B, and C, D are signified in underneath figure.
Figure.3.(a) Scene, (b) ARG of Scene
The PID is the position ID; it can be worked out based on the conceptual neighbourhood model. In here the orientation connections, the topology relationships among any two parcels furthermore require to be attained to label the edges. Parcels in a categorization map only include “containing,” “touching,” and “disjointing” topology relation-ships, with the elimination of “intersecting” and “overlapping.”
4.4 Retrieval Phase
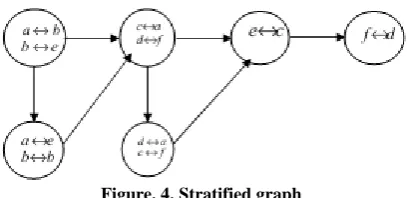
By using this visual feature removal, the similar query images from the database have been recovered, Object feature extraction and the scene feature extraction. We are retrieving the related query images by applying the SS matching modelling. For that E is regard as the query image and the F is regard as the target image. The objects in the query images must be fewer than that of the target image. Underneath table 1 illustrates the matching scheme of each category and figure 4 illustrates the stratified graph. The „a‟, „b‟, „c‟, „d‟, „e‟, „f‟ are the sub class of that of the elements A, B, C, D. Example: Let us regard category A is the Water body, in that have the objects river and sea that which are signified in „a‟ and „b‟ correspondingly.
Table .1.Matching Scheme
Category E F Matching pattern based on category level
A a, b b, e ab,be or ae,bb B c, d a, f ca,df or da,c f
C e c ec
[image:5.595.62.282.544.628.2]Figure. 4. Stratified graph
The objects in F are must not be fewer than that of the E and characteristic relational Graph is regard for the both E and F image. T and U are the number of objects in E and F correspondingly. Q (·) is named as an injective function that maps nodes in E to nodes in with the similar categories. Let
1
h and h2 are the two nodes in image E and w1 and arew2 the two nodes there in image F. The mapping of both h1 nodes and
w
1are prepared same wayh2 andw
2 are done. Here the1
h and w1 are in similar category and h2 andw2are in similar category. The spatial relation can be found out by using equation (10), object relation can be find out by using equation (11) the scene matching relation can be finding out by using equation (12)
( ( , ), ( , ))) , (
2 1 1 2 , 1 1, ,
2 1 1 1
h h T h h
w h Z w h Z F E relation Spatial
(10)
) , ( )
,
( 1
} , 1 {
1
1
w h Q F
E tion Objectrela
T h
(11)
)) ( . 6 /( ) , ( (
) , (
T card F
E ation Spatialrel
F E relation ofspatial
No
(12)
( , )
max NoofspatialrelationE F Semantc
Scene
(13)
Where card (.) is the number of edges there in the object E. The object similarity can be furthermore finding out by employing histogram intersection technique. Thus the images from the database are recovered, which are related to query images based on the visual characteristics, object characteristics and the scene semantic model.
5. EXPERIMENTAL RESULTS AND
DISCUSSION
The proposed Semantic Indexing based Remote Sensing image retrieval is implemented in the working platform of MATLAB (version 7.12) with machine configuration as follows.
Processor: Intel core i7 CPU Speed: 3.20 GHz OS: Windows 7 RAM: 4GB
The remote sensing image from the database USGS (URL:http://earthexplorer.usgs.gov/) has been decomposed by using the spatial spectral heterogeneity. The object based classification was conducted on the query blocks, which were first segmented into parcels. For this segmentation process, we are using the rainfall watershed method and it divides the image into several parcels. Then, the fast region merging is applied to merge the small parcels in a hierarchical manner. Merging is conducted under the control of a scale parameter that stopped the merging process when the minimal parcel merging cost exceeded its power. Multi resolution segmentation could be implemented by setting different scale parameters; smaller scales meant less merging cost, which created smaller parcels, and vice versa. Figure 5 shows the original image which is shown in below
Figure. 5. Original Remote Sensing Images
From this segmented image the visual features of the scenes which are matching to the query scene are extracted and stored, the visual features of the parcels, including colour and texture. Also the object features and the scene features of the image from database which are similar to the query scenes are extracted and stored. Based on the features stored in the
(i)
(ii)
(iii)
[image:7.595.166.433.67.430.2](iv)
Figure. 6. Retrieved Results (i) Query Image (ii) VF based extracted images (iii) OS based extracted images (iv) SS based retrieved images
The OS features from the segmented objects are given to the SVM for performing the classification process. In our work, the images are classified into four areas namely, water body, metro area, Forest, Desert. Our proposed RSIR system performance is evaluated by getting more number of query images and statistical measures are explained in the following section.
5.1 Performance Analysis
The proposed RSIR system performance is evaluated by measuring the image classification and retrieval process. The image classification performance by using the object features is measured by the statistical measures which are given in [30]. Furthermore, the retrieval process performance is computed by the three measures like precision, recall and F-score. The
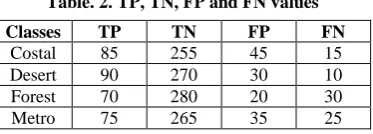
[image:7.595.334.521.558.625.2]classification performance results for the four classes‟ costal, desert, forest and metro are obtained by the SVM technique is given in Table 2 and 3. In our work, we have considered the database images have 1000 remote sensing images. In 1000 images each class have 250 RS images. In here 150 images are considered for training images and 100 images are considered for testing images.
Table. 2. TP, TN, FP and FN values
Classes TP TN FP FN
Costal 85 255 45 15
Desert 90 270 30 10
Forest 70 280 20 30
Metro 75 265 35 25
Table. 3. Performance of Our Proposed RSIR System Object Classification Results
Classes sensitivity FPR accuracy Specificity PPV NPV FDR MCC
Costal 85 15.0 85 85 65 94 35 40.0
Desert 90 10.0 90 90 75 96 25 43.6
Forest 70 6.7 88 93 78 90 22 33.3
[image:7.595.132.466.661.721.2]Table 3 shows that our proposed RSIR system precisely classifies the images based on the extracted features from the query images. Our proposed object based image classification system achieves the 87% overall accuracy in classifying the four class images.
[image:8.595.326.526.95.550.2]Our proposed system classification retrieval performance results based on the three features SS, VF and OS are given in Table 4 to 7. Moreover our proposed RSIR system retrieval performance is compared with the conventional SBRSIR technique which utilizing Quin tree decomposition instead of using spatial spectral heterogeneity decomposition.
Table .4. Proposed RSIR system performance retrieval results of costal area images based on (i) VF (ii) OS (iii) SS
Query Images
Proposed RSIR system Precision Recall
1 40 66.67
2 50 100.00
3 28 38.89
4 36 56.25
5 22 37.93
6 26 35.14
7 30 42.86
8 34 51.52
9 24 31.58
10 44 78.57
Average 33.4 53.94
(i)
Query Images
Proposed RSIR system Precision Recall
1 68 89.47368
2 84 89.3617
3 66 82.5
4 78.8 91.62791
5 75.6 94.5
6 68 89.94709
7 64 88.88889
8 74 97.36842
9 65.6 89.13043
10 60 81.52174
Average 70.4 89.43199
(ii)
Query Images
Proposed RSIR system Precision Recall
1 69.6 97.75281
2 74 94.38776
3 60 100
4 71.6 94.21053
5 88 93.61702
6 88 89.79592
7 76 97.4359
8 88 95.65217
9 72 94.73684
10 72 92.30769
Average 75.92 94.98966
(iii)
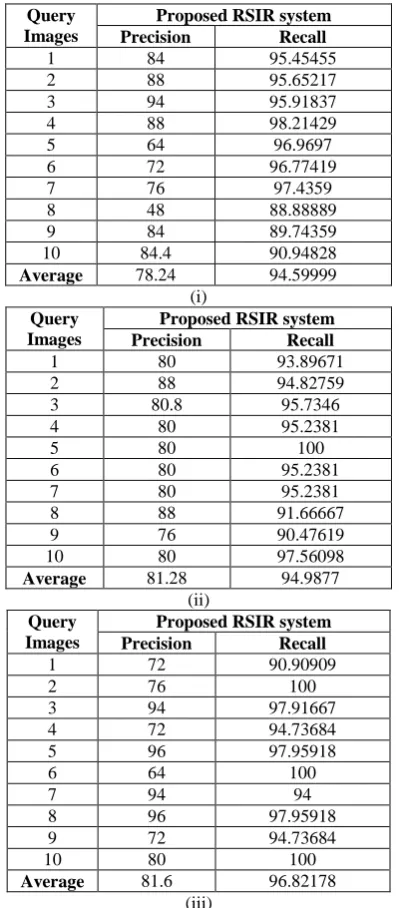
Table. 5. Proposed RSIR system performance retrieval results of Desert images based on (i) VF (ii) OS (iii) SS
Query Images
Proposed RSIR system Precision Recall
1 84 95.45455
2 88 95.65217
3 94 95.91837
4 88 98.21429
5 64 96.9697
6 72 96.77419
7 76 97.4359
8 48 88.88889
9 84 89.74359
10 84.4 90.94828
Average 78.24 94.59999
(i) Query
Images
Proposed RSIR system Precision Recall
1 80 93.89671
2 88 94.82759
3 80.8 95.7346
4 80 95.2381
5 80 100
6 80 95.2381
7 80 95.2381
8 88 91.66667
9 76 90.47619
10 80 97.56098
Average 81.28 94.9877
(ii) Query
Images
Proposed RSIR system Precision Recall
1 72 90.90909
2 76 100
3 94 97.91667
4 72 94.73684
5 96 97.95918
6 64 100
7 94 94
8 96 97.95918
9 72 94.73684
10 80 100
Average 81.6 96.82178
[image:8.595.71.270.224.695.2](iii)
Table .6. Proposed RSIR system performance retrieval results of Forest images based on (i) VF (ii) OS (iii) SS
Query Images
Proposed RSIR system Precision Recall
1 80 95.2381
2 84 95.45455
3 94 96.70782
4 80 95.2381
5 88 95.65217
6 84 95.45455
7 72 92.30769
8 78 97.5
9 72 92.78351
10 96 97.95918
Average 82.8 95.42957
[image:8.595.328.524.584.733.2]Query Images
Proposed RSIR system Precision Recall
1 92 96.63866
2 84 95.45455
3 92 95.83333
4 76 95
5 78 99.4898
6 88 95.65217
7 75.6 100
8 74 97.36842
9 74 98.93048
10 96 98.76543
Average 82.96 97.31328
(ii) Query
Images
Proposed RSIR system Precision Recall
1 96.8 98.77551
2 88 91.66667
3 76 95
4 74.4 97.89474
5 70 97.22222
6 92 97.04641
7 76 97.4359
8 72 97.2973
9 94 98.7395
10 72 94.73684
Average 81.12 96.58151
(iii)
Table.7. Proposed RSIR system performance retrieval results of Metro images based on (i) VF (ii) OS (iii) SS
Query Images
Proposed RSIR system Precision Recall
1 80 100
2 92 92.74194
3 76 96.93878
4 61.6 100
5 84 95.45455
6 80 95.2381
7 88 95.65217
8 88 95.65217
9 96 97.95918
10 72 100
Average 81.76 96.96369
(i)
Query Images
Proposed RSIR system Precision Recall
1 96 100
2 92 92
3 78 100
4 92 97.87234
5 70 98.31461
6 74 97.36842
7 79.2 99
8 96 97.95918
9 92 96.63866
10 90 97.82609
Average 85.92 97.69793
(ii)
Query Images
Proposed RSIR system Precision Recall
1 92 96.23431
2 74 97.36842
3 80 82.64463
4 94 98.7395
5 58 100
6 94 97.91667
7 86 97.72727
8 58 99.31507
9 98 98.79032
10 75.6 99.47368
Average 80.96 96.82099
(iii)
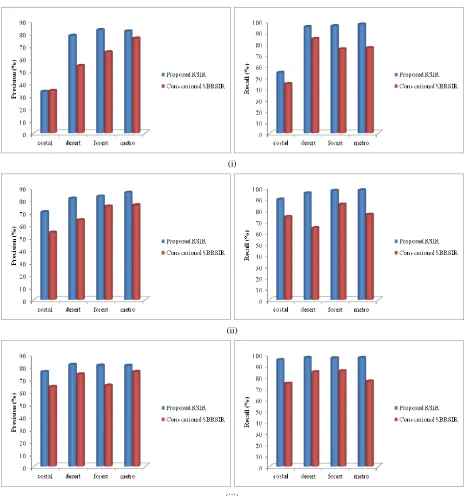
(i)
(ii)
[image:10.595.65.533.65.562.2](iii)
Figure. 7. Averaged RSIR performance of proposed and conventional systems in terms of (i) VF features (ii) OS features (iii) SS features
As can be seen from Figure.7, our proposed RSIR system shows the high retrieval results in retrieving the relevant images from the database. When compared to the conventional system our proposed system more accurately retrieves the images based on the VF, OS and SS features.
6. CONCLUSION
In this paper, we proposed an efficient Remote Sensing Image Retrieval (RSIR) system which retrieves the remote sensing images more effectively by using the multi model features. For getting the better accuracy, the spatial spectral heterogeneity is used. The database images VF, OS and shape semantic features are computed and stored in the feature database. Moreover, the SVM is utilized to classify the images into four classes based on the object semantic features which are extracted from image
7. REFERENCES
[1] Venkat N. Gudivada I And Vijay V. Raghavan “Modeling And Retrieving Images By Content”, Information Processing & Management, Vol. 33, No. 4, Pp. 427-452, 1997.
[2] Ch.Ganapathi Reddy, G. R. Babu and P. V. D.Somasekhar “Image Retrieval By Semantic Indexing”, Journal Of Theoretical And Applied Information Technology, Vol. 5, No. 6, Pp. 745-750, 2005.
[3] Wei Wang, Y uqing Song and Aidong Zhang, “Semantics-based Image Retrieval by Region Saliency”, Image and Video Retrieval, Vol. 2383, pp. 245-267, 2002.
[4] Zhang Jing ShenLansun, David Dagan Feng, “A Personalized Image Retrieval Based On Visual Perception”, Journal of Electronics, Vol.25 No.1, pp. 129-133, January 2008.
[5] Julia Vogel, BerntSchiele, “Semantic Modeling of Natural Scenes for Content-Based Image Retrieval”, International Journal of Computer Vision, Vol. 72, No. 2, pp. 133-157, 2007.
[6] Ying Liu, Dengsheng Zhang, Guojun Lu, Wei-Ying Ma, “A survey of content-based image retrieval with high-level semantics”, Pattern Recognition, Vol. 40, No. 1, pp. 262-282, 2007.
[7] Juan C. Caicedo, Fabio A. Gonzalez and Eduardo Romero, “A Semantic Content-Based Retrieval Method for Histopathology Images”, Information Retrieval Technology, Vol. 4993, pp. 51-60, 2008.
[8] Alexander G. Hauptmann, Michael G. Christel and Rong Yan, “Video Retrieval Based on Semantic Concepts”, Proceedings of the IEEE, Vol. 96, No. 4, pp. 602-622, April 2008,
[9] Po-Whei Huang and Chu-Hui Lee, “Image Database Design Based on 9D-SPA Representation for Spatial Relations”, IEEE Transactions on Knowledge and Data Engineering, Vol. 16, No. 12, pp. 1486-1496, December 2004.
[10] Yixin Chen, James Z. Wang, and Robert Krovetz, “CLUE: Cluster-Based Retrieval of Images by Unsupervised Learning”, IEEE Transactions on Image Processing, Vol. 14, No. 8, pp. 1187-1201, August 2005.
[11] PritiMaheshwary and NamitaSricastava, “Prototype System for Retrieval of Remote Sensing Images based on Color Moment and Gray Level Co-Occurrence Matrix”, International Journal of Computer Science Issues, Vol. 3, pp. 20-23, 2009.
[12] Sanjeev S. Sannakki, and Sanjeev P. Kaulgud, “Memory Learning Framework for Retrieval of Neural Objects”, International Journal of Advanced Research in Computer Engineering & Technology, Vol. 1, No. 6, pp. 100-106, August 2012.
[13] J. Fournier, M. Cord and S. Philipp-Foliguet “RETIN: A Content-Based Image Indexing and Retrieval System”, Pattern Analysis & Applications, Vol. 4, No. 2-3, pp. 153-173, 2001.
[14] Hun-Woo Yoo, Dong-Sik Jang, Seh-Hwan Jung, Jin-Hyung Park and Kwang-Seop Song, “Visual information retrieval system via content-based approach”, Pattern Recognition, Vol. 35, No. 3, pp. 749–769, March 2002.
[15] Michael S Ramsey and Luke P Flynn, “Strategies, insights, and the recent advances in volcanic monitoring and mapping with data from NASA's Earth Observing System”, Journal of Volcanology and Geothermal Research, Vol. 135, No. 1–2, pp. 1-11, 15 July 2004. [16] C. Pohl and J. L. Van Genderen, “Multisensory image
fusion in remote sensing: concepts, methods and applications”, International Journal remote sensing, Vol. 19, No. 5, pp. 823-854, 1998.
[17] PritiMaheshwary and NamitaSrivastava, “Retrieval of Remote Sensing Images Using Color, Texture and Spectral Features”, International Journal of Engineering Science and Technology, Vol. 2, No. 9, 4306-4311, 2010.
[18] Sun, Heng, Li, Shixian, Li Wen-jun and Mei Xiaoyong, “Fuzzy Semantic Retrieval of Distributed Remote Sensing Images”, International Conference on Computational Intelligence and Security, Vol. 2, pp. 1435 – 1441, 2006. [19] GaryA. Shaw and Hsiao-hua K. Burke “Spectral Imaging
for Remote Sensing”, Lincoln Laboratory Journal, Vol. 14, No. 1, pp. 3-28, 2003
[20] FaridMelgani, and Lorenzo Bruzzone “Classification of Hyperspectral Remote Sensing Images with Support Vector Machines”, IEEE Transactions on Geoscience and Remote Sensing, Vol. 42, No. 8, pp. 1778-1790, 2004 [21] DevisTuia, Jordi Munoz-Mari and Gustavo Camps-Valls
“Remote sensing image segmentation by active queries”, Pattern Recognition, Vol. 45, No. 6, pp. 2180–2192, 2012. [22] Cheng Qiao, JianchengLuo, ZhanfengShen, Zhiwen Zhu
and Dongping Ming, “Adaptive thematic object extraction from remote sensing image based on spectral matching”, International Journal of Applied Earth Observation and Geoinformation, Vol. 19, pp. 248–251, 2012.
[23] T. Blaschke, “Object based image analysis for remote sensing”, ISPRS Journal of Photogrammetry and Remote Sensing, Vol. 65, No. 1, pp. 2-16, 2010.
[24] Brandt Tso and Joe L. Tseng, “Multi-resolution semantic-based imagery retrieval using hidden Markov models and decision trees”, Expert Systems with Applications, Vol. 37, No. 6, pp. 4425–4434, 2010.
[25] Marco Quartulli and Igor G. Olaizola “A review of EO image information mining”, ISPRS Journal of Photogrammetry and Remote Sensing, Vol. 75, pp. 11–28, 2013.
[26] Ruan, Ning; Huang, Ning; Hong, Wen, “Semantic-Based Image Retrieval in Remote Sensing Archive: An Ontology Approach” IEEE International Conference on Geoscience and Remote Sensing Symposium, 2006, Page(s): 2903-2906, 2006
[27]Wang, M. and Song, T., “Remote Sensing Image Retrieval by Scene Semantic Matching”, IEEE Transactions on Geoscience and Remote Sensing, Volume:PP Issue:99, 2012
[28] Stanislav L. Stoev, “RaFSi – A Fast Watershed Algorithm Based on Rainfalling Simulation”, In Proceedings of 8-th International Conference on Computer Graphics”, 2000 [29] Min Wang, “A Multiresolution Remotely Sensed Image
Segmentation Method Combining Rainfalling Watershed Algorithm and Fast Region Merging”, rnational Archives of the Photogrammetry, Remote Sensing and Spatial Information Sciences. Vol. 37, Beijing 2008.