Session Aware Music Recommendation System
with User-based and Item-based Collaborative
Filtering Method
M. Sunitha
1T. Adilakshmi
2, PhD1,2
Dept. of CSE Vasavi College of Engineering Ibrahimbagh, Hyderabad-31, AP, India.
Abstract-
Recommender systems have been proven to be valuable means for web online users to cope with the information overload and have become one of the most powerful and popular tools in electronic commerce. The recommendations provided are aimed at supporting their users in various decision making process, such as what items to buy. In M u s i c R e c o m m e n d a t i o n S y s t e m , we recommend items to users based on their interest. First we use collaborative filtering method to identify the i t e m s which are similar and similarity among users based on the users listening history. P r o p o s e d A l g o r i t h m recommend the items to new users based on the item clusters and user clusters formed. L a t e r we have taken timestamp of user logs also into consideration to form Sessions. Finally we have evaluated the performance of the proposed algorithm with sessions and with -out sessions . Our experiment show that the accuracy of recommendation system with sessions outperformed the conventional user-based & item-based collaborative filtering method.
Keywords-
collaborative filtering, recommender system, Item-based clusters, user-based clusters sessions1.
INTRODUCTION
Due to the evaluation of internet and e-commerce users are able to get large volumes of information. This problem is known as Information overloading. It is very difficult to get the information which is interesting to the users. Recommender systems are the one which serves as a good tool for information filtering. Information filtering can be done by using content based filters and Collaborative filters. Content based method depends on the content of the item whereas collaborative filtering is based on user’s ratings.[1,2]
Music recommender systems are decision support tools that solves the information overload problem by recommending the items that are interesting and relevant to the user, based on the user’s music preferences[9]. For example , Last.fm a popular Internet radio and recommender system that recommends songs to users based on their interest and other user’s rating on those items. It also allows users to get recommendations based on the artist, album and so on. Many researchers have proposed different kinds of Collaborative filtering techniques to do quality recommendations to users. CF can be performed based on two different methods. One is User based CF technique and the other is Item based CF technique [3,4]. Both these
methods are based on the data structure, User-Item matrix. User based CF technique does the recommendations based on the user’s interest and their neighbor’s ratings i.e first we will take user interest into consideration and then the neighbor’s ratings who are similar to the target user. The basis for this method is if a test user is similar to some useri ,
and useri has rated items { I1 , I2, ……} , then recommend
those items to the test user.
The main challenges faced by CF techniques are Sparsity, Scalability and Cold-Start [10].
Sparsity: As we compare the number of users with the number of items, a user will rate few items out of total number of available items. Because of this the data structure, User-Item matrix used in CF techniques will be sparse. Recommendations provided based on these sparse ratings will be less accurate i.e user will be recommended many uninterested items.
Scalability: Scalability is another important problem faced by CF techniques. The time complexity of CF techniques increases non linearly with the increase in the number of users or items as they are basically dependent on similarity measures.
Cold-Start: Cold-start is the problem of not able to recommend items to new users and new items to existing
users. This is because CF technique can not recommend
items to new users until the user rates sufficient number of items. Similarly CF technique will not be able to recommend new items to users until the items are being rated by sufficient number of users.
2.
TRADITIONAL COLLABORATIVE
FILTERING ALGORITHMS
2.1
User -Item Rating matrix
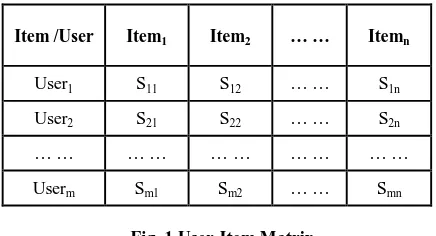
The task of the traditional collaborative filtering recommendation algorithm concerns the prediction of the target user’s rating for the target item that the user has not given the rating, based on the users’ rating on observed items. User-Item matrix is the central of this method. Each user is represented by item-ratings pairs, and can be summarized in a user-item matrix, which contains the Scorings Sij that have been provided by the ith user for the jth item, the matrix as following
Item /User Item1 Item2 … … Itemn
User1 S11 S12 … … S1n
User2 S21 S22 … … S2n
… … … … … … … … … …
[image:2.595.56.274.233.351.2]Userm Sm1 Sm2 … … Smn
Fig. 1 User-Item Matrix
Where Sij denotes the score of item j rated by an active user i. If user i has not rated item j, then Sij =0. The symbol m denotes the total number of users, and n denotes the total number of items.
2.2
Similarity Measures
Collaborative filtering approaches have been popular for both researchers and practitioners alike evidenced by the abundance of publications and actual implementation cases. Although there have been many algorithms, the basic common idea is to calculate similarity among users using some measure to recommend items based on the similarity. The collaborative filtering algorithms that use similarities among users are called user based collaborative filtering [9].
A set of similarity measures are presented and a metric of relevance between two vectors. When the values of these vectors are associated with a user’s model then the similarity is called user based similarity, whereas when they are associated with an item’s model then it is called item based similarity. The similarity measure can be effectively used to balance the ratings significance in a prediction algorithm and therefore to improve accuracy.
Similarity measures are evaluated as a metric of similarity between two users by using vectors. When the values of these vectors are associated with a user’s model then the similarity is called user based similarity. The similarity measure can be effectively used to balance the ratings significance in a Recommendation algorithm to improve accuracy.
The following are the different similarity measures used in user based CF technique. [1,3] Pearson correlation, cosine vector similarity and adjusted cosine vector similarity etc.
Pearson’s correlation, measures the linear correlation between two vectors of ratings.
Where Si,c is the rating of the item c by useri, Ai is the
average rating of user i for all the co-rated items, and Iij is
the items set both rating by useri and userj.
The cosine is a measure of similarity between two vectors as the cosine of the angle between them. The cosine of 0° is 1, and it is less than 1 for any other angle. Two vectors with the same orientation have a Cosine similarity of 1, two vectors at 90° have a similarity of 0, and two vectors diametrically opposed have a similarity of -1, independent of their magnitude. Cosine similarity is particularly used in positive space, where the outcome is neatly bounded in [0,1]. The cosine of two vectors can be derived by using the Euclidean dot product formula:
Given two vectors of attributes, A and B, the cosine similarity, cos(θ), is represented using a dot product and magnitude as
The adjusted cosine similarity as t h e formula given below, is used in collaborative filtering methods to find similarity among users when the users ratings are not given the same importance i.e the ratings of different users are taken on a different scale.
Where Si,c is the rating of the item c by user i, Ac is the average
rating of user i for all the co- rated items, and Ii,j is the items set
both rating by useri and userj.
3.
PROPOSED APPROACH FOR
RECOMMENDATIONS
3.1
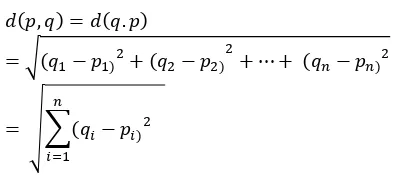
Euclidean Distance
Euclidean distance is a measure of dissimilarity. It measures is the distance between two points by the Pythagorean formula given below.
The distance from p to q is given by
3.2
Formation of Sessions
User logs are divided into sessions. A session is defined as fixed time slot of a day. We have taken four sessions for each day of equal intervals i.e from 0 a.m to 6 a.m as S1,
6a.m to 12 p.m as S2 , 12 p.m to 18 p.m as S3 and 18p.m to
24p.m as S4.
3.3
User-based Clusters
Each user from the user-item matrix of one of the session (S1,S2,S3 S4) is considered as a user vector. User clusters for
a session are formed by using the following hierarchical agglomerative clustering algorithm
Algorithm User_clusters_with Sessions() Input: User-Item Matrix of a particular session Output: User Clusters
Method: begin
1. Consider each user vector I1, I2,..Ik where k is the
number of distinct items rated by all users 2. Initialize threshold_cutoff value 3. Consider the first user and put in C1
4. For all remaining users repeat the steps from 4 to 8 5. Find the similarity of the useri with all the clusters
formed so far
6. Put the useri in the cluster with more similarity
7. If the useri is not in the threshold value of any
cluster
8. Create a new cluster end
Fig. 2 Pseudocode for User_clusters_with Sessions
3.4
Item-based Clusters
Each item from the user-item matrix of one of the session (S1,S2,S3 S4) is considered as an item vector. Item clusters
for a session are formed by using the following hierarchical agglomerative clustering algorithm
Algorithm Item_Clusters with Sessions() Input: User-Item Matrix of a particular session Output: Item Clusters
Method:
begin
1. Consider each item vector U1, U2,..Uk where k is
the number of distinct users rated an item 2. Initialize threshold_cutoff value 3. Consider the first item and put in C1
4. For all remaining items repeat the steps from 4 to 8 5. Find the similarity of the itemi with all the clusters
formed so far
6. Put the itemi in the cluster with more similarity
7. If the itemi is not in the threshold value of any
cluster
[image:3.595.64.262.143.240.2]8. Create a new cluster end
Fig. 3 Pseudocode for Item_clusters_with Sessions
3.5
Recommendation stage
After getting the user clusters and item clusters for each session, we use these clusters to recommend items to new users by using the following Algorithm for recommendations.
Algorithm Recommendation_ with Sessions () Input: User Clusters and Item Clusters Output: Set of Recommendations for new users Method:
begin
1. map the new user to the user clusters to which he/she is most similar
2. map the new user to the item cluster based on the items listened
3. consider the recommendations from step1 i.e user clusters and step2 i.e item clusters for the new user
4. Let I1, I2, ….Ik are the items which are common in
both recommendations ( user clusters and item clusters
5. recommend the common items to the new user end
Fig.4.Pseudocode for Recommendation_with Sessions
3.6
Evaluation Measures
Evaluating the data mining task is fundamental aspect of machine learning. Many methods have been proposed for assessing the accuracy of collaborative filtering methods. We have used Precision (P) and Recall (R) and f-measure. These measures are obtained from confusion matrix shown in fig. 2
3.6.1
Confusion Matrix
A confusion matrix shows the number of correct and incorrect prediction made by the classification model compared to the actual outcomes (target value) in the data.
Actual – True Actual- False Predicted-
True
True Positives (TP)
False Positives (FP)
Predicted- False
False Negatives (FN)
[image:3.595.323.536.584.680.2]True Negatives (TN)
Fig.5 Confusion Matrix
4.
EXPERIMENT AND RESULTS
This section describes about the Dataset used for experiment, experimental set up and results.
4.1
Data set
Million Song Dataset (MSD) a freely-available collection of audio features and meta-data for a million contemporary popular music tracks [9]. Comprising several complementary datasets that are linked to the same set of songs. The MSD contains extensive meta-data, audio features, tags on the artist- and song-level, lyrics, cover songs, similar artists, and similar songs. It consists of four datasets namely Last.fm, Second hand data set, Musixmatch and Taste profile data set. We used Last.fm logs as Data set for our experiment
For this experiment, the Last.fm dataset has been used. Last.fm is a music web portal that allows its user base, which has more than 30 million active users, to listen to millions of songs from its music library. All the users' activity is recorded in the Last.fm database, which in turn used by the portal to make music recommendations. The dataset for this experiment contains activities of 48 users whose listening history has been captured anonymously for the period of 3 years. For every song that a user listens to, its activity is recorded in the following format:
User_000004 2009-04-09T12:49:50Z 078a9376-3c0442807d720e158f345d
A Perfect Circle
[image:4.595.55.270.82.195.2]5ca13249-26da-47bd- bba7-80c2efebe9cd People Are People Fig. 6 User Record tuple in the dataset
The above record contains the following fields:
User id (User_000004) – Since the data is captured anonymously, we assigned each
user, a user-id of the format user_000004.
Date–Time (2009-04-09T12:49:50Z) – Time of activity is recorded which will be
used in our algorithm to determine the session in which it will belong.
Album Id (078a9376-3c04-4280-b7d720e158f345d) – A unique identifier is Attributed to each Album.
Album name (A Perfect Circle) – An album to which that song belongs to.
Track id (5ca13249-26da-47bd-bba7-80c2efebe9cd) – A unique identifier is attributed to each track / song.
Track name (People are People) – The songs which the user listened to.
4.2
Experimental setup
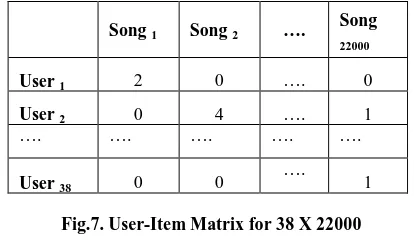
We have taken 1 00000 records from Last.fm data set for t h i s experiment. It consists of 4 8 users listening history for 3 months. We have taken all the items which are listened by at least 2 users. With this constraint on the data set we got 22000 unique items. From 48 users 33 users are taken as training data and 15 users are taken as test data. We formed item clusters by taking 3 3 X 2 2 0 0 0 user-item matrix into consideration.
Song 1 Song 2 ….
Song
22000
User 1 2 0 …. 0
User 2 0 4 …. 1
…. …. …. …. ….
User 38 0 0
[image:4.595.325.532.168.289.2]…. 1
Fig.7. User-Item Matrix for 38 X 22000
4.3
Results
We have done the experiment with various values of thresholds such as 0.01, 0.02 and so on till 0.1 without sessions and with sessions.
We plotted the graph for threshold vs Precision for traditional Collaborative filtering and new session based Collaborative filtering. We can conclude from the experimental results that as the threshold value increases the Precision a l s o i n creases. We can also conclude from the experiment that the Precision of new proposed session aware method has outperformed the traditional method.
Threshold / Avg. Precision
with session without session
0.01 0.0355047 0.0262619
0.02 0.0549396 0.0450402
0.03 0.054887 0.0460341
0.04 0.0973042 0.0795551
0.05 0.086108 0.0606562
0.06 0.1122663 0.0707849
0.07 0.1123151 0.083704
Table1. Threshold Vs Average Precision
Fig.8 Threshold Vs Average Precision
0 0.02 0.04 0.06 0.08 0.1 0.12
0.01 0.02 0.03 0.04 0.05 0.06 0.07 with session
Threshold / Avg. Recall
with session without session
0.01 0.3820892 0.3029991
0.02 0.3255506 0.1189198
0.03 0.2960225 0.0283582
0.04 0.1881605 0.0271492
0.05 0.1744613 0.011988
0.06 0.1708858 0.0082911
[image:5.595.58.271.57.417.2]0.07 0.1613805 0.0080912
[image:5.595.322.555.70.257.2]Table 2. Threshold Vs Average Recall
Fig.9 Threshold Vs Average Recall
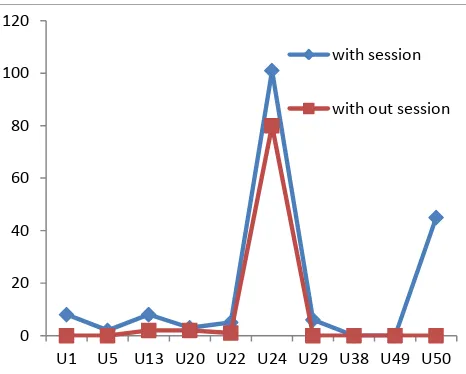
User/ True Positives
with session without session
U1 8 0
U5 2 0
U13 8 2
U20 3 2
U22 5 1
U24 101 80
U29 6 0
U38 0 0
U49 0 0
U50 45 0
Table3. Users Vs no. of True Positives for Session4
Fig. 10 Users Vs no. of True Positives for Session4
Threshold/ P, R, F
Precision (P)
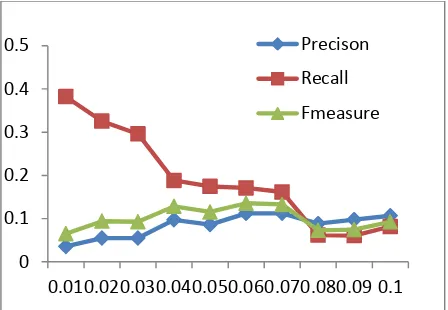
Recall (R) F-measure (F) 0.01 0.0762619 0.7029991 0.1375972 0.02 0.0850402 0.1189198 0.0991661 0.03 0.0860341 0.0283582 0.0426563 0.04 0.0795551 0.0271492 0.0404831 0.05 0.0606562 0.011988 0.0200195 0.06 0.0707849 0.0082911 0.0148436 0.07 0.083704 0.0080912 0.014756 0.08 0.1102565 0.0196916 0.0334153 0.09 0.1394788 0.1519046 0.1454268 0.1 0.1549326 0.1513282 0.1531092
Table4. Precision ,Recall and F-measure for without session
Fig.11 Precision ,Recall and F-measure for without session
0 0.05 0.1 0.15 0.2 0.25 0.3 0.35 0.4 0.45
0.01 0.02 0.03 0.04 0.05 0.06 0.07 with session
without session
0 20 40 60 80 100 120
U1 U5 U13 U20 U22 U24 U29 U38 U49 U50 with session
with out session
0 0.1 0.2 0.3 0.4 0.5 0.6 0.7 0.8
0.01 0.02 0.03 0.04 0.05 0.06 0.07 0.08 0.09 0.1
Precison
Recall
[image:5.595.60.269.74.222.2] [image:5.595.321.556.302.482.2]Threshold/ P, R, F
Precision(P) Recall (R) F-measure (F) 0.01 0.0355047 0.3820892 0.064972 0.02 0.0549396 0.3255506 0.0940136 0.03 0.054887 0.2960225 0.0926039 0.04 0.0973042 0.1881605 0.1282737 0.05 0.086108 0.1744613 0.1153053 0.06 0.1122663 0.1708858 0.1355082 0.07 0.1123151 0.1613805 0.1324498 0.08 0.0884416 0.06164 0.0726477 0.09 0.0975431 0.060515 0.0746918 0.1 0.1065505 0.081498 0.0923554
[image:6.595.55.279.286.441.2]Table 5. Precision ,Recall and F-measure for with session
Fig. 12. Precision ,Recall and F-measure for with session
5.
CONCLUSION AND FUTURE
SCOPE
We have discussed about the Session aware music recommendation system with user-based and item-based collaborative filtering method. The proposed algorithm takes the user interest into consideration without taking the user feedback explicitly as user logs are one of the implicit feedback. We also evaluated our system on benchmark dataset. We showed that session aware recommendation system improved traditional collaborative filtering technique. This work can be extended for recommendations to address Sparsity problem by taking dimensionality reduction techniques such as SVD or PCA into consideration.
6.
REFERENCES
[ 1 ] Breese J, Hecherman D, Kadie C. Empirical analysis of predictive algorithms for collaborative filtering. In: Proceedings of the 14th Conference on Uncertainty in Artificial Intelligence (UAI’98). 1998. 43-52.
[2] Chong-Ben Huang, Song-Jie Gong, Employing rough set theory to alleviate the sparsity issue inrecommender system, In: Proceeding of the Seventh International Conference on Machine Learning and Cybernetics (ICMLC2008), IEEE Press, 2008, pp.1610-1614.
[3] Sarwar B, Karypis G, Konstan J, Riedl J. Item- Based collaborative filtering recommendation algorithms. In: Proceedings of the 10th International World Wide Web Conference. 2001. 285-295.
[4] Manos Papagelis, Dimitris Plexousakis, Qualitative analysis of user-based and item-based prediction algorithms for recommendation agents, Engineering Application of Artificial Intelligence 18 (2005) 781-789.
[ 5 ] Hyung Jun Ahn, A new similarity measure for collaborative filtering to alleviate the new user cold- starting problem, Information Sciences 178 (2008) 37-51.
[ 6] SongJie Gong, The Collaborative Filtering Recommendation Based on Similar-Priority and Fuzzy Clustering, In: Proceeding of 2008 Workshop on Power Electronics and Intelligent Transportation System (PEITS2008), IEEE Computer Society Press, 2008, pp. 248-251.
[ 7 ] SongJie Gong, GuangHua Cheng, Mining User Interest Change for Improving Collaborative Filtering, In:Second International Symposium on Intelligent Information Technology Application(IITA2008), IEEE Computer Society Press, 2008, Volume3, pp.24-27.
[8] Duen-Ren Liu, Ya-Yueh Shih, Hybrid approaches to product recommendation based on customer lifetime value and purchase preferences, The Journal of Systems and Software 77 (2005) 181– 191.
[9] Million Song Dataset, official website by Thierry
Bertin-Mahieux, available at:
http://labrosa.ee.columbia.edu/millionsong/.
[10] M. Sunitha Reddy ,Dr. T. Adilakshmi, Music Recommendation System based on Matrix Factorization technique –SVD, International Conference on Computer Communications and Informatics (ICCCI-14), Coimbatore, 3-5 January, 2014
0 0.1 0.2 0.3 0.4 0.5
0.01 0.02 0.03 0.04 0.05 0.06 0.07 0.08 0.09 0.1 Precison
Recall