A New Approach based on Wireless Sensor Network and
Fuzzy Logic for Forest Fire Detection
Mohsen Ben Ammar
National Engineering School of Sfax, (ENIS) Machine Control and Power Grid Research Unit,
CMERP, Sfax, Tunisia
Rachid Souissi
CES research unit,
National Engineering School of Sfax, (ENIS), 3038, Sfax, Tunisia
ABSTRACT
Undoubtedly, great environmental damage especially in forests due to wild fire expansion has been occurred lately which has for result the deterioration of the human quality of life. For this reason an urgent need for environmental protection and preservation has been raised in the last years. This paper, presents a new approach dedicated to forest fire detection and based on wireless sensor network and fuzzy logic that performs a real-time monitoring system in order to detect forest fires and avoid considerable damages. Wireless sensor networks are used in many fields and have been deployed in a variety of applications ranging from monitoring a small room to large forests. The use of wireless sensor networks in forest fire detection applications becomes an efficient approach to early detect fires in order to minimize damages and save human life. The proposed system consists of several sensor nodes having the architecture of the System-on-Chip (SoC), CC2430. Each sensor node acquires the appropriate information and sends it to the base station node connected to a personal computer. All the nodes in the monitoring area are alimented by a PV cell, collect the information of temperature, humidity and wind speed. The collected information is the input variables of the fuzzy logic of the system applied to detect forest fires. So, it will send real-time alarm messages and deliver the forest fire risk level to the monitoring authorities in order to undertake immediate actions.
General Terms
Wireless Sensor Network, Wind speed, Forest, Humidity, Fire, Temperature.
Keywords
Forest fire, ZigBee, SoC, CC2430, Wireless Sensor Network, fuzzy logic.
1.
INTRODUCTION
Recently, due to the availability of low cost and low power WSNs, many goals set by researchers have been achieved in the field of environmental protection by the aid of WSNs [1]. In fact, several industrials, researchers and engineers work on this new technology that requires the use of many nodes, even hundreds or thousands. Moreover, these nodes must be capable of sensing, processing and communicating physical parameters like temperature, humidity and wind speed through the global wireless sensor network. This paper proposes a new approach for forest fire detection based on wireless sensor network technology and using the fuzzy logic technique as a way of supervision and monitoring to detect the forest fires in a beginning step. To acquire the necessary information like temperature, humidity and wind speed, several sensor autonomous nodes have been used at a dense
spatial distribution. As an indication, 400-800 sensors may be required to cover one square kilometer by deploying a sensor every 30-50 meters [1]. In our system, we have used the nodes of the type CC2430 having the characteristic to send and emit according to the protocol IEEE 802.15.4 and with the frequency of 2.4 GHz. After receiving all the necessary information, we apply the fuzzy logic technique to detect the fire risk level. So, this paper presents the followed detection strategy based on one wireless sensor node and one fuzzy detection algorithm (FDA) to detect the forest fire risk level. The organization of this paper is as follows: The section 2 presents the system architecture. The section 3 describes the wireless sensor network nodes architecture. In the section 4, we illustrate the IEEE 802.15.4 standard that defines the physical layer in all ZigBee devices; this standard is used by the sensor nodes to communicate with each others. The fuzzy control algorithm is presented in section 5. The Fuzzy Detection Algorithm is presented in section 6. The software architecture is exposed in section 7. In section 8, we present the results and discussion. Finally, a conclusion is given to the whole work in section 9.
2.
SYSTEM ARCHITECTURE
Fig 1: System framework.
3.
WIRELESS SENSOR NETWORK
NODES
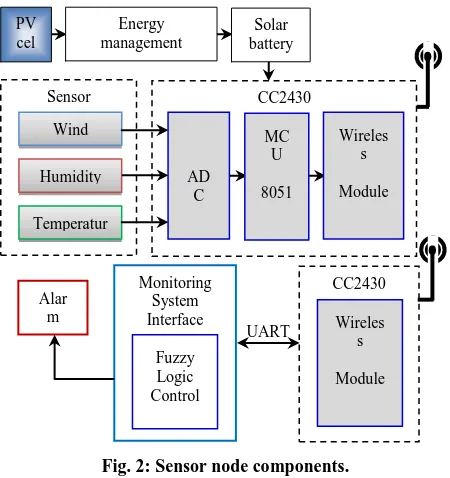
As shown in Fig.2, our system consists of several nodes and one monitoring center. An end device is a sensor node composed by one SoC CC2430 and is responsible for sensing environment parameters such as temperature, humidity and wind speed, then sending the sensed data through the routing node until it reach the PAN coordinator node. The coordinator node or the base station contains also one SoC, CC2430 connected to the personal computer through the serial port. The PAN coordinator node is responsible for collecting data from the end devices. After that, it sends this information joined with the address of the appropriate sensor node to the personal computer through the serial port. The monitoring center presents one interface developed to visualizing the received information, it has also the capacity to make further analysis, interpretation and apply the fuzzy logic algorithm to detect forest fire risk level.
Fig. 2: Sensor node components.
3.1
A. System-on-Chip CC2430
The CC2430 comes in three different versions: CC2430-F32/64/128, with 32/64/128 KB of flash memory respectively. The CC2430 is a true Sys-tem-on-Chip (SoC) solution specifically tailored for IEEE 802.15.4 and ZigBee™ applications. The CC2430 combines the excellent
performance of the leading CC2420 RF transceiver with an industry-standard enhanced 8051 MCU, 32/64/128 KB flash memory, 8 KB RAM and many other powerful features. The CC2430 is highly suited for systems where ultra-low power consumption is required. This is ensured by various operating modes. Short transition times between operating modes further ensure low power consumption.
3.2
B. BB-Battery Board
[image:2.595.328.521.279.402.2]The main function for this board is to power the CC2430EM (Evaluation Module) or CC2431EM with the use of two AA batteries. It can also be powered by a lab powered connected directly to GND and VDD on the board. As presented in Fig.3, it has one LED, one push switch, one power switch and I/O connector A and B gives access to all I/O on the SoC and to some additional pins. It can deploy a SoC network [2]. On this Battery Board, we can find the Evaluation Module, which contains the minimum components for a RF part to function.
Fig. 3: SoC Battery Board with CC2430EM.
3.3
C. Power Supply
Solar energy is an attractive source for powering sensor nodes especially when the network is steady deployed. The power provided by a photovoltaic (PV) cell is heavily dependent on the environmental conditions and on the operating power point (VPV, IPV) of the PV module [3]. Energy scavengers
using small PV modules have been recently proposed to enable perpetual operation of WSNs [4] and a new class of methods to track Maximum Power Point (MPP) has been designed. Each sensor node can be powered by a small PV module. The capacitors must be added in order to store the necessary energy needed by the sensor node [5][6].
4.
ZIGBEE STANDARD
Based on the IEEE 802.15.4, the ZigBee standard [7] defines the higher layer namely: the network layer and the application layer (Fig.4). The network layer is responsible for joining/leaving a network, security, routing, discovering 1-hop neighbors and storing neighbor information. The ZigBee network layer supports three topologies: the star topology where end devices (RFD) are attached to a central point playing the role of PAN coordinator (FFD), the tree topology where end devices can be attached also to FFD nodes with routing capabilities playing the role of ZigBee routers in a hierarchical manner (with parent-child relationship), the mesh topology where ZigBee routers can be fully connected. As shown in Fig.4, the application layer includes the Application Framework, the ZigBee Device Objects (ZDO), and the Application Sub Layer (APS). The Application Framework can have up to 240 Application Objects, that is, user defined application modules which are part of a ZigBee
I/O
Connector B Power Switch SoC Debug connector
Evaluation Module LED
I/O Connector A
Button S1
AD C
MC U 8051
Wireles s Module
Monitoring System Interface Fuzzy Logic Control
CC2430 Wireles
s Module UART
Alar m signal
CC2430 Sensor
Wind Speed Humidity Temperatur
e PV cel
l
Energy management
controller
Solar battery
PAN Coordinator
Serial
link Sensor
node Sensor
node
Monitorin g
System Interface
[image:2.595.54.279.460.699.2]application [8]. The ZDO defines the role of the device, initiates and responds to binding requests and establishes a secure relationship between devices. The APS offers an interface to data and security services to the APOs and ZDO.
Fig. 4: The communication stack.
5.
FUZZY CONTROL ALGORITHM
The soil environment is a large inertia, nonlinear and time delay system, it is very difficult to establish a precise mathematical model, and because of the unified, variability and complexity in the greenhouse field conditions, it is also difficult to achieve precise control if we use the traditional control method [9][10]. We select fuzzy control theory of intelligent control method. Fuzzy control theory does not need to establish accurate mathematical model of controlled object, robust, it is suitable for the lag, nonlinear and time-varying system, so it is suitable for using fuzzy control strategy to realize the controlling of the monitoring system [11].
[image:3.595.319.550.233.374.2]Whether to construct fuzzy controller reasonably is related to the precision of fuzzy control system, the structure of fuzzy controller is shown in Fig.5.
Fig. 5: Block diagram of the fuzzy logic controller.
The fuzzy controller includes three steps: Fuzzification with trapezoidal and triangular functions, the inference diagram where the fuzzified variables are compared to preset (Fig.5) [12][13][14]. During fuzzification, numerical variables are converted into linguistic variables to take the five following values: VL for Very Low, L for Low, N or M for Normal or Medium, H for High, VH for Very High.
6.
THE FUZZY DETECTION
ALGORITHM (FDA)
6.1
Detection strategy
In each node, the suitable treatment consists in successively acquiring the information corresponding to the current values of humidity, temperature and that of the wind speed. The combination of these different values joined with the node number will be sent inside one package to the neighbor node until reaching the base station where they will be transmitted through the serial port to the monitoring detection center. The
analyzing of the information existing in the received packed will indicate the state of the zone inside the forest and gives the risk fire level inside the forest.
6.2
The knowledge base of the expert
The fuzzy algorithm, giving the fire risk level inside the forest, is based on two parts: a WSN and one remote control and monitoring center. Four partitions are necessary to the innovative approach, which are: For the temperature: the fuzzy partition is defined by five fuzzy sets nominated At = (VL, L, N, H, VH) = (Very Low,
Low, Normal, High, Very High) is the ith fuzzy subset, i =
{1, 2, 3, 4, 5}. These subsets cover the fuzzy domain x = [0, 50 °C] and verify (Fig.6):
[image:3.595.314.545.398.741.2], (1)
Fig. 6: Fuzzy set of Temperature.
Where µAi (xi) the membership function corresponding to Ai
evaluated at .
For the relative Humidity: the fuzzy partition is composed of five fuzzy subsets, which are Bh = (VL, L, M, H, VH) =
(Very Low, Low, Medium, High, Very High) is the jth fuzzy subset, j = {1, 2, 3, 4, 5}. These subsets cover the interval y = [0, 100%] and verify (Fig.7) :
, (2)
Where the membership functioncorresponding to Bi evaluated at .
Fig. 7: Fuzzy set of relative Humidity.
For the Wind Speed: the fuzzy partition is designed by five fuzzy sets Ch = (VL, L, N, H, VH) = (Very Low,
Normal, Medium, High, Very High) is the kth fuzzy subset, k = {1, 2, 3, 4, 5}. These subsets cover the interval z = [0, 100 km/h] and verify (Fig.8):
, (3)
Where the membership function corresponding to Ck evaluated at .
1
)
(
,
5
1
i
i A
i
x
µ
x
x
i
i
x
1
)
(
,
5
1
j
j B
j
y
µ
y
y
j
)
(
jB
y
µ
jj
y
1
)
(
,
5
1
k
k C
k
z
µ
z
z
k)
(
kC
z
µ
kk
z
) ( B y
y
)
(
hB
y
15.5
1
0
y
h
38.5 61.5 84.5 100%
VL L M H VH
x
)
(
tA
x
10
) (x
A
1
0
x
t
20 30 40 50
VL L N H VH
Fuzzy controller
Fuzzification
Knowledge base
Defuzzification Inference
e
e uApplication Sub Layer Application
Framework and Objects
ZigBee Device Object (ZDO)
ZigBee Manage-ment Security
Service
ZigBee
IEEE 802.15.
4
MAC Layer Network Layer
[image:3.595.54.272.451.548.2]Fig. 8: Fuzzy set of Wind Speed.
For the Output state: This partition is composed of five fuzzy sets, which are Dh = (VLR, LR, MR, HR, VHR) =
(Very Low Risk, Low Risk, Medium Risk, High Risk, Very High Risk) is the wth fuzzy subset, w = {1, 2, 3, 4, 5}. The interval l = [0, 1] must be covered by these five fuzzy and verify (Fig.9):
, (4)
Where µDn (ln) the membership functioncorresponding to
[image:4.595.141.512.485.725.2]Dn evaluated at .
Fig. 9: Fuzzy set of the fire risk level.
6.3
The fuzzification
These fuzzy partitions lead to the computed of the membership functions µAi(x0i), µBj(y0j), µCk(z0k) and µDn(l0n),
considering the symmetric triangular functions using the symmetric triangular type. These expressions of membership functions are as follows:
x x if x x otherwise
x
µ i
i
i i i x
x i i i
A( ) 1 0 0
0
0
0
(5)
Designed for the temperature T of the forest.
y y if y y otherwise
y µ
j j
j j j y
y j j j
B( ) 1 0 0
0
0 0
(6)
Designed for the relative Humidity H at the forest.
z z if z z otherwise
z
µ k
k
k k k z
z k k k
C ( ) 1 0 0
0
0
0
(7)
Designed for the wind speed level, WS at the forest.
l l if l l otherwise
l
µ n
n
n n n l
l n n n
D ( ) 1 0 0
0
0
0
(8)
Considered for the forest fire risk level FRL.
Where x0i, y0j, z0k, l0n are respectively the values of the
variables xi, yj, zk, ln in their membership intervals and ,
, , are the range values of x0i, y0j, z0k, l0n,
respectively.
6.4
The inference diagram
Since the rules are aggregated, the defuzzification consists of calculating the real value z0n, of the fire risk level using the
centroid method (z0n is the centre of µDi) [15]:
(10)
7.
SOFTWARE ARCHITECTURE
The software design is based on a layered architecture: - Application layer: This Software offers the way to access
to the Basic RF and the Hardware Abstraction Layer. - Basic RF: This layer offers a simple protocol for
transmission and reception on two-way RF link.
- Hardware Abstraction Layer: This layer Contains functionality for access to the radio and on-board peripherals modules like LCD, UART, joysticks, and timers [16]
7.1
Acquisitions climatic parameters
7.1.1
Software Diagram
[image:4.595.317.523.486.717.2]The main task of sensor node is data acquisition and transferring, after completing the initialization of the protocol stack and hardware, the terminal node starts scanning channel, it then sends the information of joining the network. If confirmed, it began to collect data through the sensors, it then sends it to the coordinator node through the wireless transmission[9].
Fig. 10: Flow chart of the node program.
1
)
(
,
5 1
n n Dn
l
µ
l
l
n nl
i x0
j y0
z0k
l0n
1 0 1 0 0 i D i D i n dz µ dz µ z z i i Sensor NodeReduced Function Device
PAN Coordinator Node
Full Function Device
Initialization protocol stack and hardware stack and hardware
Start
Receiving data from Sensor nodes Networking
success-form ID Startnetwork
Upload data by serial port Initialization protocol
stack and hardware stack and hardware
Start
Collect data Send device address
Join network
Send data via RF link RF Network
l
0.2 ) (x D
10 0.4 0.6 0.8 1. 0
VLR LR MR HR VHR
)
(
m Dx
x
m 30 ) (z C
z
)
(
s Cz
15 10
z
s45 60 100
7.1.2
Temperature
Inside each node, one periodical temperature acquisition function is executed, having for objective the acquisition of the temperature value.
7.1.3
Humidity
The soil temperature and humidity sensor TDR-3A used, can measure the humidity with the characteristics of waterproof and seal adaptable to the soil environment. The range of humidity measurement is 0~100%, the accuracy in the range of 0 to 50% is ±2% and the output current is 4~20 mA. The output of sensor can be directly connected to port P0 of the SoC, CC2430 [17].
7.1.4
Wind Speed
Among them, the wind speed sensor would use three cup structures. When the cups would make the effect of horizontal direction it would be rotated by the rotor shaft through the slit activity of the rotary optical coupler and the output frequency signal through the built-in signal unit processes the output voltage signal [18].
7.2
Basic RF layer
The Basic RF protocol offers the service for packet transmission and reception. It can also offer a secure communication by the use of CCM-64 authentication and encryption/decryption of packets [19]. The protocol uses IEEE 802.15.4 MAC compliant data and acknowledgment packets. Basic RF contains only a small subset of the 802.15.4 standard.
7.3
Basic RF instructions
(i) halBoardInit() : called first to make sure that the board peripherals and radio interface is initialized.
(ii) basicRfInit() : called to initialize the packet protocol. (iii) basicRfSendPacket() : called to create a buffer with the
payload to send. Maximum payload size for Basic RF is 103 Bytes. Check the return value.
(iv) basicRfPacketIsReady() : to perform polling to check if a new packet is ready to be received.
(v) basicRfReceive() : to receive the packet by higher layer. The caller is responsible for allocating a buffer large enough for the packet and 2 Bytes buffer space for the RSSI value [19].
7.4
Nodes acquisition programs
static uint8 pTxData[app_payload_length]; define a 0
define b 1
static void Node() {
pTxData[a] = client_addr;
basicRfConfig.myAddr = serveur_addr; if (basicRfInit(&basicRfConfig) == FAILED) { HAL_ASSERT(FALSE); }
while (TRUE) { halLedToggle(1); pTxData[b] = getTemp(); basicRfSendPacket
(serveur_addr,pTxData,app_payload_length); halIntOff();
halMcuSetLowPowerMode(hal_mcu_lpm_3); halIntOn();
}}
(1) Node temperature acquisition program include <adc.h>
ifndef hal_temp_h define hal_temp_h
define adc_ref_1_25_v 0x00 define adc_12_bit 0x30 define adc_temp_sens 0x0E define const 0.61065 define offset_datasheet 743
define offset_measured_at_25_degrees _celcius 29.75 define offset (offset_datasheet +
offset_measured_at_25_degrees_celcius) define temp_coeff 2.45
unsigned char getTemp(void) {
unsigned int adcValue; float outputVoltage;
adcValue=adcSampleSingle(adc_ref_1_25_v,a dc_12_bit,adc_temp_sens);
adcValue >>= 4;
outputVoltage = adcValue * const;
return ((outputVoltage - offset) / temp_coeff); }
8.
RESULTS AND DISCUSSION
[image:6.595.318.554.84.341.2]The results are based on the climatic database relative to Tunis-Carthage region of the year 2013. In Summer, we find an important increase of the temperature values. Otherwise, we notice an important decrease of the humidity values. For the wind speed, it is variable, sometimes we can see a big increase, sometimes the values are very small (Fig.11). So, the fire risk level is very high (Fig.12).
Fig. 11: Summer climatic parameter curves.
Fig. 12: Summer fire risk level estimated.
In Winter, we find a decrease of the temperature values. On the other side, we notice an increase of humidity values and the wind speed too (Fig.13). So the fire risk level is low (Fig.14).
[image:6.595.58.288.87.295.2]Fig. 13: Winter climatic parameter curves.
Fig. 14: Winter fire risk level estimated.
[image:6.595.57.293.377.634.2]In Autumn, we find a medium temperature values. On the other side, we notice an increase of humidity values. The wind speed is sometimes high (Fig.15). So, the fire risk level is usually low but sometimes it can be high (Fig.16).
Fig. 15: Autumn climatic parameter curves.
Fig. 16: Autumn fire risk level estimated.
In Spring, we find a low temperature values. Otherwise, we notice an important increase of the humidity values as well as for the wind speed (Fig.17). So, the fire risk level is high mainly in the end of the season (Fig.18).
0 10 20 30 40 50 60 70 80 90 100
0 20 40 60 80 100
Time [Day]
T[
°C
],
H
[%
],
W
S
[k
m
/h
]
Hot Season
Summer
Wind Speed Humidity Temperature
0 10 20 30 40 50 60 70 80 90 100
0 0.2 0.4 0.6 0.8 1
Time [Day]
FR
L
e
v
e
l
[%
]
Fire Risk Level
Summer
0 10 20 30 40 50 60 70 80 90 100
0 20 40 60 80 100
Time [Day]
T[
°C
],
H
[%
],
W
S
[k
m
/h
]
Cold Season Winter
Wind Speed Humidity Temperature
0 10 20 30 40 50 60 70 80 90 100
0 0.2 0.4 0.6 0.8 1
Time [Day]
FR
L
e
v
e
l
[%
]
Fire Risk Level Winter
0 10 20 30 40 50 60 70 80 90 100
0 20 40 60 80 100
Time [Day]
T[
°C
],
H
[%
],
W
S
[k
m
/h
]
Moderate Season Autumn
Wind Speed Humidity Temperature
0 10 20 30 40 50 60 70 80 90 100
0 0.2 0.4 0.6 0.8 1
Time [Day]
FR
L
e
v
e
l
[%
]
Fire Risk Level Autumn (2) Base Node acquisition program
define app_payload_length 3 define a 0
define b 1
static uint8 pRxData[app_payload_length]; static void Basenode()
{
while (TRUE) {
while(!basicRfPacketIsReady());
basicRfReceive(pRxData, app_payload_length, null); long temp=pRxData[b];
[image:6.595.316.553.422.670.2]Fig. 17: Spring climatic parameter curves.
Fig. 18: Spring fire risk level estimated.
The monthly and seasonal average values of fire risk level are computed by the following equation:
x ,
jN
j j j
x
N
X
1
1
, (11)Where {VLR, LR, MR, HR, VHR} and Nj is the day number of the interval.
Table 1. Monthly percentage fire risk level values
Month Fire Risk Level (%)
VLR LR MR HR VHR
January 0.00 25.65 9.67 0.00 0.00 February 2.56 20.57 14.29 0.00 0.00 March 0.00 16.01 24.70 0.00 0.00 April 0.48 20.39 12.07 6.13 0.00 May 10.2 17.53 19.62 7.73 0.00 June 0.00 14.33 29.60 0.00 0.00 July 0.00 15.44 33.82 14.63 9.30 August 0.00 4.20 33.84 30.0 21.20 September 0.00 24.47 11.64 0.00 0.00 October 1.27 24.74 14.70 0.00 0.00 November 0.82 22.58 6.25 15.45 0.00 December 0.98 22.30 11.54 0.00 0.00
Table 2. Seasonal percentage fire risk level values.
Month Fire Risk Level (%)
VLR LR MR HR VHR
Winter 1.13 16.50 17.22 2.48 0.00 Spring 0.34 13.89 20.68 11.68 2.54 Summer 0.00 7.63 21.22 34.70 27.18 Autumn 0.38 22.68 9.93 8.45 5.99
The system simulation is computed by bloc diagrams with Matlab/Simulink [20][21][22].
9.
CONCLUSION
The development of wireless sensors networks arises new challenges to engineers in several fields. Our system includes
two aspects hardware and software. The hard-ware is composed of one PAN coordinator node CC2430 and several sensor nodes CC2430. Each component contains a System-On-Chip CC2430 that contains the processor which executes the necessary program on each node. The software aspect is mainly consisted of one monitoring center that can supervise all the forest, through the information given by all the nodes inside the whole network. The results provided can indicate the fire risk level inside the forest. The results, obtained by the application of the fuzzy logic algorithm, justify an important fire risk level in hot season. Otherwise, the fire risk level varies between low and medium in relation to the wind speed. This new approach gives a reliable solution that can permit to detect forest fires risks, in order to ovoid severe damage of this disaster, when it happens
10.
REFERENCES
[1] Evangelia Kolega, Vassilios Vescoukis, Christos Douligeris, “Forest Fire Sensing and Decision Support using Large Scale WSNs”, International Congress on Environmental Modelling and Software Modelling for Environment’s Sake, Fifth Biennial Meeting, Ottawa, Canada 2010.
[2] Rachid Souissi, Mohsen Ben Ammar, “An Intelligent Wireless Sensor Network Temperature Acquisition System with an FPGA”, Wireless Sensor Network. Volume 6, Number 1, pp. 1-7. DOI: 10.4236/wsn. 2014.61001. January 2014.
[3] Davide Brunelli, Valter Bella, Fabio Luigi Bellifemine, “Poster Abstract: μsolar scavengersfor ultra-low power wirelesssensor nodes”, DEIS - Universitá di Bologna Italy.
[4] Xiaofan Jiang, Joseph Polastre and David Culler, “Perpetual Environmentally Powered Sensor Networks” Computer Science Department University of California, Berkeley, CA 94720. IPSN 2005.
[5] C. Park and P. Chou, “Ambimax: Autonomous energy harvesting platform for multi-supply wireless sensor nodes”, ISBN: 1-4244- 0626-9, vol. 1, pp. 168–177, IEEE 2006.
[6] Sukwon Choi, Hojung Cha, SungChil Cho, “A SoC-based Sensor Node: Evaluation of RETOS-enabled CC2430”, SECON, pp. 132-141- IEEE 2007.
[7] ZigBee Alliance, “ZigBee Specifications, version 1.0”, Document 03322r10ZB. ZigBee Standards Organization, April 2005.
[8] Paolo Baronti, Prashant Pillai, Vince W.C. Chook, Stefano Chessa, Alberto Gotta, Y. Fun Hu, “Wireless sensor networks: A survey on the state of the art and the 802.15.4 and ZigBee standards”, Computer Communications, Volume 30, Issue 7, 26 May 2007, pp. 1655-1695, ISSN: 0140-3664, 10.1016/j.comcom. 2006.12.020.
[9] Liai Gao, Meng Zhang, Geng Chen, “An Intelligent Irrigation System Based on Wireless Sensor Network and Fuzzy Control”. Journal of Networks, vol. 8, N°5, May 2013.
[10]P. Cepeda, P. Ponce, D. Romero, A. Molina, “Fuzzy CMeans Clustering Technique applied for Modeling Parameters of an intelligent Greenhouse Open Control
0 10 20 30 40 50 60 70 80 90 100
0 20 40 60 80 100
Time [Day]
T[
°C
],
H
[%
],
W
S
[k
m
/h
]
Moderate Season Spring
Wind Speed Humidity Temperature
0 10 20 30 40 50 60 70 80 90 100
0 0.2 0.4 0.6 0.8 1
Time [Day]
FR
L
e
v
e
l
[%
]
Fire Risk Level
[image:7.595.55.281.449.683.2]System”, Electronics, Robots and Automotive Mechanics Conference, IEEE Conference Publishing Services, pp.283-288, 2011.
[11]Mohsen BEN AMMAR, Majed BEN AMMAR, Maher CHAABENE, Abdelhamid RABHI and Ahmed EL HAJJAJI, “Characterization tool for photovoltaic power sources”, 18th Mediterranean Conference on Control & Automation. Congress Palace Hotel, Marrakech, Morocco. 978-1-4244-8092-0/10/ ©2010 IEEE- June 23-25, 2010.
[12]S. Lalouni, D. Rekioua, T. Rekioua, E. Matagne, “Fuzzy logic control of stand-alone photovoltaic system with battery storage”, Journal of Power Sources 193, pp.899– 907, 2009.
[13]Souhir Sallem, Mohsen Ben Ammar, Maher Chaabene, “Fuzzy rules based energy management of a PVP/battery/load system”, World Renewable Energy Congress WREC X, PV63, pp. 1384-1389, Glasgow, Scotland, 19-25 July 2008.
[14]Antonio M. Ortiz and Teresa Olivares, “Fuzzy Logic Applied to Decision Making in Wireless Sensor Networks”, Fuzzy Logic - Emerging Technologies and Applications, Chapter 11 DOI: 10.5772/36430. ISBN 978-953-51-0337-0, March 16, 2012.
[15]Elmer Dadios, “Fuzzy Logic - Emerging Technologies and Applications”, Published in print edition March, 2012. ISBN 978-953-51-0337-0, Publisher: InTech, Chapters published March 16, 2012 under CC BY 3.0 license DOI: 10.5772/2337
[16]Institute of Electrical and Electronics Engineers, Inc., IEEE Std.802.15.4-2003 “Wireless Medium Access Control (MAC) and Physical Layer (PHY) Specifications for Low RateWireless Personal Area Networks (LR-WPANs), New York, IEEE Press. October 1, 2003. [17]Xinrong Zhang,Bo Chang, “Design of Water-saving
Irrigation Monitoring System Based on CC2430 and Fuzzy-PID”. Journal of Control Engineering and Technology (JCET). www.ijcet.org; JCET Vol. 2 Iss. 3 - July 2012 PP. 124-129.
[18]ZHANG Shao-Qian1, JI Yang2, “Wireless Sensing WOT System Design of Fuzzy Control”. Sciencepaper Online, 2013.
[19]CC2430; Software Examples Users Guide. Texas Instruments Incorporated, Copyright © 2009.
[20]Fuzzy logic Toolbox User's Guide R2013b. ©COPYRIGHT 1995–2013 by The MathWorks, Inc. September 2013.
[21]Holzbecher, Ekkehard, “Environmental Modeling Using Matlab”. ISBN: 3540729364, Second Edition- Springer 2007.
[22]Shahab Araghinejad, “Data-Driven Modeling: Using MATLAB® in Water Resources and Environmental Engineering”, ISBN: 9400775059. Edition Springer, 2014.
8. AUTHORS PROFILE
Mohsen BEN AMMAR received his PhD in Electrical
Engineering from the National Engineering School of Sfax, University of Tunisia in 2011. He is Associate Professor at ENI-Sfax, Tunisia. He was Master Technological Professor in ISET of Sfax, Tunisia, from 1998-2013. Since 2006, he has held a research position at the Machine Control & Power Grid Research Unit, in the National School of Engineers of Sfax, Tunisia. His current research interests are renewable energies management, monitoring system, fuzzy logic and Genetic Algorithms. Dr Ben Ammar is a member of the organization committees of International Renewable Energy Congress (IREC, www.irec- conference.com).
Rachid SOUISSI is a PhD student in Computing Engineering