Munich Personal RePEc Archive
Comparative Analysis of the Relationship
Between Poverty and Underground
economy in the Highly developed,
Transition and Developing Countries
Elijah, Obayelu Abiodun and Uffort, Larry
Uniiversity of Ibadan. Oyo State Nigeria
6 March 2007
Comparative Analysis of the relationship between Poverty and Underground economy in the highly developed, transition and developing countries
Obayelu Abiodun Elijah1 and Uffort, Larry2
1Department of Agricultural Economics, University of Ibadan, Ibadan, Nigeria
2
Central Bank of Nigeria, Lagos Branch
Corresponding author: [email protected]
Abstract
This study was undertaken with the goal of analyzing the relationship between poverty rates and size of underground economy in the developed and developing countries and exploring whether there is a link between them. There are technical problems in linking them in that getting information from those who have undertaken underground activities are difficult. Secondary data were used to established hypothetical relationship and primary data for the empirical analysis. The results of the descriptive analysis revealed that underground economy and poverty have no geographical boundary. Although the incidence, and the size differs from one country to another. The incidences of poverty and shadow economy are larger in the poor (developing and transition) countries when compared with the highly developed countries. There is also a causal link between poverty and underground economy especially in the developing and transition countries with common factors such as high unemployment and corruption rates affecting both poverty and underground economy. High social security system and tax burden were found to account for the high rates of underground economies in the highly developed countries even with people’s awareness of its implications when caught. In developing countries like Nigeria, most people embark on unlicensed (and hence illegal) micro-enterprises / activities like production and sale of pure water, yoghurts, cutting down of economic trees, illegal running of private schools, drug trafficking, prostitution, black-market currency exchange, fake disclosure of actual business profit, in order to increase their levels of income by tax evasion or avoidance in the name of surviving. Government can reduce this menace to certain extent by engaging itself in sustainable poverty reduction activities, tax policy changes, embarking anti-corruption campaign and increase in job opportunities within the formal economy.
Key words: Poverty, underground economy, developed, transition and developing countries
Introduction
about the increasing rates of underground economy around the world. One therefore wonders whether there is a kind of linkage between the two concepts. Although quite a large amount of literature has been published on single aspects of the hidden or underground economy, and a comprehensive survey has been written by Schneider and Enste,(1989,1999 and 2002) the subject is still quite controversial with some disagreements about the definition of what constitutes a shadow economic activity, there are disagreements about the estimation procedures used to estimate the size of the shadow economy and there is also disagreement of the use of these estimates in economic analysis and policy aspects as well as causes of underground economy with regards to poverty. Crime and other underground economy activities (including the shadow economy) are a fact of life around the world; which most societies attempt to control through various measures such as punishment, prosecution, economic growth or education. Gathering statistics about who is engaged in underground (or criminal) activities, the frequency with which these activities occur, and the magnitude of such activities, is crucial for making effective and efficient decisions regarding the allocation of a country’s resources and alleviation of poverty. Given that the individuals who are engaged in these activities do not want to be identified, it is very difficult to get accurate information about these underground activities. Hence, the estimation of shadow economy activities can be considered a scientific passion for knowing the unknown. Moreover, little is still been known about what motivates individuals to work in the shadow economy or request such work. The basic questions which this study attempt to answer are: is there a causal link between poverty and underground economy? Is it the same factors that contribute to poverty contribute to the underground economy? Do we have the same size of poverty and underground economies across countries in the world? Is it only countries with high rates of poverty that have large size of underground economy? What are the causes of underground economy aside from poverty?
Answers to the questions will be made after thorough review of literature and observation since those in such business do not want to be identified either through interview or any other means of data or information gathering methods.
Objectives of the study
The study has the following specific objectives:
(i) To explain the basic concepts of poverty and underground economy through extensively review of literatures
(ii) Examine the magnitude of poverty and underground economy among various countries of the world (Developing, Transition and highly developed OECD countries)
(iii) Investigate the relationship between poverty and underground economy based on the findings of the causes of underground economy and poverty from various countries
(iv) To suggest recommendations based on the findings for various countries
Theoretical frameworks and Literature reviews of poverty and underground economy
Poverty and underground economy
There is yet no universally accepted definition of poverty. There is always the difficulty in deciding where to draw the line between the poor and the “non-poor”. Poverty has been perceived by many as not just lack of money, food and assets but also as lack of access to education and health care and lack of security, dignity and independence. Narayan and Petesch (2002) succinctly posit that, “poverty also may look quite different, seen through the eyes of a poor man or a woman.” This is reflected in the differences in the various definitions captured from the point of view of the poor in different countries (see appendix 1). Poverty can be categorized as either relative or absolute on one hand, while on another, it can be classified as permanent or transient. Aliyu (2003) explained absolute poverty to be “the condition where an individual or group of people are unable to satisfy their basic requirements for human survival in terms of education, health, housing, feeding employment, transportation, etc.” Corroborating the above meaning of absolute poverty, Aboyade (1975) defined it as the insufficient or total lack of necessities and facilities like food, housing, medical care, education, social and environmental service, consumer goods, recreational opportunities, neighbourhood amenities and transport facilities. What is considered poverty level in one country or community may well be the height of well being in another. This therefore, infers that poverty may be seen in relative terms. Relative Poverty, according to Aliyu (2003) “is a situation where an individual or group of people can be said to have access to his/their basic needs, but is comparatively poor among persons or the generality of the community”. The people are degraded; they live outside the grades or categories which the community regards as acceptable.
Viewing poverty from the dimension of permanency or transience differentiates it on the basis of time or duration, and distribution as to widespread, individual or concentrated. According to Aliyu (2003) several types of poverty may be distinguished depending on such factors as time or duration (long- or short-term or cyclical), if the poverty is widespread throughout a population, but the occurrence itself is of limited duration and distribution (widespread, concentrated, and individual); if it involves relatively permanent insufficiency of means to secure basic needs. The condition may also be so general as to describe the average level of life in a society or it may be concentrated in relatively large groups in an otherwise prosperous society.
There is no doubt that the attempts made above to describe various forms of poverty have given inkling to the causes of poverty as will be discussed in the subsequent section
The underground economy is a general name for many kinds of economic activity. The phenomenon is known, and has been discussed in the literature under many different names: informal, unofficial, shadow economy, irregular, parallel second underground, subterranean, hidden, invisible, non-observed’ economy, Grey, clandestine, unrecorded and shadow economy or moonlighting. In several languages the term most often used is black economy. Informal economy is actually a large and important part of the overall economy. No single definition exists but it depends on the purpose. It means different things to different people or agencies. This form of economy was introduced in 1972 by the International Labour Organization in the context of Kenya, and was further elaborated in the Latin American context by Tokman (2004)among others, and by more recent analyses (Portes and Haller 2005).
on underground activities (such as moonlighting for house building), which are value-adding. Thus, underground activities and tax evasion are related but certainly not identical (Frey and Schneider, 2000) The underground economy is not and should not be identified with illegality. Some activities are perfectly legal but are not subject to taxes (e.g. because of their small size), and therefore escape measurement in official statistics. Other activities are legal as such, but taxes are evaded ((Frey and Schneider, 2000). Underground economy covers “those activities that are productive and legal but are deliberately concealed from the public authorities to avoid payment of taxes or complying with regulations” (Organisation for Economic Co-operation and Development (OECD), 2002). Examples of this are food servers who report less than all their tips, successful gamblers, or other “off-the-books” cash payments. Many aspects of the underground economy derive from such illegal activities as loan sharking, illicit drug dealing, or prostitution. The International Labour Council (ILC) used the term ‘informal economy’ as referring to “all economic activities by workers and economic units that are in law or in practice not covered or insufficiently covered by formal arrangements” (ILO 2002).
In the broadest sense, it is economic activity that is sufficiently hidden so that it is untaxed and may be unmeasured. The activities themselves may be legal or illegal. The presumption is that the economic agents are at least passively aware that bringing their activities to the attention of the authorities would have tax (and possibly other legal) ramifications. The handbook for measurement of the non-observed economy was published OECD (2002). The book looked at informal sector in a broader context of non-observed economy and relates it to three other concepts, with which it is often confused: underground production; illegal production; and household production for own final use
The System of National Accounts (SNA) 1993, defines illegal production as production activities which are forbidden by law, or which become illegal when carried out by unauthorised producers. Examples are drug trafficking or abortions practiced by unauthorised persons. Thus, illegal production can be considered to represent a contravention of the criminal code.
Underground production is defined in the SNA 1993 as production activities, which are legal when performed in compliance with regulations, but which are deliberately concealed from public authorities. An example is the sale of legal goods or services without tax declaration. Thus, underground production can be considered to represent a contravention of the civil code.
The SNA 1993 acknowledges that, in practice, it may not always be easy to draw a clear borderline between underground production and illegal production. For conceptual purposes, one can however use the above-mentioned definitions to distinguish three types of production activities: (i) activities, which are legal and not underground; (ii) activities, which are legal, but underground; and (iii) activities, which are illegal.
Types of poverty and underground economy
Poverty has been conceptualized in both the “relative” and “absolute” sense based on whether relative or absolute standards are adopted in the determination of the minimum income required to meet basic life’s necessities. The relative conceptualization of poverty is largely income-based. Accordingly, poverty depicts a situation in which a given material means of sustenance within a given society is hardly enough for subsistence in that society (Townsend, 1962).
The illegal economy: The illegal economy consists in the income generated by economic activities pursued in violation of legal statutes defining the scope of legitimate forms of commerce. The most notable illegal activities are the production and distribution of prohibited substances (drugs, for example) and such services as prostitution, pornography, and black-market currency exchange. Estimates of income produced from illegal activities are typically derived from crime related statistics
The unreported economy: The unreported economy consists in economic activities that circumvent or evades fiscal rules as set out in the tax code. A summary measure of the unreported economy is the amount of unreported income. Namely: the amount of income that should legally be reported to the tax authorities but are not. Since illegal income is taxable, the unreported economy includes both legal and illegal source income that is not properly reported. A complementary measure of the unreported economy is the “gross tax gap,” the difference between the amount of tax revenues legally due the fiscal authority and the amount of tax revenues paid voluntarily. Since the “net tax gap” represents the difference between the amount of revenue due and the amount actually collected, the difference between the gross and net represents the revenues collected as a direct result of enforcement activities. Benefit fraud, false claims to benefits (welfare or unemployment payments) or subsidies to which the claimants are not legally entitled, should be formally included in “tax gap” measures.
The unrecorded economy: The unrecorded economy consists in those economic activities circumventing the institutional conventions that define the reporting requirements of government statistical agencies. A summary measure of the unrecorded economy is the amount of unrecorded income. Namely: the amount of income that should, under existing rules and conventions, be recorded in national accounting systems such as National Income and Product Accounts but is not. Unrecorded income represents a discrepancy between total income or output and the actual amount of income or output captured or enumerated by the statistical accounting system de-signed to measure economic activity. Since national accounting conventions differ with respect to the inclusion of illegal incomes, unrecorded income may or may not include components from the illegal sector.
Methods of estimating poverty and underground economy
Absolute poverty can be measured in different ways. These include: the headcount ratios/incidence of poverty, the poverty gap/income shortfall (World Bank,1993), composite poverty measures (Sen,1976 and Thorbecke FGT, 1984), the physical quality of life index (PQLI) (Morris, 1979), the augmented physical quality of life index (PAQLI), and the human development index (HDI)(UNDP,1990). For Relative poverty measures, which define the segment of the population that is poor in relation to the set income of the general population, a poverty line is set at one-half of the mean income, or at the 40th percentile of the distribution (Thorbecke FGT, 1984). The two main kinds of relative measures are: the Average income, which is the average income of the poorest 40 percent of the population and/or the average income of the poorest 10 or 20 percent of the population. The second is the number or population of people whose incomes are less than or equal to predetermined percentage of the mean income say 50% or less of the mean income.
are criticized for not being based on theory and for employing flawed econometric techniques (Thomas, 1999). Studies using microeconomic data for the estimation of the black economy on the other hands have identified eight methods. These are: (1) the national accounts reconciliation method based on statistical discrepancies; (2) the audit method; (3) the labour market and household survey method; (4) the monetary aggregates or currency ratio method; (5) the transactions method; (6) sensitivity analysis; (7) Physical input or electricity consumption estimates; and (8) econometric modelling.
In all the literatures reviewed, the currency demand approach is found to be the most often used method to estimate the shadow economy by most countries.
Employment in the informal/ underground economy
The term ‘informal economy’ is used by the ILO as including the informal sector as well as informal employment, and that as a supplement to the System of National Accounts 1993 an international conceptual framework for measurement of the non-observed economy already exists, which distinguishes the informal sector from underground production, illegal production, and household production for own final use. The ILO report on ‘Decent work and the Informal Economy’ (ILO 2002), defined employment in the informal economy as comprising two components: (i) employment in the informal sector as defined by the 15th ICLS, and (ii) other forms of underground employment (i.e. informal employment outside the informal sector).
As part of the report, the ILO developed a conceptual framework for employment in the informal economy. The framework lent itself to statistical measurement as it built upon internationally agreed statistical definitions, which were used because of their consistency and coherence. It enables measures of employment in the informal sector to be complemented with broader measures of informal employment (Hussmanns 2001; 2002).
The concept of informal employment is considered to be relevant not only for developing and transition countries, but also for developed countries, for many of which the concept of the informal sector is of limited relevance. The 17th ICLS acknowledged, however, that the relevance and meaning of informal employment varied among countries, and that therefore a decision to develop statistics on it would depend on national circumstances and priorities.
The 15th ICLS (ILO 2000) defined employment in the informal sector as comprising all jobs in informal sector enterprises, or all persons who, during a given reference period, were employed in at least one informal sector enterprise, irrespective of their status in employment and whether it was their main or a secondary job. Informal sector enterprises were defined by the 15th ICLS on the basis of the following criteria:
They are private unincorporated enterprises (excluding quasi-corporations). That is, enterprises owned by individuals or households that are not constituted as separate legal entities independently of their owners, and for which no complete accounts are available that would permit a financial separation of the production activities of the enterprise from the other activities of its owner(s).
Private unincorporated enterprises include unincorporated enterprises owned and operated by individual household members or by several members of the same household, as well as unincorporated partnerships and co-operatives formed by members of different households, if they lack complete sets of accounts.
Methodology
The study mainly employed secondary data through publications by various bodies from different countries of the World. Nigeria was in addition sampled in addition for empirical investigation on the relationship between poverty and underground economy. The country (Nigeria) is the single largest geographical unit in West Africa. It occupies a land area of 923, 768 square kilometres situated between longitude 3 0 and 15 0 East, and latitude 40 and 14 0 North (CBN, 2000) with a population of over 130.2 Million (United Nation 2005). The country is not only characterised by high level of underground economy as presented in table 3, but also ranked as the 26th most poorest in terms of human poverty (UNDP, 2002).
Cross national data were collected through secondary sources. Cross sectional data for the empirical analysis were also collected through primary sources by a well structured interview scheduled and observation. A total of 100 respondents were randomly sampled from various parts of Nigeria and interviewed on their perception about underground economies and the possible causes that can motivate them into such activities. This sampling was done in order to get reliable data to compliment the difficulties in getting those that actually involved in shadow economy.
Results and discussion of findings
Analysis of the size of underground economies of various countries (the developed and the developing countries)
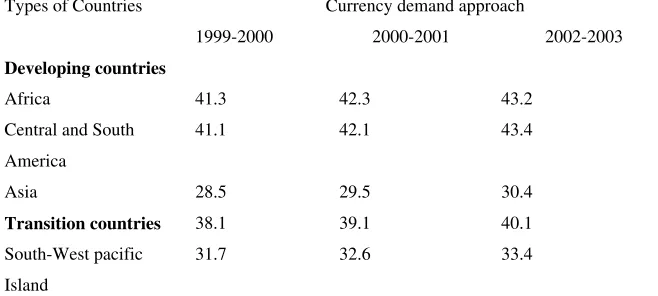
The results of the Shadow economies for different countries are presented in this study by grouping them to developing, transition and OECD. The estimates of the size of the informal economy as a percent of official GNP on available years indicates that the average size of the shadow economy is higher in developing countries compared with other countries. For instance from 21 countries in 1999/2000, the size of shadow economy was 39.2% in developing countries, 38.1 in the transition countries and 16.8 in the OECD countries. Similarly, in the year 2000/ 2001, a sample of 110 developing, transition and OECD countries show the average shadow economy to be 41% in the developing countries 39.1% in the transition countries and 16.7% in the OECD countries. In the year 2002/2003, from a sample of 145 countries all over the World, developing countries take a lead in the size of shadow economies with 43%, 40.1% in the transition countries and 16.3% in the OECD countries (see table 1). This results shows that the size of underground economy in the developing and transition countries is larger than that of highly developed OECD countries probably due to low level of unemployment and rates of poverty coupled with technological advancement of those countries
most of these countries). The shadow economy from the same study of twenty-one Central and South American countries also increased from 41.1% in the year 1999/2000 to 43.4% of official GDP in 2002/2003; an increase of 2.3 percentage between 1999-2003. Bolivia has the largest shadow economy with 68.3%, followed by Panama with 65.3% and Peru with 60.9% of official GDP with the median country been Brazil with 42.3% and at the lower end are Chile with 20.9%, Costa Rica with 27.8%, and Argentina with 28.9%of GDP (see table 2 for some of these countries)
Measurement of the size and development of the shadow economy in the transition countries on the other hands started since the late 80s with the work of Kaufmann and Kaliberda (1996), Johnson et.al. (1997) and Lacko (2000) using the physical input (electricity) method. In Schneider survey of 25 transition countries 1999-2003, the development of the average size of the shadow economy in East and Central European countries was 38.1% of official GDP in 1999/2000 and increased to 40.1% in 2002/2003 which is an increase of 2 percentages. The highest shadow economies have Georgia, Azerbaijan and the Ukraine with 68.0%, 61.3% and 54.7%. The median country was Bulgaria, surrounded by Serbia and Montenegro of 39.1% and Romania of 37.4%. At the lower end are the Czech Republic with 20.1%, the Slovak Republic with 20.2% and Hungary with 26.2% of official GDP (see table2).
In the OECD countries, the average size of the shadow economy in 1999/2000 from 21 OECD countries was 16.8% of official GDP, it decreased to 16.3% in 2002/2003, and a decrease of 0.5 percentage points. Greece, Italy and Spain have by far the largest size of the shadow economy in 2002/2003 with 28.2%, 25.7% and 22.0% of official GDP, while between 1989 and 1993 it was Spain (23.9%), Greece (21.2%) and Belgium (22,0%). The median country was Ireland with 15.3%, surrounded by Germany with 16.8% and Canada with 15.2% of official GDP in 2000/2003 as against Canada in 1989-1990. At the lower end are the United States, Switzerland and Japan with a shadow economy of 8.4%, 9.4% and 10.8% of official GDP in 2000/2003 while Norway Switzerland and USA were lower end between 1989 and 1990 with 9.0%, 10.2% and 10.8%) respectively (see table 2)
In 1998, compared to other years of the OECD countries, Greece (29.6 %), Italy (27.8 %), Spain (23.4 %), and Belgium (22.6 %) have the largest shadow economies. In the mid-group are Sweden (20.0 %), Norway (19.7 %), Denmark (18.4 %), Ireland (16.9 %), Canada (15.0 %), France (14.9 %), Germany (14.7 %) and The Netherlands (13.5 %), and at the lower end Austria (9.1 %), USA (8.9 %) and Switzerland (8.0 %).
The data as shown in table 2 indicate that has been a relatively small changes in the shadow economy in in some of the investigated countries. There was a small increase of about 0.5% in some developing countries and a small decline for some of the OECD countries and those in Central and Eastern Europe
Causes, failure of government poverty alleviation programmes, effects and the coping strategies with poverty
causes of poverty and underground economy as against the difficulty encountered in arriving at a universally accepted definition of the two terms. Some writers tend to discuss causes transient poverty (poverty of the hopeful) to include theft, drought, war, flood and fire. Most researchers discuss causes of poverty from their areas of profession, region or gender. Causes of chronic poverty which is long term and persistent are largely structural. This kind of poverty may be transmitted from one generation to another and it is very persistent (Ogwumike 1995)
In general, the basic causes of poverty in many countries include: macro-economic distortions or inappropriate macroeconomic policies, low or negative economic growth, effects of globalisation, governance, corruption, debt burden, low productivity and low wages in the informal sector, unemployment or deficiencies in the labour market resulting in limited job growth, high population growth rate and poor human resources development etc. These may differ from country to country depending on the level of economic development. Other factors, which have contributed to a decline in living standards and are structural causes or determinants of poverty, include increase in crime and violence, environmental degradation, retrenchment of workers, a fall in the real value of safety nets, and changes in family structures (Obayelu and Ogunlade, 2006).
There is no doubt to the fact that the effects of poverty are not palatable to any country. Poverty has the consequence of breeding social disillusionment with respect to what the societal objectives are, and member’s responsibilities towards attainment of these objectives. Just as ignorance maintains poverty, so also can poverty perpetuate ignorance, since the victims cannot think and plan beyond where the next meal is coming from. Moreover, in a country or locality where the concentration of the bulk of wealth is in few hands, there is serious implication. A society where majority spend almost 90% of their income on consumption and having little or nothing for saving, which could be ploughed back into the economy for re-investment, economic growth would be slow and impeded, since the rate of economic growth is a function of investment through multiplier effects. This means that the group of people affected would not participate effectively in the process of development of that nation. In other words, poverty is a vicious cycle reproducing itself in perpetuity.
Studies have shown that various governments of different countries have formulated and implemented different interventions programmes at alleviating poverty. Hence the level of poverty is blossomy in most of these countries. For instance, in Nigeria between 1980 and 1996 alone there were 16 poverty alleviation institutions in the country some of these institutions were sectoral and others were multi-sectoral in nature (Ajakaiye and Adeyeye, 2001) but with increasing level of poverty from 27.2% to 65.6% in year 1980 and 1996 respectively (Federal Office of Statistics, 2000). The problem as observed therefore is that, the least deprived and the least food insecure among the poor is the one benefiting from most development interventions and the impact on the very poor is nonexistent in most countries. The reason for this is that policy makers and intervention implementers feel more comfortable and certain of success when they select the least poor and, therefore, they almost consistently tend to leave out the very poor, the so-called “creaming” of the poor (Miller et al. 1970; FAO Investment Centre 1992; Safilios-Rothschild 1998; World Bank 2001).
organisations and money lenders, expanding farm holding and diversifying crop types as well as multiple locations of farm, cutting down expenses and demand for material items (i.e reduction in transport costs), eating of seed yams (instead of planting) and sale of farm animals, working harder longer on farms, diversification of occupational activities, raising market prices of farm products, embarking 0n Petty trading either legal or illegal. Such as the sales of dangerous drugs and drinks, changing diet and feeding on wild fruits, sale of own labour and taking menial Jobs in town, begging for arms, stealing, moving from house to house to eat, migration to urban centres, reliance on economic trees, praying and dependency on religions groups etc
These causes, effects of poverty and the failure of most countries at alleviating poverty are similar either in the developing, transition or highly developed countries except in the different ways people from different countries cope with poverty.
Causes and Effects of Underground economy
An underground economy “mirrors the formal [capitalist] economy in that the goal is to produce and distribute goods and services in order to make a profit” making the “legality of one and the illegality of the other” the distinguishing factors. Underground economy does include purely illegal operations that produce purely illegal products such as arms dealers who peddle unlicensed handguns but the two economies can, and often do, intertwine. The International Labour Organization has reported, “majority of people in the informal economy, even though are not registered or regulated, produce goods and services that are legal” (Barber, 2003). Clearly, the underground economy is more complex than media stereotypes or common knowledge might suggest. Activities in this sector can run the gamut from laundering money to underreporting tips, and involve everyone from drug kingpins to rural farmhands. Its moral terrain is complicated and sometimes contradictory. For example, while some government officials have argued against employing illegal immigrants on the grounds that they can easily be exploited, the government itself may refuse citizenship to these same persons, forcing them underground in the first place. Many of the entrepreneurs and individual workers who participate in this economy may not be proud to do so, but in some cases they feel they have little or few sanctioned ways to build up their businesses or generate income. The main causes of the informal economy found in most of the studies were: higher or increased in the burden of taxation, excessive government regulation of economic activities, corruption, social security contribution, poverty and bureaucracy (table 5). This is an indication that there is a causal link between poverty and underground economy. While poverty may leads to underground economy, underground economy may lead to imprisonment when caught and found guilty. Some of the effects of underground economy include: high level of tax evasion, statistical distortions and contraband. Government normally lose billion per year due to the failure of people to report income and pay taxes on it (Bartlett, 1998). Although in some instances, this economy may ironically benefit the infrastructure.
income earned in the shadow economy is subsequently returned to the official economy (e.g., retail spending) resulting in a considerable positive effect on the official economy ( Fichtenbaum,1989; Schneider, Hofreither, and Neck 1989; and Schneider,1999)
Even though the underground economy can clearly benefit small businesses, they are sometimes adversely affected in unexpected ways. Mellor (1997) points out that, while “restrictive laws force entrepreneurs underground,” they then have little hope of growing their businesses or obtaining necessary capital, because they cannot work with legitimate banks or financial institutions. But at the same time, those small businesses that stay above ground, so to speak, may be poorly rewarded for doing so. The Canadian government has offered what seems to be a cautionary list of negative “Consequences of the Underground Economy” which ironically reads like a list of the negatives of staying legal. For example, “people who comply with the law shoulder a heavier tax burden because they must compensate for others in the underground economy,” and “businesses that fulfil their tax obligations face unfair competition from those that do not”. Just as hidden economy has a positive effect on consumer expenditure of non-durables and even stronger positive effect on consumer expenditure of durables (Bhattacharyya, 1993), a growing shadow economy has a negative impact on official GDP growth and a positive impact on corruption. The bigger the corruption, the larger is the shadow economy (Johnson et al, 1998)
Empirical Evidence of the relationship between poverty and underground economy: Nigeria as a case study
Identification of those involved in underground economy was not easy in Nigeria. However, certain number of people were sampled and interviewed on their opinions about underground economy and poverty and the possible causes that may lead them into such shadow economy if not already into it. The results of the empirical analysis as presented in tables 4 and 5 . Table 4 showed that about 29 percent of Nigerian agreed that underground economy is a good venture possibly because such are the activities by which majority of the respondents earned their daily living. Only about 24 percent were undecided with 22 percent strongly disagreed with underground economy as a good activity. On the causes of underground economy and poverty as shown in table 5, there is a causal relationship between underground economy and poverty in Nigeria. The rating analysis shows lack of job within the formal economy, high rate of corruption, economic hardship and lack of enough money for a living as the common causes of both poverty and underground economy. Though other causes such as the government bureaucratic bottlenecks and high tax burden strongly accounts for underground economy in Nigeria but they are however not strong factors affecting poverty in Nigeria. This shows that factors leading to high level of underground economy in developed countries does not necessarily account for the high rates of underground economies in the developing countries like Nigeria with low social security system and burden of taxation not as high as in the highly developed countries but with large underground economy.
Conclusions and recommendations
In view of the reviews and findings, there is a causal link between underground economy and poverty especially in the developing and transition countries. The underground sector related to drug, prostitution and alcohol prohibition has turned out to be weak in many countries, if not counterproductive. Many persons active in the underground economy move more deeply into illegality in order to make detection more difficult. As a result, the underground activities become
While high tax burden, excessive government regulation of economic activities, high social security system, and bureaucracy are some of factors leading to high underground economy in the highly developed countries, high unemployment rates, corruption that causes poverty are some of the factors accounting for large shadow economies in the developing, and transition countries. The developing countries have the highest and increasing rate of underground economy and poverty level when compare to the transitional and OECD countries. Putting all the factors above into consideration, complete eradication of the incidence of poverty and underground economy in our society may not be easily achieved. The authors are of the opinion that most informal sector activities in many countries can neither be term underground nor illegal, as they represent simply a survival strategy by those involved in them . Other conclusion that can be drawn from the analysis is that the higher the overall social security and tax burden, the higher the shadow economy, ceteris paribus. This is evidence from the fact that countries such as Greece, Italy, Belgium and Sweden, who have the largest shadow economies in 1996 also have the highest tax and social security burden (72.3%, 72.9%, 76.0% and 78.6%), whereas countries like Switzerland and U.S., who have the lowest overall tax and social security burden (39.7 and 41.4%) have the lowest shadow economies with 7.5 and 8.8%. But poverty accounts for the large size of shadow economies in the transition and developing countries that do not have such highly developed social security systems. The fight against the underground economy is a recurrent theme in many countries like Nigeria with anti-corruption program, Economic and Financial Crime Commission (EFFCC), National Drug Law Enforcement Agency (NDLEA), National Agency for Food and Drug Administration and Control (NAFDAC). But efforts at reducing underground economy should still be tailored toward poverty reduction, increases in job opportunities within the formal economy probably paid for by the government itself and anti-corruption crusade in both developing and transition countries. Improving the social services like establishment of good schools, provision of shelter, provision of scholarship for the children and setting up of medical centres in both rural and urban areas should be an essential part of any long-term strategy for reducing poverty and underground activities in the developing countries with high rates of poverty.
There is the need for tax policy changes. Government should implement anti-inflationary policies that will reduce the burden created by inflation thereby making most necessary consumer items unaffordable to the poor masses in most countries. Taxes collected effective should be judiciously utilized on physical projects so as to motivate the payers and those on underground economy activities to register their businesses with the government.
Appendix 1: Various perception of the meaning of poverty and underground economy
1. Poverty is humiliation, the sense of being dependent, and of being forced to accept rudeness, insults, and indifference when we seek help.” Another of such views of the poor is that expressed by a poor man in Kenya in 1997 as reported by Narayan et al (2000) thus: “Don’t ask me what poverty is because you have met it outside my house. Look at the house and count the number of holes. Look at my utensils and the clothes that I am wearing. Look at everything and write what you see. What you see is poverty.
2. Poverty could denote a state of deprivation, not having enough to eat, a high rate of infant mortality, a low life expectancy, low educational opportunities, poor water, inadequate heath care, unfit housing and a lack of active participation in the decision making process (Nigeria’s Federal Ministry of Economic Co-operation and Development, 1992).
4. Poverty is perceived by poor Africans to include alienation from the community, food insecurity, crowded homes, and usage of unsafe and inefficient forms of energy, lack of jobs that are adequately paid and/or secure, and fragmentation of the family.
5. Poverty is a condition of deprivation whose manifestations could come in form of seasonality, social inferiority, isolation, physical weakness, vulnerability to shocks, violence and crime, powerlessness and humiliation (Odusola, 2001).
6. The Central Bank of Nigeria (1999) views poverty as “a state where an individual is not able to cater adequately for his or her basic needs of food, clothing and shelter; is unable to meet social and economic obligations, lacks gainful employment, skills, assets and self-esteem; and has limited access to social and economic infrastructure such as education, health, portable water, and sanitation; and consequently, has limited chance of advancing his or her welfare to the limit of his or her capabilities”.
7. The World Bank (2000) utilized inductive approach to uncover dimension of poverty and therefore defined poverty using many indices. One of such definitions is that poverty is “the lack of what is necessary for material well-being especially food, but also housing, land, and other assets. In other words, poverty is the lack of multiple resources that leads to hunger and physical deprivation,” inability to generate income above $2.00 per day.
8. Examining the definition of poverty from the dimension of material well being reveals yet other varying opinions. The case of a 10-year-old child in Gabon in 1997 as stated in Narayan et al (2000) succinctly captures it thus: “when I leave for school in the mornings I don’t have any breakfast. At noon there is no lunch, in the evening I get a little supper, and that is not enough. So, when I see another child eating, I watch him, and if he doesn’t give me something I think I’m going to die of hunger.” The perception of this Gabonese child is akin to the song one old woman claimed her siblings used to sing as a result of lack of food to eat. It is translated thus: “Give me the one I will eat in the afternoon, in the night I am ready to forego food, food, food.”
Material well-being is always relative. While some perceive it in terms of ability to meet basic needs such as the provision of three square meals daily, as in the cases above, few perceive it from ability to educate one’s children, provide clothing for the family and relatively comfortable shelter; yet, some perceive it from ability to respond to emergencies by falling back on ones’ savings. The lack of these things is ordinarily perceived as ill being and by extension, poverty.
9 Underground economy according to the Canadian Encyclopaedia refers to economic transactions among individuals, which are designed to escape detection. it includes all illegal transactions, eg, prostitution and drug transactions as well as evasions of taxation
[image:14.612.149.478.555.703.2]Appendix 2: List of tables
Table 1: Average size of the shadow economy for developing, Transition and highly developed OECD Countries (in percent of GDP) Currency demand approach
Types of Countries
1999-2000 2000-2001 2002-2003
Developing countries
Africa 41.3 42.3 43.2
Central and South America
41.1 42.1 43.4
Asia 28.5 29.5 30.4
Transition countries 38.1 39.1 40.1 South-West pacific
Island
Communist countries 19.8 21.1 22.3
OECD Countries 16.8 16.7 16.3
Source: (1) Schneider, Fredrick (2005): Shadow economies of 145 countries all over the World. Estimation result over the period
199
Table 2: Share of the shadow economy (in % of GDP) of developing OECD and transition countries
Share of the shadow using DYMIMIC and Currency Demand.
Countries
1999-2000 2001-2002 2002-2003 1. Developing
countries (i) Africa
Nigeria 57.9 58.6 59.4
Egypt, Arab Republic 35.1 36.0 36.9
Tunisia 38.4 39.1 39.9
Morocco 36.4 37.1 37.9
Tanzania 58.3 59.4 60.2 Botswana 39.8 40.9 42.3 Mauritania 36.1 37.2 38.0
Lesotho 31.3 32.4 33.3
Mozambique 40.3 41.3 42.4
Namibia 31.4 32.6 33.4
Zimbabwe 59.4 61.0 63.2 South Africa 28.4 29.1 29.5
(ii) Central and South America.
Bolivia 33.4 33.9 34.6
Panama 64.1 65.1 65.3
Peru 59.9 60.3 60.9
Guatemala 51.5 51.9 52.4 Honduras 49.6 50.8 51.6
Brazil 39.8 40.9 42.3
Colombia 39.1 41.3 43.4
Ecuador 34.4 35.1 36.7
Venezuela 33.6 35.1 36.7
Mexico 30.1 31.8 33.2
Paraguay 27.4 29.2 31.4 Costa Rica 26.2 27.0 27.8 Argentina 25.4 27.1 28.9
Chile 19.8 20.3 20.9
(iii) Asia.
Thailand 52.6 53.4 54.1 Philippines 43.4 44.5 45.6 Sri Lanka 44.6 45.9 47.2 Malaysia 31.1 31.6 32.2
South Korea - -
-Israel 21.9 22.8 23.9
Cyprus - -
-Honking 16.6 17.1 17.2
Singapore 13.1 13.4 13.7 Saudi Arabia 18.4 19.1 19.7 Republic of Korea 27.5 28.1 28.8 Yewen Republic 27.4 28.4 29.1
2 Transition Countries (i) Former Soviet
Georgia 67.3 67.6 68.0 Azerbaijan 60.3 47.8 49.1 Moldavia 45.1 47.3 49.4
Ukraine 52.2 53.6 54.7
Russia 46.1 47.5 48.7
Lithuania 30.3 31.4 32.6
Latvia 39.9 40.7 41.3
Estonia 38.4 39.2 40.1
Kazakhstan 43.2 44.1 45.2
Belarus 48.1 49.3 50.4
Uzbekistan 34.1 35.7 37.2
(ii) Central and Eastern Europe
Hungary 25.1 25.7 26.2
Bulgaria 36.9 37.1 38.3
Croatia 33.4 34.2 35.4
Poland 27.6 28.2 28.9
Romania 34.4 36.1 37.4
Slovak Republic 18.9 19.3 20.2 Czech Republic 19.1 19.6 20.1 Serbia and Montenegro 36.6 37.3 39.1
3. OECD Countries
Greece 28.7 28.5 28.2
Italy 27.1 27.0 25.7
Spain 22.7 22.5 22.0
Portugal 22.7 22.5 22.9
Belgium 22.2 22.0 21.0
U.S.A 12.7 12.5 12.2
The Netherlands 13.1 13.0 12.6
Germany 16.0 16.3 16.8
Sweden 19.2 19.1 18.3
France 15.2 15.0 14.5
Canada 16.0 15.8 15.2
Denmark 18.0 17.9 17.3
Japan 11.2 11.1 10.8
Ireland 27.1 27.0 25.7
United Kingdom 12.7 12.5 12.2 Switzerland 8.6 9.4 9.4
Norway 19.1 19.0 18.4
Austria 9.8 10.6 10.9
Australia 14.3 14.1 13.5
Finland 18.1 18.0 17.4
Note: DYMIMIC (Dynamic Multiple-Indicators Multiple-causes) model
Sources: (1) Schneider, Friedrich and Dominik Enste (2000): Informal Economies: Size, Causes, and Consequences, The Journal of Economic Literature
[image:16.612.44.538.616.737.2](2) Schneider, Fredrick (2005): Shadow economies of 145 countries all over the World. Estimation result over the period 1999-2003
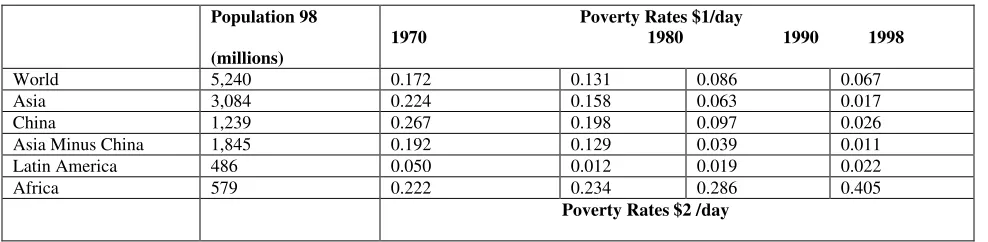
Table 3: comparison of poverty by region and countries of the World
Population 98
(millions)
Poverty Rates $1/day
1970 1980 1990 1998
World 5,240 0.172 0.131 0.086 0.067
Asia 3,084 0.224 0.158 0.063 0.017
China 1,239 0.267 0.198 0.097 0.026
Asia Minus China 1,845 0.192 0.129 0.039 0.011 Latin America 486 0.050 0.012 0.019 0.022
Africa 579 0.222 0.234 0.286 0.405
World 5,240 0.410 0.346 0.258 0.186
Asia 3,084 0.603 0.483 0.297 0.156
China 1,239 0.744 0.565 0.357 0.187
Asia Minus China 1,845 0.494 0.422 0.254 0.135 Latin America 486 0.222 0.105 0.140 0.105
Africa 579 0.530 0.552 0.579 0.636
comparison of poverty in Africa countries based on $1/ day
Nigeria 120.8 0.085 0.166 0.309 0.459
Ethiopia 61.3 0.605 0.565 0.629 0.611
South Africa 41.4 0.059 0.036 0.038 0.043
Tanzania 32.1 0.571 0.528 0.639 0.702
Kenya 29.3 0.500 0.338 0.352 0.350
Uganda 20.9 0.553 0.732 0.492 0.379
Ghana 18.5 0.049 0.110 0.202 0.202
Mozambique 16.9 0.030 0.160 0.271 0.268 Madagascar 14.6 0.084 0.190 0.396 0.506 Cote d’ivoire 14.5 0.065 0.030 0.070 0.049
Zimbabwe 11.7 0.175 0.449 0.115 0.105
Burkina Faso 10.7 0.609 0.534 0.485 0.433
Mali 10.6 0.555 0.461 0.530 0.514
Niger 10.1 0.235 0.279 0.398 0.442
Zambia 9.7 0.192 0.305 0.404 0.516
Sénégal 9.0 0.209 0.223 0.230 0.234
Rwanda 8.1 0.312 0.175 0.195 0.238
Guinea 7.1 0.312 0.175 0.195 0.238
Burundi 6.5 0.356 0.359 0.321 0.511
Sierra leon 4.9 0.423 0.444 0.487 0.591 Central African Rep. 3.5 0.298 0.356 0.452 0.537
Lesotho 2.1 0.461 0.240 0.238 0.234
Botswana 1.6 0.354 0.080 0.012 0.004
Gambia The 1.2 0.251 0.175 0.299 0.353
Gabon 1.2 0.007 0.002 0.002 0.004
Guinea Bissau 1.2 0.506 0.626 0.540 0.611
Mauritius 1.2 0.003 0.001 0.001 0.001
comparison of poverty in Latin America countries based on $1/ day
Brazil 166 0.137 0.019 0.022 0.010
Mexico 96 0.058 0.002 0.001 0.000
Colombia 41 0.038 0.016 0.030 0.035
Peru 25 0.001 0.000 0.013 0.010
Venezuela 23 0.000 0.000 0.001 0.001
Chile 15 0.006 0.005 0.005 0.000
Ecuador 12 0.065 0.002 0.010 0.010
Guatemala 11 0.055 0.021 0.086 0.113
Dominican Republic 8 0.104 0.023 0.039 0.003
Bolivia 8 0.002 0.000 0.055 0.238
Honduras 6 0.002 0.005 0.133 0.301
El Salvador 6 0.005 0.011 0.040 0.025
Paraguay 5 0.228 0.154 0.136 0.128
Nicaragua 5 0.000 0.000 0.069 0.266
Costa Rica 4 0.018 0.004 0.008 0.005
Uruguay 3 0.000 0.000 0.000 0.000
Panama 3 0.115 0.038 0.035 0.006
Jamaica 3 0.009 0.048 0.003 0.002
Trinidad and Tobago 1 0.132 0.001 0.001 0.001
Guyana 1 0.018 0.009 0.055 0.009
Barbados 0 0.013 0.004 0.004 0.003
Source: Xavier Sala-i-Martin (2002): The World Distribution of Income (estimated from individual country
Table 4: Perception of Nigerian on underground economy activities As a good activity Frequency Percentage (%) Agreed Strongly agreed Undecided Not agreed Strongly disagreed 29 10 24 15 22 29 10 24 15 22
Total 100 100
[image:18.612.111.529.318.627.2]Source: Field survey, June 2006
Table 5: Empirical evidence of the relationship between poverty and underground economy in developing country using Nigeria as case study Poverty (frequency of responses) Underground economy (frequency of responses)
Rating of the causes Causes
Poverty Underground economy Lack of education
High tax burden High social security
High rates of government involvement in economic activities Lack of job within the formal economy
Lack of enough money to cope with living Peer group, friends influence
Economic hardship
inconsistent government policy Inequality in income distribution High level of corruption Bureaucratic bottleneck Overpopulation Laziness 20 35 33 13 100 95 9 60 10 70 90 5 50 55 30 80 10 75 100 86 60 85 15 42 92 89 35 50 10 8 9 11 1 3 13 5 12 4 2 14 7 6 12 6 14 7 1 4 8 5 13 10 2 3 11 9
References
Aboyade, O. (1975): On the Need for an Operational Specification of Poverty in the Nigeria Economy. O. Teriba ed., Proceedings of the 1975 Annual Conference of the Nigerian Economy Society, Department of Economics, University of Ibadan.
Aliyu, A. (2002) Re-Structuring of the Poverty Alleviation Activities of the Federal Government of Nigeria National Poverty Eradication Programame Abuja.
Aliyu, A. (2002) “Implementation Progress Report: Background, Structure, Achievements and Problems” A paper presented at a one-day special Presidential Retreat for Permanent Secretaries Ajakaiye D Olu and V.A Adeyeye (2001) “The Nature of Poverty in Nigeria. Technical Report, NISER,
Ibadan
Barber, D.A. (2003,). The ‘new’ economy? Retrieved September; 13, 2005, from http://www.alternet.org/story/14900
Bhattacharyya, D.K (1999): ‘On the economic rationale of estimating the hidden economy.’ Economic Journal, vol. 109, F348-F359.
Bhattacharyya, D. K. (1993): How does the "Hidden Economy" affect consumers` expenditure? An econometric study of the U.K. (1960-1984). International Institute of Public Finance (IIPF), Berlin.
Cagan, Phillip (1958): “The Demand for Currency Relative to Total Money Supply,” Journal of Political Economy, August, 303-328.
Central Bank of Nigeria (CBN) (1999): Nigeria’s Development Prospects: Poverty Assessment and Alleviation Study Central Bank of Nigeria in Collaboration with the World Bank.
CBN (2000): CBN Annual Reports and Statement of Account
Canagarajah, S. (1999): Poverty and Welfare in Nigeria Federal Office of Statistics and World Bank. Doessel and Gounder (1994) “Theory and Measurement of Living Levels: Some Empirical Result for
the Human Development Index” Journal of International Development 6 (4) : 415-435.
FAO Investment Centre. (1992). Sociological analysis in agricultural investment project design. Technical Paper. Rome.
Fichtenbaum, R. (1989). The productivity slowdown and the underground economy, Quarterly Journal of Business and Economics, 28/3 (September), pp.78-90.
Federal Office of Statistics (FOS)(2000): Poverty Profile for Nigeria: 1980 – 1996 in draft national policy on poverty eradication
Feige E. L., (1990), “Defining and Estimating Underground and Informal Economies: The New Institutional Economics Approach,” in World Development, vol. 18, no. 7 (July), pp. 989-1002. Foster, James, J. Greer, and Erik Thorbecke, (1984): “A Class of Decomposable Poverty Measures”,
Econometrica 52:761-66.
Frey, Bruno S. and Werner Pommerehne (1984): “The Hidden Economy: State and Prospect for Measurement,” Review of Income and Wealth, 30:1, pp. 1-23.
Frey, B.S and Friedrich Schneider (2000): Informal and Underground Economy. International Encyclopaedia of Social and Behavioural Science. Elsevier Science Publishing Company. Retrieved August, 24, 2006 from http://www.economics.uni-linz.ac.at/Schneider/informal.PDF
Giles, D. (1997). ‘The hidden economy and the tax gap in New Zealand: a latent variable analysis.’ Discussion Paper 97-8, Department of Economics, University of Victoria.
Hussmanns, Ralf (2001): Informal sector and informal employment: elements of a conceptual framework; Paper presented at the Fifth Meeting of the Expert Group on Informal Sector Statistics (Delhi Group), New Delhi, 19-21 September 2001
data; Paper presented at the Sixth Meeting of the Expert Group on Informal Sector Statistics (Delhi Group), Rio de Janeiro, 16-18 September 2002
International Labour Office (2000): Resolution concerning statistics of employment in the informal sector, adopted by the Fifteenth International Conference of Labour Statisticians (January 1993); in: Current International Recommendations on Labour Statistics, 2000 Edition; International Labour Office, Geneva, 2000
International Labour Office (2002): Effect to be given to resolutions adopted by the International Labour Conference at its 90th Session (2002),) Resolution concerning decent work and the informal economy; Governing Body, 285th Session, Seventh item on the agenda; Geneva, November 2002 (doc.GB.285/7/2)
International Labour Office (2002): Decent Work and the Informal Economy; Report of the Director-General; International Labour Conference, 90th Session; Report VI; International Labour Office, Geneva, 2002
International Labour Office (2002): ILO Compendium of official statistics on employment in the informal sector; STAT Working papers, No. 2002-1;International Labour Office, Bureau of Statistics, Geneva, 2002
Social National Accounts (SNA) (1993): System of National Accounts 1993; Brussels/Luxembourg, New York, Paris, Washington, D.C., 1993
Johnson, Simon; Kaufmann, Daniel; and Andrei Shleifer (1997): The unofficial economy in transition, Brookings Papers on Economic Activity, fall, Washington D.C.
Johnson, Simon; Kaufmann, Daniel; Zoido-Lobatón, Pablo (1998): Corruption, public finances and the unofficial economy. MIT, The World Bank.
Kaufmann, Daniel and Kaliberda, Aleksander (1996): Integrating the unofficial economy into the dynamics of post socialist economies: A framework of analyses and evidence, in: B. Kaminski (ed.), Economic Transition in Russia and the New States of Eurasia, London: M.E. Sharpe, pp.81-120.
Lackó Mária (2000), Hidden Economy – An unknown quantity: Comparative analysis of hidden economics in Transition countries 1989-95, Economics of Transition 8/1, pp.117-149.
Narayan, D. and Petesch P. (2002): Voices of the Poor from Many Lands. World Bank, New York. Narayan, Deepa; Robert Chambers; Meera K. Shah and Patti Petesch. (2000): Voices of the poor: Can
anyone hear us? New York: Oxford University Press. Miller, S.M. et al. 1970. Creaming the poor. Transaction.
Mellor, W. (1997): Is New York City killing entrepreneurship? Retrieved sep 13, 2005, from the Institute for Justice Web site: http://www.ij.org/publications/city_study/CitStud_NY_exsm.html
Obayelu A. E and I. Ogunlade (2006): Analysis of the Uses of Information Communication Technology (ICT) for Gender Empowerment and Sustainable Poverty Alleviation in Nigeria. Journal of Education and Development using ICT. Vol. 2, No 2.
http://www.ijedict.dec.uwi.edu//viewarticle.php?id=172&layout=html
OECD (2002): Measuring the Non-Observed Economy: A Handbook. Jointly authored by OECD, IMF, ILO, and Interstate Statistical Committee of the Commonwealth of Independent States. Paris, 2002 Ogwumike, F.O., (1995). The Effects of Macro Level Government Policies on Rural Development and
Poverty Alleviation in Nigeria. Ibadan, Social Science Journal 1
Odusola A. F. (2001): Conceptual issues in poverty and measurement. Paper presented at the NCEMA Training programme on poverty alleviation policies and strategies. 15-26 October
Portes, Alejandro, and William Haller (2005).”The Informal Economy” in Neil J. Smelser and Richard Swedberg (Editors) The Handbook of Economic Sociology, Chapter 18. Princeton N.J.:
Princeton University Press.
Safilios-Rothschild, Constantina. 1998. Why development does not lead to poverty alleviation. Paper presented at the International Sociological Association Meetings in Montreal.
Schneider, F., and Enste, D. (2002,). Hiding in the shadows: The growth of the underground economy. Retrieved July 13, 2005, from the International Monetary Fund Web site:
http://www.imf.org/external/pubs/ft/issues/issues
Schneider, Friedric (2005): shadow economies of 145 countries all over the World. Estimation result over the period 1999-2003. Journal of Economic Literature.ShadEconomyWorld145_Est.doc Schneider, Friedrich, Markus F. Hofreither and Reinhard Neck (1989): “The Consequences of a
Changing Shadow Economy for the Official Economy: Some empirical results for Austria,” in Dieter Boes and Bernhard Felderer (eds.): The Political Economy of Progressive Taxation. Berlin: Springer, pp. 181-211.
Schneider, F. (1999). Der Sozialstaat zwischen Markt und Hedeonismus?, in: Lamnek, S. und
Schneider, Friedrich and Dominik Enste (2000): Informal Economies: Size, Causes, and Consequences, The Journal of Economic Literature, 38/1, pp. 77-114.
Sen Amartya K.(1976): “Poverty: An Ordinal Approach to Measurement”, Econometrical 46:437-446. Thomas, J. (1999): ‘Quantifying the black economy: ‘measurement without theory yet again.’ Economic
Journal, Vol. 109, F381-F337.
Tanzi, V., (1999): Uses and Abuses of Estimates of the Underground Economy, The Economic Journal 109/456, pp.338-340.
Tokman, Victor (2004): Una Voz en el Camino: Empleoy Equidad en América Latina: 40 Años de Búsque da. Santiago de Chile: Fondo de Cultura Económica.www.Cubanet.org. 2004.
Townsend, P. (1962): “The Meaning of Poverty” The British Journal of Sociology Vol. Xii No. 1 pp. 210 – 270
United Nations (2005) : World Population Prospects. New York: United Nations
United Nations Development Program ( 2002): Nigerian Human Development Report, UNDP Nigeria. Nigeria Oxford University Press
United Nations Development Programme (1990) “Human Development Report”, Oxford University Press, New York.
Walker, Robert. (1994). Poverty dynamics: Issues and examples. Aldershot, England: Avebury and Brookfield; Vermont, USA: Ashgate.
Whelan, Brendan J.; and Christopher T. Whelan. 1995. In what sense is poverty multidimensional? In Beyond the threshold: The measurement and analysis of social exclusion, ed. G. Room. Bristol: The Policy Press.
World Bank (1993):“Poverty Reduction Handbook”. The World Bank, Washington D.C.
World Bank, (1996): Nigeria: Poverty in the Midst of Plenty. The Challenge of Growth with Inclusion. A World Bank Poverty Assessment, Population and Human Resources Division Report No. 14733
World Bank. (2000): World development report 2000/2001. Washington, D.C.: The World Bank.
World Bank (2001): World Development Report 2000/2001 Attacking Poverty. Oxford University Press Inc. New York.
World Bank (2002): Poverty Reduction and the World Bank Progress in Personalizing the WDR 2000/2001 World Bank Washington