On-line Trajectory Classification
Corina Sas1, Gregory O’Hare1, Ronan Reilly2
1
Department of Computer Science, University College Dublin Belfield, Dublin 4, +353 1 716 {2922, 2472}
{corina.sas, gregory.ohare}@ucd.ie
2
Department of Computer Science, National University of Ireland Maynooth, Co. Kildare, +353 1 708 3846
Abstract. This study proposes a modular system for clustering on-line
motion trajectories obtained while users navigate within a virtual environment. It presents a neural network simulation that gives a set of five clusters which help to differentiate users on the basis of efficient and inefficient navigational strategies. The accuracy of classification carried out with a self-organizing map algorithm was tested and improved to above 85% by using learning vector quantization. The benefits of this approach and the possibility of extending the methodology to the study of navigation in Human Computer Interaction are discussed.
1 Introduction
This study is part of ongoing research whose purpose is to identify the procedural and strategic rules governing navigational behaviour within virtual worlds. The present paper investigates the motion trajectories of a set of subjects while they accomplish spatial tasks within a Virtual Environment (VE). Prior studies in the area of spatial cognition were concerned with testing hypotheses about the impact of various factors on spatial knowledge acquisition [3]. However, none of them tried to investigate holistically the motion trajectories themselves. By providing a rich set of primary data, trajectory analysis can support the extraction of valuable information regarding the rules users employ in accomplishing spatial tasks. Moreover, when this analysis is performed in the light of some performance criterion (e.g., time required to perform a search task) it could provide valuable insights into discriminating efficient and inefficient navigational strategies and clustering the users accordingly.
enable poor users to learn the efficient navigation procedures, while for good performers it can be redesigned in order to challenge users’ spatial skills.
Attempts to cluster trajectories have been carried out primarily in the area of visual surveillance, especially novelty detection, with the purpose of identifying suspicious behaviour of pedestrians within an outdoor open area [5], [14]. This goal is directly linked to the idea of automatic surveillance, which would allow the replacement of human operator. In their study, Owens and Hunter have shown that the self-organizing feature map neural network could be successfully employed to perform trajectory analysis by both identifying the characteristics of normal trajectories and detecting novel trajectories [14].
However, trajectory analysis performed on a spatial cognition task represents a novel approach. The objective of this study involves identifying the good and poor motion trajectory and their associated characteristics. What is good and poor is determined in the light of both users’ performance and findings of spatial cognition studies.
Without underestimating the role of traditional clustering methods, we propose the use of Artificial Neural Networks (ANN) as an alternative tool for trajectory classification. Neural networks provide a very powerful toolbox for modelling complex non-linear processes in high dimensionalities [11]. ANNs have many advantages over the traditional representational models, particularly distributed representations, parallel processing, robustness to noise or degradation and biological plausibility [6]. We consider that at least part of these strengths can be harnessed to model user’s navigational behaviour.
2 Cluster Analysis Performed by Artificial Neural Networks
The main goal of cluster analysis is to reduce the amount of data, by subdividing a set of objects into (hierarchical arrangement of) homogeneous subgroups. A significant outcome is reduced complexity with a minimal loss of information which allows a better understanding of the analysed data [12].
An important aspect of any clustering method is the minimisation of classification errors. As Kaski pointed out, [7] one problem usually associated with clustering methods is the interpretation of clusters. Due to their ability to extract patterns and to visualise complex data in a two-dimensional form [7], Self-Organizing Feature Map (SOM) are used to perform the trajectory cluster analysis. Like many other clustering techniques, SOM reduces representations to the most relevant facts, with minimum loss of knowledge about their interrelationships [7].
generalise, meaning that once it is trained, SOM is able to classify new data within the set of clusters previously identified.
Features like the approximation of the probability density function of input space, the identification of prototype best describing the data, the visualisation of the data and the potential to generalise, highly recommend SOM as a basis for on-line automatic extraction of trajectory clusters.
Furthermore the basic features of SOM and Learning Vector Quantization (LVQ) as unsupervised and supervised learning processes respectively are outlined. LVQ is a supervised learning algorithm related to SOM. The SOM and LVQ algorithms have been developed by Teuvo Kohonen and implemented by his team from Helsinki University of Technology, in the form of SOM_pak [9] and LVQ_pak [10]. These comprehensive software package are available online and were used in this study. SOM is based on an unsupervised learning process, allowing both the cluster identification within the input data and the mapping of an unknown – not previously seen – data vector with one of the clusters. This process is carried out without any prior knowledge regarding number and content of the clusters to be obtained [7]. When a set of already clustered input data is available, a supervised learning process can be employed to identify to which class an unknown data vector belongs.
2.1 Self Organizing Maps
A basic SOM consists of an input layer, an output map and a matrix of connections between each output unit and all the input units. The input is usually represented by a multidimensional vector with each unit coding the value from one dimension. Every node from the two-dimensional output layer is associated with a so-called reference
vector (mi), consisting of a set of weights from each input node to the specified output
node. In a simplistic way, each input vector is compared with all the reference vectors and the location of best match in some metric, usually the smallest of the Euclidean distances, is defined as the winner. Around the maximally responding unit, a topological neighbourhood is defined and the weights of all units included in this neighbourhood are adjusted, according to equation (1), where mi is the weight at time
(t+1) and η is the learning rate.
mi ( t + 1) = mi (t) + η [ x(t) – mi (t)] . (1)
The learning process consists of a “winner-takes-all” strategy, where the nodes in the output map compete with each other to represent the input vectors. For this reason, the output layer is also called the competitive layer. Competitive learning is an adaptive process, through which the neurons from the output layer become slowly sensitive to the input data, learning to represent better different types of inputs.
As Kohonen pointed out, [8] a significant property of SOM is the tendency to preserve continuity in terms of mapping similar inputs to neighbouring map locations influenced by the weight vectors trying to describe the density function of the input vectors. As a result of these antagonistic tendencies, the distribution of reference vectors is rather smooth, given the search for an optimal orientation and form to match those of the input vector density. In addition, the greater the variance between the input vector features, the better their representation on the output map. It is expected that these features correspond to the most important dimensions of the inputs.
2.2 Learning Vector Quantization
LVQ consists of an input layer comprising multidimensional vectors described by their features and an output layer whose neurons correspond to the predefined classes. There is also a matrix of connections between each output unit and all the input units, consisting of weights vectors. Since each weight vector corresponds to a class, they are considered as labelled. The basic idea is that input vectors belonging to the same class will cluster in data space, in a form of a normal distribution around a prototype vector. Classifying an input vector consists of computing the Euclidean distance between the considered input vector and all the weight vectors, followed by assigning it to the class associated with a weight vector for which the Euclidean distance is minimum [10].
During training, an adaptive process occurs with respect to the closest weight vector, also called the winning neuron. When both the input vector and the weight vector belong to the same class, meaning that the input vector was correctly classified, the weight vector is modified in order to become a better approximation of the input vector. However, when the input vector is incorrectly classified, the weight vector is adjusted in a way which increases its distance of the input vector (since they belong to different classes).
2.3 SOM versus LVQ
3 Procedure
Virtual Environments (VE) have become a rich and fertile arena for investigating spatial knowledge. Within the VE, the user set of actions is restricted, consisting mainly of navigation and locomotion, object selection, manipulation, modification and query [4]. Through their powerful tractable characteristic [1], VEs enable accurate spatio-temporal recording of users’ trajectory within the virtual space. Attempts to understand spatial behaviour in both real and artificial worlds were primarily concerned with highlighting the symbolic representation of spatial knowledge.
In this study we utilised ECHOES1
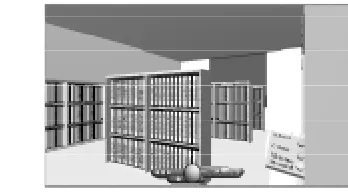
[13], [2] as an experimental test-bed. It is a virtual reality system which offers a small-scale world, dense, static and with a consistent structure. Adopting a physical world metaphor, the ECHOES environment comprises a virtual multi-story building, each one of the levels containing several rooms: conference room (Fig.1), library (Fig.2), lobby etc. Users can navigate from level to level using a virtual elevator. The rooms are furbished and associated with each room there is a cohesive set of functions provided for the user. These features enable ECHOES to offer an intuitive navigational model.
A sample of 30 postgraduates was asked to perform two tasks within the VE. The first, an exploratory task, provided the primary data for the trajectory classification, while the second, a searching task, offered a basis for assessing the quality of exploration and the efficiency of the exploratory strategy. The time needed to search for a particular room acts as a performance indicator.
A comprehensive set of data was recorded throughout the experiment. Each movement greater than half a virtual meter, and each turn greater than 30o, were recorded. This was achieved by the inclusion of a rich set of virtual sensors together with an odometer and rotational event listener [2].
[image:5.595.289.463.495.592.2]
Fig. 1 Virtual Conference Room Fig. 2 Virtual Library
1 ECHOES (European Project Number MM1006) is partially founded by the Information
4 Data Analysis and Results
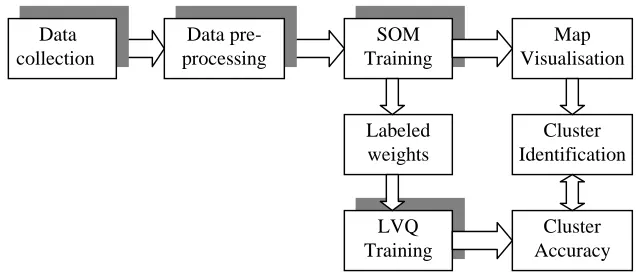
[image:6.595.135.456.264.404.2]The use of SOM [9] and LVQ [10] for performing the trajectory cluster analysis requires several steps: data collection, construction and normalisation of data set, unsupervised training, visualisation of the resulting map, cluster identification, obtaining a set of trained labelled codebook vectors to be used in supervised training and measuring classification accuracy. When all these steps are performed in order to classify online trajectories, they should be automatic and seamlessly intertwine. For this we used the developed several modules serially connected as presented in Fig. 3.
Fig. 3 The modular system for on-line trajectory classification
Collecting Data
The data collection module is based on the listener agent previously developed by Delahunty [2]. The Listener Agent gathers information about user behaviour within the virtual world. The data captured when the user interacts with the ECHOES virtual space contains details of navigation paths through the world and time spent in different rooms.
Pre-processing Data
Data pre-processing consisted of transforming the raw data into a suitable form to be fed into the SOM. In the raw data each trajectory is represented by a multivariate time series. However, we were interested in testing if a static representation of trajectory is sufficient to perform a classification. For this, the reduction of the raw data should be done by preserving their significant features. We choose to represent each trajectory by the degree of occupancy of a predefined set of spatial locations and an extra input node representing the degree of rotating in VE (29 nodes). For the SOM analysis, we overlaid the virtual space with a grid composed of 28 squares of 4×4 virtual meters. Each trajectory was converted to a succession of locations on the grid. The next step necessitated the mapping of each trajectory into a sequence of 28 neurons (one for each location), according to equation (2), where NV is the input node value and LOC is location occupancy expressed as how many times the user revisited that location.
NV = log10 (9 × LOC + 1) . (2)
SOM Training
LVQ Training Labeled weights
Cluster Identification
Map Visualisation
Cluster Accuracy Data
collection
The above transformation allows a clear differentiation between non-visited (NV = 0) and visited locations. In the later case the NV is within the range 1–2, 1 for only one visit and 2 for 11 visits, 11 being the maximum number of times for revisiting a location. Apart of the previous encoding which features the space covering, the trajectories were characterised by the amount and size of users’ rotations. We considered that trajectories characterise by rotation angles greater than 90o present an interesting feature. If a trajectory has more than 10% of the rotation angles equal or greater than 90o, the 29th node of the input vector was set to 3, otherwise it was set on 0.
SOM Training
Once the data were pre-processed, we randomly divided them in two equal subsets, keeping one for training and the other one for the testing. Each set consisted of 63 vectors, comprising encoded trajectories covered by the users on each level.
A SOM of 16×12 neurons was used to perform a topology-preserving mapping. The first phase of training was carried out for 1000 epochs, a radius of 16 and with a learning rate of 0.8, while the second phase lasts 120000, with a learning rate of 0.01 and a radius of 2. The random seed was 275 identified by using the vfind program. These parameters were retained, after we tried more than 50 trainings, with different architectures and learning rates, because they led to the smallest quantization error for the testing set (1.97), while for training set it was 0.35. Quantization error represents the norm of difference of an input vector from the closest reference vector [9].
Maps Visualisation
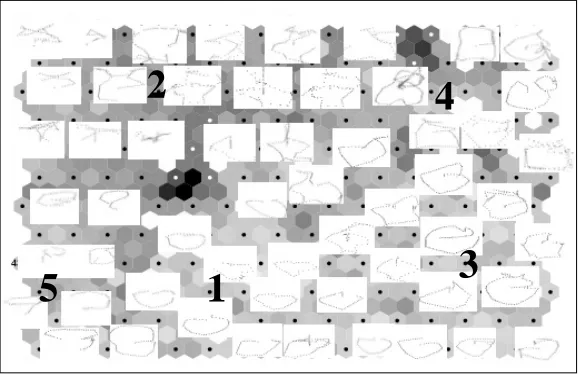
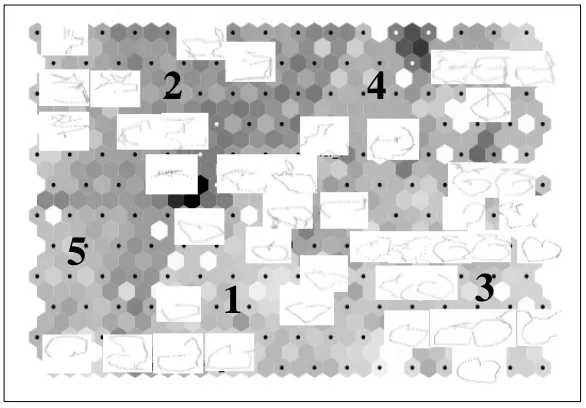
[image:7.595.151.442.489.676.2]The resulting organisation of the map, shown in Fig. 4 and 5 shows five clusters of users, where clustering is on the basis of their navigational pattern within the VE. Figure 4 is associated with the training set of trajectory while Figure 5 with the testing set. Numbers which were associated with the winner neurons within each cluster are replaced by the original corresponding trajectory.
Fig. 4 SOM Map obtained from the training set
1
3
4
2
Fig. 5 SOM Map obtained from the testing set
With respect to visualisation, the SOM provides an additional benefit: the clusters boundaries are represented by darker shades of grey, since they represent larger distances between adjacent neurons.
Cluster Identification
Training the SOM led to five clusters. For their identification, within the area corresponding to each of them, we placed the associated cluster number e.g. cluster number 1 comprises the trajectories within area designated by number 1, located in the middle of the lower half of the map.
Cluster 1 groups trajectories limited to the lower half e.g. two rooms of the spatial layout. These trajectories are generally circular. Some of these trajectories are smooth while other present sharper angles.
Cluster 2 located on top left of the map comprises trajectories which present lots of turnings and usually crossover themselves. These trajectories are completely different than any other group, containing straight lines joined at sharp angles. They do not allow an efficient coverage of the space, are more likely to induce disorientation and accordingly the level of spatial knowledge which can be acquired through them is limited. As it can be seen, there are two sub-clusters that can be identified within this class, whose main distinction resides in the coverage of the space. For some of trajectories, the coverage is restricted to only one room of the space, while the rest of them cover larger space, but rarely going circular. Actually these trajectories are erratic and the user seems anxious to explore the space, e.g. he/she rather moves in
the same area or covers larger space but in this case, it is likely that the returning to
the starting point is achieved through approximate the same path.
5
1
2 4
[image:8.595.149.442.157.361.2]Cluster 3 located on the right part of the second half of the map, consists of very smooth circular trajectories, which have at least one direction towards the centre of the spatial layout. Cluster 4 comprises longer trajectories, which cover most of the spatial layout. They present the “going around the edge” feature, more pronounced than other clusters, except cluster 2. Cluster 5 presents circular trajectories perform within the first half of the spatial layout.
Each set of trajectories, with the exception of cluster 2, proves beneficial along the temporal dimension. Carefully selected and ordered, they enable users to acquire particular spatial knowledge, with a minimum investment of resources.
Previous work in classifying trajectories, performed only on the basis of locations, led to a more detailed classification [15]. However, since the purpose of this analysis is to discriminate between users employing efficient strategies and those navigating through a set of inefficient strategies, we do have to take the rotation angle into account. This leads to a more detailed representation of cluster 2.
Training LVQ
Once the SOM was trained, the codebook vectors could be used for initialising the weights for LVQ algorithm. This did indeed lead to increased classification accuracy from 72% obtained using random initialisation to 87%. In other words, each trajectory from the testing set was correctly classified by the LVQ with 87% accuracy. Within each class, the classification accuracy is slightly different: cluster 1 – 86%, cluster 2 – 100%, cluster 3 – 63%, cluster 4 – 87 % and cluster 5 – 100%. As it can be seen, the trajectories belonging to cluster 2, and which require special attention are correctly classified in each case. This is an important outcome, supporting the goal of our study aiming to discriminate users in terms of good and poor performers of the spatial tasks. This finding should be also emphasised in the light of the fact that more than 50% of trajectories composing cluster 2 are covered by the subjects with worst performance in the searching tasks (bottom 10% female and bottom 10% male).
5 Conclusion
The study shows that the ANN could be successfully employed in modelling spatial behaviour in VE, in terms of classifying users’ motion trajectories performed on-line. Based on this classification, each new user can be associated with one of the clusters, and accordingly identified as employing efficient or inefficient navigational strategies.
beneficial for user modelling in the area of spatial knowledge acquisition. Permitting a comparative analysis between efficient and inefficient navigational strategies, this methodology could suggest how VEs might be better designed. Based on these results, further work will focus on assisting new users to improve their spatial abilities in exploring a new virtual environment. After a period of navigation, SOM would be able to integrate the online trajectory within the appropriate cluster. If the user’s trajectory history matches, for example, cluster no. 2, the system will assist the user in his/her further exploration. Thereafter this guidance will improve user exploration. Alternatively real-time dynamic reconstruction of the VE could assist the user in their tasks.
References
1. Amant, R.S., Riedl, M.O.: A practical perception substrate for cognitive modelling in HCI. International Journal of Human Computer Studies 55(1) (2001) 15-39
2. Delahunty, T.: ECHOES: A Cohabited Virtual Training Environment. Master Thesis, Department of Computer Science, University College Dublin (2001)
3. Freksa, C., Habel, C., Wender, K.F. (eds.): Spatial Cognition, An Interdisciplinary Approach to Representing and Processing Spatial Knowledge. Lecture Notes in Computer Science, Vol. 1404. Springer-Verlag, Berlin (1998)
4. Gabbard, J., Hix, D.: Taxonomy of Usability Characteristics in Virtual Environments, Final Report to the Office of Naval Research (1997)
5. Grimson, W., Stauffer, C., Lee, L., Romano, R.: Using Adaptive Tracking to Classify and Monitor Activities in a Site, Proceedings IEEE Conf. on Computer Vision and Pattern Recognition (1998) 22-31
6. Haykin, S.: Neural Networks: A Comprehensive Foundation. Prentice-Hall New Jersey (1994) 7. Kaski, S.: Data exploration using self-organizing maps. Acta Polytechnica Scandinavica,
Mathematics, Computing and Management in Engineering Series No. 82, Finnish Academy of Technology (1997)
8. Kohonen, T.: Self-organizing maps. Springer Series in Information Sciences, Vol. 30, Springer-Verlag Berlin (2001)
9. Kohonen, T., Hynninen, J., Kangas, J., Laaksonen, J.: SOM PAK: The Self-Organizing Map program package, Report A31, Helsinki University of Technology, Laboratory of Computer and Information Science (1996)
10. Kohonen, T., Hynninen, J., Kangas, J., Laaksonen, J., Torkkola, K.: LVQ PAK: The Learning Vector Quantization Program Package. Version 3.1. Helsinki University of Technology, Laboratory of Computer and Information Science (1995)
11. Lint, H. van, S.P. Hoogendoorn, H.J. van Zuylen: Freeway Travel Time Prediction with State-Space Neural Networks, Preprint 02-2797 of the 81st Annual Meeting of the Transportation Research Board, Washington D.C. (2002)
12. Lorr, M.: Cluster analysis for social scientists. Jossey-Bass Publishers, San Francisco (1983) 13. O’Hare, G.M.P., Sewell, K., Murphy, A.J., Delahunty, T.: ECHOES: An Immersive Training Experience. Proceedings of Adaptive Hypermedia and Adaptive Web-based Systems (2000) 179–188
14. Owens, J., Hunter, A.: Application of the self-organizing map to trajectory classification. Proc. of the 3rd IEEE Workshop on Visual Surveillance (2000) 77-83