Dissociation of the N400 component between linguistic and
non-linguistic processing: A source analysis study
Anne Gallagher1,2, Renée Béland2, Phetsamone Vannasing1, Maria Luisa Bringas3, Pedro Valdes Sosa4, Nelson J. Trujillo-Barreto4, John Connolly5, Maryse Lassonde1,2
1
CHU Ste-Justine Research Center, Montreal, Canada 2
Centre de Recherche en Neuropsychologie et Cognition, Psychologie Department, University of Montreal, Montreal, Canada 3
International Center for Neurological Rehabilitation (CIREN), Havana, Cuba 4
Centro de Neurosciencias, Havana, Cuba 5
Language, Memory & Brain Laboratories, Department of Linguistics & Languages, McMaster University, Hamilton, Canada
Ema
Received 10 October 2013; revised 10 November 2013; accepted 18 November 2013
Copyright © 2014 Anne Gallagher et al. This is an open access article distributed under the Creative Commons Attribution License, which permits unrestricted use, distribution, and reproduction in any medium, provided the original work is properly cited. In accor-dance of the Creative Commons Attribution License all Copyrights © 2014 are reserved for SCIRP and the owner of the intellectual property Anne Gallagher et al. All Copyright © 2014 are guarded by law and by SCIRP as a guardian.
ABSTRACT
The N400 component is commonly associated with the detection of linguistic incongruity. A few studies have shown that the N400 can also be elicited by non-lin- guistic stimuli. Different spatiotemporal patterns were observed between the typical Linguistic N400 and the Non-linguistic N400, suggesting distinct brain generators. The aim of this study was to investigate the presence of an N400 in response to linguistic and non-linguistic stimuli, and to specify anatomical sources of both N400s using a novel analysis method: the Bayesian Model Averaging (BMA) distributed source model. Picture-word and environmental sound- picture associations, either congruent or incongruent, were presented to ten young healthy adults while high- density ERP recordings were made. Standard electro- physiological analyses confirmed that the N400 was not specific to linguistic incongruity but was also elic-ited by environmental sound-picture incongruities. Different topographic distributions were obtained for the Linguistic N400 and Non-linguistic N400. BMA analysis showed that the Linguistic N400 generators were mostly located in the left superior temporal gyrus, whereas the sources of the Non-linguistic N400 were identified mostly in the right middle and supe- rior temporal gyri. Detection of linguistic incongrui- ties recruited cerebral areas commonly associated with language processing, whereas non-linguistic in- congruities recruited right cerebral regions usually associated with auditory processing of non-linguistic stimuli. The Linguistic and Non-linguistic N400s ap- pear to be elicited by similar cognitive mechanisms
assumed by different cerebral areas depending on the type of material to be processed. The present findings support the existence of parallel pathways for the processing of linguistic and non-linguistic incongrui- ties.
KEYWORDS
Event-Related Potentials; Incongruity; Semantic; Environmental Sounds; Distributed Source Model; BMA
1. INTRODUCTION
Event-related potentials (ERPs) provide an online meas- ure of cortical activity [1] and have been useful in study- ing cognitive processes. Some ERP components, such as the N400, can provide specific information associated with semantic processing. The N400 is a negative deflec-tion, which peaks between 350 and 600 ms after stimulus onset [2-4]. This component was originally observed when subjects read sentences that ended with semanti-cally incongruent words (for example: “I take my coffee with cream and engine”) [5,6]. The N400 would then reflect the participant’s reprocessing of the unusual sen-tence ending. Kutas and Hillyard [7] further showed that the degree of unpredictability, and not only that of se-mantic incongruity, could increase the amplitude of the N400 (for example: “The bill was due at the end of the hour”).
gesture pairs [11]. For instance, Connolly et al. [10] us-ing a computer-based adaptation of the Peabody Picture Vocabulary Test-Revised (PPVT-R) [12], presented a picture and an auditory word stimulus with a 700 ms onset asynchrony. Half of the picture-word pairs were correctly associated (e.g. the auditory word stimulus “ball” presented with the picture of a ball), whereas the other half of pairs were incorrectly associated (e.g. the auditory word stimulus “car” presented with the picture of a ball). Incorrectly associated pairs elicited signifi-cantly larger N400 amplitudes than correctly associated pairs. A French adaptation of this task was developed for the present study.
Although the vast majority of the studies on the N400 were carried out in the language domain, the N400 com- ponent can also be elicited in response to detection of incongruity involving non-linguistic meaningful stimuli, such as line drawings [13,14], photographs [15], faces [16-19], arithmetic equations [20,21], environmental sounds [22-30], and even odors [31,32]. Interestingly, different spatiotemporal patterns were observed for the typical Linguistic N400 and the Non-linguistic N400. The Linguistic N400 component is defined as a centro- parietal negative wave [5,33], whereas the Non-linguistic N400 is defined as a fronto-central negative component [13,14,22,30]. A right-greater-than-left asymmetry was associated with the Linguistic N400 [5,33], whereas the opposite left-greater-than-right asymmetry was reported for the Non-linguistic N400 [22,26,27,30,34]. As for the differences in the temporal pattern, a shorter latency was observed for the Non-linguistic N400 compared to the
Linguistic N400 [22,23,27].
[image:2.595.57.546.491.738.2]Source localization (or source reconstruction) enables the investigation of the neural generators of ERP com-ponents. Localization of these generators involves ad-dressing the EEG Inverse Problem. This consists in the estimation of the distribution of the Primary Current Density (PCD) inside the brain that produces a given measured EEG. There are infinite solutions to this prob-lem and thus specific additional prior information (or constraints) about the EEG generators must be included in order to obtain a unique and physiologically valid so-lution. Depending on the type of prior information used, there is a whole spectrum of different methods available. Some methods handle the many-to-one nature of this problem (many parameters to estimate and very few data available) by characterizing the sources in terms of a limited number of current dipoles (dipolar model) that are fitted to the data through the minimization of some measure of the reconstruction error [35-38]. In such models, each dipole represents the summed activity of a small cortical region and assumes that these dipoles vary only in strength over time[39]. Over the last fifteen years, a number of studies attempted to localize the generators of the Linguistic N400 using different models for source localization. A summary of the results of these studies is reported in Table 1. For example, using a dipolar model approach, three MEG studies identified a left post-ero-superior temporal lobe source for the Linguistic N400 [40-42] while a fourth MEG study [43] reported bilateral auditory cortex generators for the same compo-nent. EEG studies using a dipolar model localized the
Table 1.Linguistic N400 source analysis literature review (in alphabetic order) from dipole and distributed source models. Lt = left; Rt = right.
Previous studies Linguistic N400 cerebral generators
Dipole model
D’Arcy et al. 2004 [44] D’Arcy et al. 2005 [45] Dien et al., 2010 [46] Hamm et al. 2002 [47] Helenius et al. 1998, 1999 [40,41]
Mäkela et al. 2001 [43] Silva-Pereyra et al. 2003 [48]
Simos et al. 1997 [42]
Lt perisylvian cortex Lt perisylvian cortex Bilateral anterior medial temporal lobe Rt frontal and bilateral temporal generators
Lt postero-superior temporal lobe Bilateral auditory cortex generators
Bilateral inferior, middle, and superior temporal regions, inferior frontal and insular areas, anterior cingulated, occipito-temporal and occipital areas
Lt postero-superior temporal lobe
Distributed source model
Bölte et al., 2010 [49] Giglio et al., 2013 [50] Haan et al. 2000 [51] Halgren et al. 2002 [52] Khateb et al. 2007, 2010 [53,54]
Proverbio et al. 2009 [55] Qiu et al. 2008 [56] Ren et al. 2009 [57] Schulz et al. 2008 [58] Travis et al., 2013 [59]
Lt temporal lobe
Lt temporal pole, Lt supramarginal gyrus and Lt inferior frontal gyrus No specific localization
Wernicke’s area (Lt hemisphere) Bilateral middle/superior temporal gyrus
Lt and Rt fusiform gyrus, Lt cingulate gyrus, Rt limbic area, Rt middle temporal gyrus and Lt middle frontal gyrus Left fusiform gyrus
Lt medial frontal area Left anterior source localization
sources of the Linguistic N400 along the left perisylvian cortex [44,45], bilateral anterior medial temporal lobe [46] or in bilateral superior temporal gyrus [47], while Silva-Pereyra et al. [48] reported a very wide distribution of Linguistic N400 sources in bilateral inferior, middle, and superior temporal regions, inferior frontal and insu-lar areas, anterior cingulate as well as occipito-temporal and occipital areas.
The growing experimental evidence about the exis-tence of more diffuse brain networks has led to the emer- gence of a second method for source localization: the so-called distributed inverse solutions (DIS). These solu-tions address the non-uniqueness of the EEG inverse pro- blem by using both anatomical and mathematical con-straints. The anatomical constraints assume that the EEG sources are located in those brain regions capable of ge-nerating voltage fields over the scalp surface (gray matter for example), while the mathematical constraints make physiologically based assumptions about the mathemati-cal properties of the solution obtained (like maximum spatial smoothness as in LORETA, for more details see [60] Trujillo-Barreto et al., 2004).
Several studies reported in Table 1 used a DIS ap-proach to localize the sources of the Linguistic N400. For instance, Halgren et al. [52] visually presented sen-tences ending with semantically congruous or incon-gruous words to healthy adults during MEG recording. They found a Linguistic N400 occurring at around 250 ms that originated from the left Wernicke’s area, lying in or near the superior temporal sulcus. The N400 activa-tion then spread at about 270 ms to the anterior temporal sites and later on, at about 300 ms, to Broca’s area and, finally, at about 370 msec, to the anterior orbital and fronto-polar cortices. In another study, Schulz et al. [58] who used LORETA and LAURA source localization al-gorithms with EEG data, reported that the generators of the Linguistic N400 elicited by their sentence-reading task were predominantly located in the left anterior mid-dle temporal area. Similarly, Giglio et al. [50] and Travis
et al. [59] found a left fronto-temporal N400 source dis-tribution using distributed source models. However, Khateb et al. [53] investigated, using LAURA, source localization of N400s elicited from different linguistic tasks including different stimulus types (words vs. im-ages) and showed the involvement of the bilateral mid-dle/superior temporal gyrus in all tasks. Hamm et al. [47], who used the LORETA source localization algorithm, reported right frontal and bilateral temporal generators, whereas Haan et al. [51] found a very broad and scat-tered distribution for the generators of the Linguistic N400, which they attributed to important inter-individual differences impeding accurate localization of the sources.
To sum up, investigation of the Linguistic and Non- linguistic N400 components revealed differences in their
spatial distribution. For the Linguistic N400, findings of the studies reported in Table 1 show a tendency to local- ize more commonly sources of the Linguistic N400 in the left temporal lobe. Nonetheless, the results regarding the localization of the generators of the Linguistic N400 from these studies show some inconsistencies. The dis- crepancy may stem, either from differences in the tasks that were used to elicit the Linguistic N400, some of these tasks included linguistic and non-linguistic stimuli within the same experimental paradigm, or from differ- ences in the models and algorithms that were used for source localization. Development of more reliable and adapted DIS for late component such N400 is thus needed.
To our knowledge, no electrophysiological studies have so far been conducted in order to localize the cere-bral generators of the Non-linguistic N400 elicited by environmental sounds. The only source of information comes from a study by Kotz et al. [61] who reported that a N400 was elicited by meaningful environmental sounds in healthy adults but not in patients with either left or right anterior temporal lobe lesion. The present set of experiments aims to clarify whether or not the Linguistic and the Non-linguistic N400 are distinct components generated by different groups of neurons. Among the non-linguistic sounds, environmental sounds are those that received the most attention. Environmental sounds are construed as the best non-linguistic stimuli homo-logous to human speech because they have a complex spectral structure, and they are easily identifiable [62]. Results of the studies conducted with brain-damaged patients [63] as well as with normal subjects using fMRI [64] or PET [62,65,66] suggested that environmental sounds are mostly processed in the right hemisphere. Environmental sounds are thus well-suited stimuli to use in a task eliciting a Non-linguistic N400, because the generators of this component are likely to be located in the right hemisphere, in contrast with the Linguistic N400 whose generators are generally located in the left hemisphere [40,42,44,52].
The present study constitutes the first attempt to inves-tigate anatomical sources of both the Linguistic N400 and Non-linguistic N400 (elicited by an environmental sound-picture task). To this end, picture-auditory word and environmental sound-picture pairs that were errone-ously or correctly matched were presented to participants during ERP recording. Source analyses based on a dis-tributed Bayesian model averaging (BMA) approach [60] were performed on both N400 components.
matching task. The Bayesian paradigm allows estimating the posterior probability of each model given the data, which represents a measure of “how good” that model is for explaining the data. This measure of goodness ex-presses a trade off between goodness-of-fit (data recon-struction error based on that model) and complexity (number of parameters used by the model to explain the data) of the model. The number of parameters of the given model is proportional to the total number of voxels contained in the anatomical regions used to constrain the inverse solution in that model. That is, higher probabili-ties are assigned to the simpler models that explain the data better. Then, the model uncertainty is taken into account by averaging the primary current densities (PCDs) obtained for each particular anatomical con-straint (or model) weighted by their model posterior probabilities. This weighted average provides a PCD, which is unconditional on any of the anatomical con-straints assumed. In this approach, the solution under each anatomical constraint is obtained using the tradi-tional LORETA method [69].
2. MATERIALS AND METHODS
2.1. Participants
The sample was composed of 10 young healthy adults (five males, age range = 20 - 28 years with a mean age of 24.78 years). All participants were native speakers of Canadian French. The data from one male participant had to be rejected because of electrophysiological arte- facts. Informed consent was obtained from all partici- pants prior to their inclusion in the study. The project was approved by the Ethics Committees of the Sainte- Justine and Notre-Dame University of Montreal Hospital Centers. Moreover, all participants gave their informed consent prior to their inclusion in the study.
2.2. Tasks and Stimuli
All participants performed two tasks 1) the environ- mental sound-picture matching task, which consisted of determining whether a presented picture was congruent or not to an environmental sound (non-linguistic task) and 2) the picture-auditory word matching task, consist- ing in determining whether an auditory word was con- gruent or not to a picture (linguistic task).
2.2.1. Environmental Sounds
The 180 environmental sounds (for example, bird songs, car noises, waterfall sounds, etc.) used in this study were taken from the Sounds Effects Library created by Lucas-Film Ltd & Sound Ideas. Onset and offset of each sound was determined using Cool Edit ProTM software allowing the creation of sounds that lasted exactly 2383 ms. Envi-ronmental sounds were presented with Optimus 40232
model XTS24 speakers at 75 dB. Ninety environmental sounds were correctly associated to a picture (e.g. the noise of a truck paired with the picture of a truck) and 90 others were incorrectly paired to the same set of pictures (e.g. a laugh, paired with the picture of a truck).
2.2.2. Words
All 180 words were digitally recorded in stereo in a male voice using Cool Edit ProTM software. Word duration varied from 327 to 1104 ms, with a mean duration of 684 ms. Onset and offset of each word were determined visu-ally with PRAATTM software based on the word’s digi-tized waveform, allowing precise cutting of each word. Words were presented with Optimus 40232 model XTS24 speakers at 75 dB. The 90 auditory words cor-rectly associated with a picture were taken from the
Échelle de Vocabulaire en Images Peabody (EVIP)[70]. The 90 words that were erroneously matched to the same set of pictures were selected from different word lists [71-74]. They were paired with the set of congruent words based on acquisition age, number of syllables, lexical category, and the phonetic features of the first phoneme, which was either a voiced or unvoiced stop (e.g. b, t) or voiced or unvoiced fricative (e.g. v, f). In the incongruent pairs, the auditory word and the picture did not belong to the same semantic category nor did they share phonological similarity. For instance, the picture of a boat (the French word for boat is “bateau”) was paired with the heard word “gorille” (meaning “gorilla” in Eng-lish).
2.2.3. Pictures
All 180 pictures paired with auditory stimuli (environ-mental sounds and words) were simple black and white drawings of 420 × 315 pixels (a visual angle of approxi-mately 7 degrees) taken from the EVIP, the French ver-sion of the PPVT-R, and from various web sites. Pictures derived from EVIP A and B booklets were selected among items from lowest performance levels and were electronically digitized with ScanJet 5300C HPTM and PrecisionScanTM 3.03 software. All pictures were resized to a 1024 × 768 pixels resolution using Adobe Photoshop software and were presented in the middle of a ViewSonic Professional Series P225F screen (refreshing rate of 75 Hz), which was placed 85 cm from the subject. Timing and sequence of pictures were controlled by a computer using MatLab 6.5 software and auditory stim-uli were presented by a Tucker-Davis System (RP2.1; Real-time Processor). In each task, all pictures were pre-sented twice because the same set of pictures was used for both congruous and incongruous pairs.
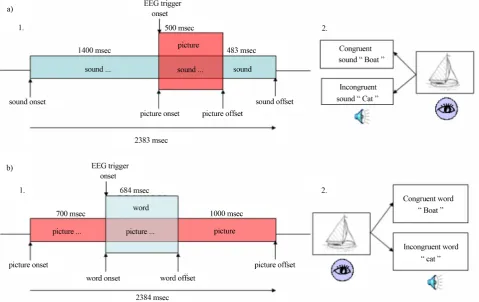
in-dicated that the N400 was best elicited with the sound preceding the picture in the environmental sound-picture matching task and the opposite was found for the pic-ture-auditory word matching task. Figure 1(a) illustrates the procedure used in the environmental sound-picture matching task. Ninety pictures were paired with a con-gruent and an inconcon-gruent environmental sound. Each trial consisted of an environmental sound, which ap-peared 1400 ms before the picture onset and remained audible during picture presentation and 483 ms after the offset of the picture. The duration of the picture presen-tation was 500 ms. A trigger was placed at the beginning of the presentation of each picture and was used to time-lock EEG sampling to picture onset.
In the picture-auditory word matching task (see Fig- ure 1(b)), another set of 90 pictures was paired with a congruent and an incongruent word. Each trial consisted of a picture, which appeared 700 ms before the onset of the auditory word and remained visible during the audi-tory word presentation (mean duration was 684 ms) and
1000 ms after the offset of the word. A trigger was placed at the beginning of each word and was used to time-lock EEG sampling to word onset.
The Linguistic N400 is elicited by auditory stimuli (picture-auditory word matching task) whereas the Non-linguistic N400 is evoked by pictorial material (en-vironmental sound-picture matching task). In previous studies, both pictorial stimuli and auditory stimuli have been found to elicit similar N400-like effects in response to semantic mismatch [15]. Nevertheless, a paired Hotel-ling T2 test (incongruent versus congruent) was applied on the data of each task in order to eliminate common and other early components when performing source analyses (see extended description in the Source Analys-es Section).
2.3. Procedure
[image:5.595.61.541.344.646.2]Participants performed both the picture-auditory word matching and environmental sound-picture matching tasks in dim light while sitting in a comfortable chair in a
sound-proof, electrically shielded room. Both tasks were composed of 4 practice trials followed by 180 experi-mental trials, and were administered during electro-physiological recording (see “Electroelectro-physiological re-cording” section). The order of trial presentation was pseudo-randomized for both tasks; all trials were pre-sented randomly with the exception of trials with the same picture, which were separated by at least one other trial. A 2-second inter-trial interval consisted of a blank screen with a central fixation cross (“+”). Tasks were divided in four blocks of 45 trials, for a total of 180 ex-perimental trials for each task. Since each trial had a du-ration of 4383 ms, each block had a total dudu-ration of ap-proximately 197 seconds (apap-proximately 3 minutes 29 seconds). Short periods of rest (1 - 2 minutes) were given to participants between blocks to reduce fatigue and eye strain. All participants performed both tasks twice in order to increase the total number of trials from 180 to 360 in each task, for a total duration of approximately 60 minutes including inter-block and inter-task periods of rest. The total testing duration did not exceed two and a half hours including electrode placing, experiment, and electrode location digitalization. During the placing of the electrodes and the subsequent digitalization, which both took approximately 60 minutes; the participant was quietly watching a movie.
During both tasks, the participant responded bimanu-ally on a keyboard to each trial by pressing two green buttons when the auditory and visual stimulus associa-tion was congruent, and by pressing two red buttons when the association was incongruent. A bimanual re-sponse was selected in order to eliminate unilateral cor-tical activation that would have been associated with mono-manual responses. All participants were asked to avoid blinking while the sound was audible (environ-mental sound-picture matching task) or the picture was visible (picture-auditory word matching task), and to blink between trials, if needed.
The environmental sound-picture matching task was administered prior to the picture-auditory word matching task in order to prevent as much as possible, the subjects from verbalizing the visual and auditory stimuli of the environmental sound-picture matching task. Indeed, the picture-auditory word matching task involved heard words that automatically recruit language processing. Hence, the administration of the picture-auditory word matching task prior to the environmental sound-picture matching task would likely have accustomed and en-couraged the participant to adopt a linguistic strategy in performing the subsequent environmental sound-picture matching task.
2.4. ERP Recordings and Analyses
EEG activity was recorded from 128 Ag/AgCl electrodes
with a NeuroScan Synamps 2TM system at a sampling rate of 500 Hz with a bandpass filter of 0.1 - 100 Hz and a central reference. The electrodes were embedded in a 128 NeuroScan Quick-CapTM. Impedances were main-tained at or below 5 kΩ during the whole recording ses-sion and an electrode placed in the frontal area (between AFz and Fz) served as ground. Vertical and horizontal eye movements were recorded using external electrodes placed above, under, and on the outer canthus of both eyes. Heart rate and muscular activity were also recorded from, respectively, left and right electrodes placed on Erb point and on both sides of the neck. Evoked potentials were recorded with Neuroscan 4.3 software (Compum-edics, USA).
Location of each electrode and three fiducial points (nasion, and left and right preauricular) was digitized and recorded with BrainsightTM Frameless system (Rogue Research, Montreal, Canada) on a Macintosh G4 com-puter to allow for source analysis.
EEG recordings were analysed using the Brain Vision Analyser program (Brain Products, Munich, Germany). A digital band pass filter of 0.1 - 30 Hz and 24 dB/octave, as well as ocular correction [75] were applied off-line. Data were referenced to the averaged signal of all elec-trodes. The continuous EEG recordings were then ep-oched beginning 200 ms before, and ending 1000 ms after stimulus onset (601 data points). Segmented data were corrected using an artefact rejection (threshold of ±100 µv). Data were averaged across trials for each ex-perimental condition after baseline correction using the 200-ms time segment before stimulus onset.
The N400 component was scored as the most negative peak occurring between 325 and 475 ms for the envi-ronmental sound-picture matching task and between 375 and 500 ms for the picture-auditory word matching task. N400 peak amplitudes were measured as the voltage difference between the mean activity for the 200-ms baseline period before stimulus onset and the most nega-tive point within the specified latency range. N400 peak latencies corresponded to the time from stimulus onset and to the most negative point within the specified la-tency range. Topographical maps (Brain Vision) were computed from the normalized amplitude data [76,77].
2.5. Source Analyses
EEG data collected from each task (linguistic and non- linguistic) and condition (incongruent and congruent) were processed separately. After averaging over all ac- cepted trials, the specific N400 peak latency for each subject was identified as described in the previous sec- tion. Source analyses were performed individually at the N400 peak latency, on each task and condition separately using BMA approach.
(primary current density) for each individual scalp topo-graphy, for each task and condition, was estimated by BMA of different EEG inverse solutions (see [60] for details), each one based on anatomical constraints de-rived from the Montreal Neurological Institute MNI av-erage-brain atlas. Individual lead fields were calculated using the Reciprocity Theorem [78], with a three spheres and isotropic conductivities head model [79,80]. A con-straint-independent final image of the underlying brain electrical activity related to each task and each condition was then obtained by averaging all computed primary current densities weighted by the corresponding support that they received from the data. This weighting coeffi-cient was measured in terms of the posterior probability of the corresponding model (anatomical constraint), giv-en the data. In order to measure statistical differgiv-ences between both incongruent and congruent conditions of the currents estimated [(x, y, z) components] at each voxel, we used paired Hotelling T2 statistic tests for each task separately. Based on previous peak detection ana- lyses (see section “ERP analyses”), the paired Hotelling T2 statistic test was applied in a time window between 325 and 475 ms for the non-linguistic task and between 375 and 500 ms for the linguistic task. The threshold for the resulting statistic parametric map was selected using false discovery rate [81] with q = 0.1. This test provided inverse solution statistical maps comparing both condi-tions for each task separately. Individual and Grand Av-erage inverse solutions were visualized using the Brain Electrical Tomography (BET) viewer software (Neuronic S.A.), which integrates the functional information vided by the EEG with the anatomical information pro-vided by the MRI.
3. RESULTS
3.1. Behavioral Analyses
Success rates for both tasks were measured to ascertain that the participants’ attention level was acceptable and that they were performing the task adequately. Individual success rates varied between 91.11% and 99.72% for the environmental sound-picture matching task, and be- tween 96.39% and 100% for the picture-auditory word matching task. On average, participants could accurately recognize 96.98% ± 3.22% of the congruent/incongruent stimulus pairs of the environmental sound-picture match- ing task and 98.73% ± 1.63% of congruent/incongruent stimulus pairs during the picture-auditory word matching task. No difference was found between congruent and incongruent trials. Although a Student t test for task dif-ficulty difference did not reach significance (t9 = 2.271, p
= 0.053), the performance during the picture-auditory word matching task tended to be slightly higher than that observed for the environmental sound-picture matching
task.
Following testing, the participants were questioned to determine if they had used different strategies when per-forming the two tasks. They indicated that during the en- vironmental sound-picture matching task, they tried to visualize the object corresponding to the sound they were hearing whereas during the picture-auditory word mat- ching task, they silently anticipated the word correspon- ding to the picture being presented.
3.2. Standard Electrophysiological Analyses
Considering the high success rates obtained for both tasks, ERP analyses were conducted on all trials. More- over, less than 10% of all trials were rejected due to arti- fact or ocular correction. Figure 2 shows the grand-av- erage ERPs obtained when averaging the responses eli- cited by each stimulus for all participants during Figure 2(a) picture-auditory word matching tasks and Figure 2(b) environmental sound-picture.
On average, the N400 elicited by the environmental sound-picture matching task (Figure 2(b)) began at around 298 ms post-stimulus onset. The largest N400 amplitude was found at FCz and had an amplitude of −3.603 µV with a latency of 360 ms for the incongruent condition and an amplitude of −2.638 µV with a latency of 352 ms for the congruent condition. A fronto-central topographi-cal distribution was observed for the Non-linguistic N400 (Figure 2(b)).
The N400 component waveform found in the pic- ture-auditory word matching task (Figure 2(a)) began on average at approximately 342 ms post-stimulus onset. The largest N400 was found in Cz where the amplitude was on average −1.485 µV with a latency of 414 ms for the incongruent condition and 0.097 µV with a latency of 416 ms for the congruent condition. The Linguistic N400 presented a centro-parietal distribution (Figure 2(a)).
Because previous work suggested that presentation of the same stimuli can reduce the amplitude and shorten the duration of the N400 (e.g. [82,83], split-half analyses on amplitude and latency data as well as on success rates were computed to address the issue of habituation. An ANOVA with time (1 versus 2) and condition (congruent versus incongruent) as factors revealed that N400 ampli- tudes and latencies did not differ between both adminis- trations of the protocol (p > 0.1). Furthermore, perfor- mance did not improve with increased exposure to the task, as indicated by near zero statistical values for Time. Therefore, all 360 trials of both tasks were used in fur- ther analyses.
3.2.1. N400 Latency
Figure 2. Grand-average ERPs obtained when averaging the responses elicited by each stimulus for all participants during both tasks. (a) Linguistic task. The largest Linguistic N400 was found in Cz where the amplitude was on average −1.485 µV with a latency of 414 ms for the incongrent condition (black line on the graph) and 0.097 µV with a latency of 416 ms for the congruent condition (red line on the graph). As shown on the right (a), the Linguistic N400 presented a centro-parietal distribution; (b) Non-linguistic N400 and its topography. The largest Non-linguistic N400 amplitude was found at FCz and had an amplitude of −3.603 µV with a latency of 360 ms for the incongruent condition (black line on the graph) and an ampli-tude of −2.638 µV with a latency of 352 ms for the congruent condition (red line on the graph). A fronto-central topographical distribution was observed for the Non-linguistic N400 (right b). In order to get a better display, only most relevant electrodes for both N400 are shown (FCz and Cz).
A three-way within-subject ANOVA with task (non-lin- guistic versus linguistic), condition (congruent versus incongruent), and region (average of the five most ante- rior midline electrodes covering frontal and fronto-cen- tral areas versus average of the five most posterior elec-trodes placed on centro-parietal and occipital regions) as factors was performed on the N400 latency data. This analysis revealed a main effect of task (F(1,8) = 41.70, p <
0.001, ε = 1.00) due to shorter Non-linguistic N400 la-tencies in response to pictures in the environmental sound-picture matching task (mean = 351.56 ± 27.70 ms) in comparison to Linguistic N400 latencies in response to auditory words presented in the picture-auditory word
matching task (mean = 422.17 ± 33.15 ms). No interac-tions or other simple effects were found.
3.2.2. N400 Amplitude
A three-way within-subject ANOVA with task (non-lin- guistic versus linguistic), condition (congruent versus incongruent), and region (anterior versus posterior) as factors was also performed on the N400 amplitude data derived again from the 10 midline electrodes. This ANOVA revealed an effect of the condition factor (F(1,8)
= 18.95, p < 0.01, ε = 0.966), an effect of region (F(1,8) =
10.14, p < 0.05, ε = 0.796), an interaction task x region (F(1,8) = 13.90, p < 0.01, ε = 0.902), a condition x region
interaction (F(1,11) = 8.94, p < 0.05, ε = 0.745) as well as
a 3-way task x condition x region (F(1,8) = 12.97, p < 0.01, ε = 0.882) interaction. Decomposition of this 3-way in-teraction revealed that Non-linguistic N400 amplitudes related to the environmental sound-picture matching task were significantly larger in the anterior (congruent =
−2.45 µV; incongruent = −3.30 µV) than the posterior (congruent = 1.01 µV; incongruent = 0.47 µV) regions for both the incongruent (t9 = −3.601, p = 0.007) and
congruent (t9 = −3.498, p = 0.008) conditions, again
re-flecting the anterior treatment of non-linguistic incongru-ity. In contrast, Linguistic N400 amplitudes related to the picture-auditory word matching task were significantly larger (t9 = 4.22, p = 0.003) in anterior than posterior
regions for congruent stimuli (anterior = −1.27 µV; pos-terior = 0.53 µV) whereas no significant differences were found between anterior and posterior regions for incon-gruent stimuli (t9 = −0.955, p = 0.368; anterior = −0.61
µV; posterior = −1.23 µV).
In order to further compare topographical data be-tween both tasks, a t-test was conducted using BrainVi-sion on normalized amplitude data [76,77]. Given the Student’s t-distribution table, it was assumed that in or-der for activity distribution to be significantly different across both tasks in the incongruent condition, the t- value would have to be >3.36. The two N400 component distributions were spatially different (t8 > 3.36, p < 0.05)
between 340 and 430 ms: the Non-linguistic N400 (en-vironmental sound-picture matching task) was associated with a fronto-central scalp distribution whereas the Lin-guistic N400 (picture-auditory word matching task) pro-duced a centro-parietal distribution. This significant time window (340 - 430 ms) has been further used for source analyses.
With the aim of investigating the presence of hemis-pheric asymmetries, a t-test was performed. Consistent with the literature, hemispheric asymmetries were found for amplitudes in the picture-auditory word matching task (t8 = 2.788, p = 0.024), where Linguistic N400
fron-to-centro-parietal area) than on the left hemisphere (an average of the data from 20 electrodes overlying the left fronto-centro-parietal area). No hemispheric asymmetries were found in the Non-linguistic N400 elicited by the environmental sound-picture matching task.
3.3. Electrophysiological Source Analyses
[image:9.595.62.286.333.573.2]In order to determine if the N400 components elicited by the picture-auditory word and environmental sound-pic- ture matching tasks had different N400 generator locali- zations, source analyses using a distributed BMA ap- proach were performed on both N400s. Results sug- gested different cerebral sources for each component elicited by incongruous trials. In fact, the generators of the Non-linguistic N400 were situated in the right middle and superior temporal gyri, in bilateral parahippocampal gyri and in the left lingual gyrus (Figure 3(a)), whereas those for the Linguistic N400 were located in the left superior temporal gyrus and in the right parahippocampal
Figure 3. BMA source analyses results for (a) environmental sound-picture matching task and (b) picture-auditory word matching task. All individual inverse solutions have been av-erage in order to visualize grand-avav-erage BMA source analyses. Results show (a, i) right (R) middle and superior temporal gyri (red arrow), bilateral parahippocampal gyri (yellow arrows) and left (L) lingual gyrus (white arrow) sources for the Non- linguistic N400. Left ii) shows right (R) middle and superior temporal (auditory area) Non-linguistic N400 generators on a 3D brain reconstruction; (b) L superior temporal gyrus (red arrow) and R parahippocampal gyrus (yellow arrow) generators for the Linguistic N400. Right ii) shows clear L superior tem-poral (Wernicke’s area) Linguistic N400 generators. N.B. As specified on the figure, the radiological convention is used: L = R; R = L.
gyrus (Figure 3(b)). Individual data showed that these results were found in approximately 70% of patients.
4. DISCUSSION
The aim of the present study was to further investigate the nature of a N400 elicited by incongruity detected in an auditory word-picture pair (Linguistic N400) stimulus and in an environmental sound-picture pair (Non-lin- guistic N400) stimulus, and to specify the anatomical sources of both N400s. As expected [5,6,22], our data showed a larger N400 in response to incongruent than to congruent stimulus pairs in both tasks, confirming that the N400 is not specific to the detection of lexico-se- mantic errors but can be elicited by the detection of a broader type of incongruities [26-28,30,84,85]. Shorter peak latencies were found for the Non-linguistic N400, a finding that is consistent with other previous works [22,23,27,53]. The observed differences in the N400 la- tency may stem from a quicker integration of the envi- ronmental sound and the corresponding picture due to the less arbitrary character of the relationship with its world-referent [13].
Alternatively, latency differences can be accounted for by the linguistic (or not) nature of the stimuli. Hence, conceptual processing of environmental sounds (ex: sound of yelp) could be faster than linguistic processing (ex: word “dog”) because the access to word meaning is mediated through phonological representation whereas environmental sounds may activate more directly the corresponding semantic representations [22].
Consistent with the literature [5,10,33,54], the scalp topography of the Linguistic N400 showed a centro-pa- rietal distribution with a right-greater-than-left hemisphe- ric asymmetry. In contrast, the Non-linguistic N400 com- ponent showed a fronto-central scalp topography with no hemispheric asymmetry. Studies that included environ-mental sound-picture matching task showed controver-sial results since some reported a left-greater-than-right cerebral asymmetry [26,30,34] while others found no asymmetry [22,27,28] for the Non-linguistic N400. In the present study, no such hemispheric asymmetry was found.
way would have been to present the picture prior to en-vironmental sound in the non-linguistic task. However, a pilot study showed that environmental sounds needed to have a significantly longer duration than words to be recognized and that duration greatly varies between sounds, which would have significantly influenced the non-linguistic N400 latency and its variability. Therefore, we cannot exclude that the cognitive process associated with each N400 is the same and that the observed differ-ences are due to the cortical activation preceding/or oc-curring in parallel and generated by different types of stimuli. Nevertheless, a paired Hotelling T2 test was ap-plied on the data of each task in order to eliminate early components when performing source analyses.
In our study, the picture-auditory word matching task was a French adaptation of the linguistic task used by Connolly et al. [10] that evoked a Linguistic N400 with a tendency for a right-greater-than-left cerebral asymmetry. This topographical pattern has commonly been reported in the literature [5,33], and was also found in the present study for the Linguistic N400. The results of the source analysis for the Linguistic N400 are also similar to those obtained in EEG [44], MEG [40,42,52,59] and fMRI [86] (for a review, see [87]), that all showed left superior temporal gyrus sources for the Linguistic N400. This cerebral region, located in Wernicke’s area, is typically associated with phonological and semantic processing and a lesion in this area has been shown to induce com-prehensive language deficits such Wernicke’s aphasia. The localization of generators in this region is thus con-sistent with a N400 elicited by the detection of an incon-gruity occurring during auditory language processing.
Even if no hemispheric asymmetry was found in the Non-linguistic N400 topography, the results of the BMA source analysis suggested a laterality effect, in showing a greater involvement of right than left middle and supe-rior temporal region in processing of the environmental sounds (see Figure 3). These results are compatible with results from brain imaging studies [62,64,66] showing that this region is involved in the processing of environ-mental sounds. Damage in this area may induce auditory agnosia [88], an auditory impairment affecting the processing of environmental sounds.
Results of the source analyses also revealed generators in the parahippocampal region that were common to both N400 components. The parahippocampal gyrus has been associated with recall activity[89]. The contribution of this region may thus be related to the very nature of the tasks we used which both involved the access to repre-sentations that are stored in long-term memory.
In a recent study comparing N400 components elicited by linguistic tasks (semantic and phonologic) and a non-linguistic task (image categorization), Khateb et al.
[53] found no topographical or sources analysis differ-
ences between tasks. All N400s had a central distribution and originated from the middle and superior temporal gyri. In the present study, we found topographical dif-ferences between the Linguistic N400 (centro-parietal distribution) and Non-linguistic N400 (fronto-central distribution). Our source analyses suggested different brain generators for both Linguistic and Non-linguistic N400s, located respectively in the left superior temporal gyrus and in the right middle and superior temporal gyri. Differences between the present findings and results from Khateb et al. [53] may be explained by methodo-logical differences. First, different tasks were used to elicit the Non-linguistic N400 components. It can be hy-pothesized that the environmental sound-picture match-ing task used in our experiment induces less verbaliza-tion than the image categorizaverbaliza-tion task used in Khateb et al.’ study [53]. This could explain the fronto-central dis-tribution associated with the Non-linguistic N400 and its right middle and superior temporal gyri origin found in our study. The fronto-central distribution could also be explained by a familiarity effect and/or the implication of the attention network. It is noteworthy that such a fron-to-central distribution has also been reported in previous studies using environmental sound tasks [22,23,27,30]. Second, differences in source analysis approaches may also partly explain differences between our results and those of Khateb et al. [53].
sources.
Data set collected in both tasks and conditions com-prised a fairly high proportion of artifact-free trials. This was obtained by presenting each stimulus set twice. It is worth mentioning that we did not find the repetition ef-fect reported by some authors [82,83,90,91] when mea-suring N400 elicited by the detection of incongruity in sentence stimuli. These authors showed that the N400 amplitude was reduced in the second presentation of the sentence stimulus set. According to these authors, the last word of a sentence gets more predictable at the second or multiple presentations. This predictability elicits a dimi-nution of the N400 amplitude. In the present study, we used pictures, auditory words and environmental sounds. These stimuli may not provide a semantic context that is sufficiently rich to contribute in reducing the level of incongruity detected by the subjects at the second pres-entation.
Within the present set of experiments, it may be ar-gued that the Non-linguistic N400 was elicited because the subjects verbalized the environmental sounds before the appearance of the picture, thereby eliciting a Linguis-tic N400. To address this issue, Aramaki et al. [92] only used sounds in their experimental design. However, this was not possible in the present study. In order to minim-ize this effect, all participants performed the environ-mental sound-picture matching task prior to the pic-ture-auditory word matching task. In a pilot study with no EEG recording, we investigated the order effect on the performance of a small group of subjects and found that all participants obtained very high scores in both tasks (ceiling effect), with no task order effect. In addi-tion, responses given by the participants questioned after the testing do not support the hypothesis of the verbali-zation during the environmental sound-picture matching task. Indeed, participants reported they were adopting different strategies when performing the picture-auditory word or the environmental sound-picture matching task, i.e., silently anticipating the word congruent with the picture prime in the picture-auditory word matching task, and visualizing the object or an environmental scene eliciting such a sound in the environmental sound-picture matching task. Thus, it can be hypothesized that the pic-ture-auditory word matching task involved a verbaliza-tion of the name of the picture presented before the word onset, while the environmental sound-picture matching task induced a visual representation of the environmental sound presented before the picture onset. The fact that an activation of the visual associative cortex (left lingual gyrus) was found only in the environmental sound-pic- turetask brings additional support to this interpretation.
5. CONCLUSION
The present paper is the first study that proposes models
of cerebral generators for both the Non-linguistic N400, generated by an environmental sound-picture matching task, and the Linguistic N400, elicited by a picture- auditory word matching task, in healthy adults. Results for source analysis indicated that BMA approach is an adequate model for the localization of the N400. Find- ings of the present study concur with brain imaging data and single case studies suggesting that linguistic incon- gruities involve Wernicke’s area, whereas those related to environmental sounds recruit the right temporal region. Our results are also consistent with those of a PET study conducted by Thierry and Price [65], who reported acti-vation in the left superior temporal sulcus and left ventral inferior frontal gyrus in the processing of the linguistic incongruity, whereas the right midfusiform and right pos- terior middle temporal gyrus were activated during the processing of non-linguistic incongruity. Interestingly, he- mispheric dissociation in processing linguistic and non- linguistic material was obtained regardless of the modal-ity of presentation (visual or auditory). It thus appears that the stimulus type, linguistic vs. non-linguistic, in-fluences which cerebral regions will be recruited in de-tecting semantic incongruity. This suggests the existence of two parallel pathways for the processing of linguistic and non-linguistic incongruities.
ACKNOWLEDGEMENTS
We wish to thank Yanays Rodriguez, Alejandro Ojeda, and Eduardo Aubert for helping with source analyses and providing fruitful discus- sions. We are also indebted to Martin Thériault, Benoît Gagnon and Julie Senécal for programming tasks and helping in generating stimuli. This work was supported by by the Canada Research Chair in Developmental Neuropsychology held by Dr. Lassonde, and scholar- ships from the Canadian Institutes of Health Research (CIHR) and the Fonds de la Recherche du Québec - Santé (FRQS) awarded to Dr. Gallagher.
REFERENCES
[1] Brandeis, D. and Lehmann, D. (1986) Event-related po-tentials of the brain and cognitive processes: Approaches and applications. Neuropsychologia, 24, 151-168.
[2] Auchterlonie, S., Phillips, N.A., Chertkow, H., 2002. Be- havioural and electrical brain measures of semantic pri- ming in patients with Alzheimer’s disease: Implications for access failure versus deterioration hypotheses. Brain and Cognition, 48, 264-267.
[3] Kutas, M., Federmeier, K.D. (2011) Thirty years and counting: Finding meaning in the N400 component of the event-related brain potential (ERP). Annual Review of Psychology, 62, 621-647.
reading text with distractors. Psychology and Aging, 18,
126-139.
[5] Kutas, M. and Hillyard, S.A. (1980) Event-related brain potentials to semantically inappropriate and surprisingly large words. Biological Psychology, 11, 99-116.
[6] Kutas, M. and Hillyard, S.A. (1980) Reading senseless sentences: Brain potentials reflect semantic incongruity. Science, 207, 203-205.
[7] Kutas, M. and Hillyard, S.A. (1984) Brain potentials dur- ing reading reflect word expectancy and semantic associ-ation. Nature, 307, 161-163.
[8] Holcomb, P.J. (1993) Semantic priming and stimulus de- gradation: Implications for the role of the N400 in langu- age processing. Psychophysiology, 30, 47-61.
[9] Kutas, M. and Hillyard, S.A. (1989) An electrophysio-logical probe of incidental semantic association. Journal of Cognitive Neuroscience, 1, 38-49.
[10] Connolly, J.F., Byrne, J.M. and Dyman, C.A. (1995) As- sessing adult receptive vocabulary with event-related po-tentials: An investigation of cross-modal and cross-form priming. Journal of Clinical and Experimental Neuropsy- chology, 17, 548-565.
[11] Bernadis, P., Salillas, E. and Caramelli, N. (2008) Be-havioural and neurophysiological evidence of semantic interaction between iconic gestures and words. Cogn Neu- ropsychology, 25, 1114-1128.
[12] Dunn, L.M. and Dunn, L.M. (1981) Peabody picture vo-cabulary test-revised. American Guidance Service, Circle Pines.
[13] Ganis, G., Kutas, M. and Sereno, M.I. (1996) The search for “common sense”: An electrophysiological study of the comprehension of words and pictures in reading. Jour- nal of Cognitive Neuroscience, 8, 89-106.
[14] Holcomb, P.J. and McPherson, W.B. (1994) Event-rela- ted potentials reflect semantic priming in an object deci- sion task. Brain and Cognition, 24, 259-276.
[15] McPherson, W.B. and Holcomb, P.J. (1999) An electro-physiological investigation of semantic priming with pic-tures of real objects. Psychophysiology, 36, 53-65
[16] Barrett, S.E. and Rugg, M.D. (1989) Event-related poten-tials and the semantic matching of faces. Neuropsycholo-gia, 27, 913-922.
[17] Bobes, M.A., Valdes-Sosa, M. and Olivares, E (1994) An ERP study of expectancy violation in face perception. Brain and Cognition, 26, 1-22.
[18] Jemel, B., et al. (1999) Event-related potentials to
struc-tural familiar face incongruity processing. Psychophsiol-ogy, 36, 437-452.
[19] Olivares, E. I., Saavedra, C., Trujillo-Barreto, N. J. and Iglesias, J. (2013) Long-term information and distributed neural activation are relevant for the “internal features advantage” in face processing: Electrophysiological and source reconstruction evidence. Cortex, 49, 2735-2747.
[20] Jost, K., Hennighausen, E. and Rosler, F. (2004) Com-paring arithmetic and semantic fact retrieval: Effects of problem size and sentence constraint on event-related brain potentials. Psychophysiology, 41, 46-59.
[21] Szucs, D. and Soltész, F. (2010) Event-related brain po-tentials to violations of arithmetic syntax represented by place value structure. Biological Psychology, 84, 354-367.
[22] Cummings, A., Čeponienė, R., Koyama, A., Saygin, A.P., Townsend, J. and Dick, F. (2006) Auditory semantic net- works for words and natural sounds. Brain Research, 1115, 92-107.
[23] Cummings, A., Čeponienė, R., Dick, F., Saygin, A.P. and Townsend, J. (2008) A developmental ERP study of ver-bal and non-verver-bal semantic processing. Brain Research, 1208, 137-149.
[24] Fogelson, N., Loukas, C., Brown, J. and Brown, P. (2004) A common N400 EEG component reflecting contextual integration irrespective of symbolic form. Clinical Neu-rophysiology, 115, 1349-1358.
[25] Kirmse, U., Jacobsen, T. and Schröger, E. (2009) Fami-liarity affects environmental sound processing outside the focus of attention: an event-related potential study. Clin-ical Neurophysiology, 120, 887-896.
[26] Lebrun, N., et al. (2001) An ERD mapping study of the neurocognitive processes involved in the perceptual and semantic analysis of environmental sounds and words. Cognitive Brain Research, 11, 235-248.
[27] Orgs, G., Lange, K., Dombrowski, J.H. and Heil, M. (2006) Conceptual priming for environmental sounds and words: an ERP study. Brain and Cognition, 62, 267-272.
[28] Orgs, G., Lange, K., Dombrowski, J.H. and Heil, M. (2008) N400-effects to task-irrelevant environmental sounds: Further evidence for obligatory conceptual processing. Neuroscience Letters, 436, 133-137.
[29] Polich, J. (1985) N400s from sentences, semantic catego-ries, number and letter strings. Bulletin of the Psycho-nomic Society, 23, 361-364.
sounds: Event-related brain potential measures. Neuro-psychologia, 33, 485-508.
[31] Grigor, J., Van, S., Toller, Behan, J. and Richardson, A. (1999) The effect of odour priming on long latency visual evoked potentials of matching and mismatching objects. Chemical Senses, 24, 137-144.
[32] Sarfarazi, M., Cave, B., Richardson, A., Behan, J. and Sedgwick, E.M. (1999) Visual event related potentials modulated by contextually relevant and irrelevant olfac-tory primes. Chemical Senses, 24, 145-154.
[33] Kutas, M. and Hillyard, S.A. (1982) The lateral distribu-tion of event-related potentials during sentence process- ing. Neuropsychologia, 20, 579-590.
[34] Plante, E., Van Petten, C. and Senkfor, A.J. (2000) Elec-trophysiological dissociation between verbal and non-verbal semantic processing in learning disabled adults. Neuropsychologia, 38, 1669-1684.
[35] De Munck, J.C., van Dijk, B.W. and Spekeijse, H. (1988) Mathematical dipoles are adequate to describe realistic generators of human brain activity. IEEE Transactions on Biomedical Engineering, 35, 960-966.
[36] Nunez, P.L. (1981) A study of origins of the time de- pendencies of scalp EEG: I-theoretical basis. IEEE Transactions on Biomedical Engineering, 28, 271-280.
[37] Scherg, M. and von Cramon, D. (1986) Evoked dipole source potentials of the human auditory cortex. Electroe- ncephalography and Clinical Neurophysiology, 65, 344-
[38] Scholz, B. and Schwierz, G. (1994) Probability-based current dipole localization from biomagnetic fields. IEEE Transactions on Biomedical Engineering, 41, 735-742.
[39] Luck, S.J. (2005) An introduction to the event-related potential technique. MIT Press, Cambridge.
[40] Helenius, P., Salmelin, R., Service, E. and Connolly, J.F. (1998) Distinct time courses of word and context com- prehension in the left temporal cortex. Brain, 121, 1133-
1142.
[41] Helenius, P., Salmelin, R., Service, E. and Connolly, J.F. (1999) Semantic cortical activation in dyslexic readers. Journal of Cognitive Neuroscience, 11, 535-550.
[42] Simos, P.G., Basile, L.F.H. and Papanicolaou, A.C. (1997) Source localization of the N400 response in a sentence- reading paradigm using evoked magnetic fields and mag- netic resonance imaging. Brain Research, 762, 29-39.
[43] Mäkela, A.M., Mäkinen, V., Nikkilä, M., Ilmoniemi, R.J. and Tiitinen, H. (2001) Magnetoencephalographic (MEG) localization of the auditory N400m: Effects of stimulus duration. Neuroreport, 12, 249-253.
[44] D’Arcy, R.C.N., Connolly, J.F., Service, E., Hawco, C.S. and Houlihan, M.E. (2004) Separating phonological and semantic processing in auditory sentence processing: A high-resolution event-related brain potential study. Hu- man Brain Mapping, 22, 40-51.
[45] D’Arcy, R.C.N., Service, E., Connolly, J.F. and Hawco, C.S. (2005) The influence of increased working memory load on semantic neural systems: A high-resolution event- related potential study. Cognitive Brain Research, 22, 177-191.
[46] Dien, J., Michelson, C.A. and Franklin, M.S. (2010) Se- parating the visual sentence N400 effect from the P400 sequential expectancy effect: Cognitive and neuroanato- mical implications. Brain Research, 1355, 126-140.
[47] Hamm, J.P., Johnson, B.W. and Kirk, I.J. (2002) Com- parison of the N300 and N400 ERPs to picture stimuli in congruent and incongruent contexts. Clinical Neurophy- siology, 113, 1339-1350.
[48] Silva-Pereyra, J., Rivera-Gaxiola, M., Aubert, E., Bosch, J., Galan, L. and Salazar, A. (2003) N400 during lexical decision tasks: A current source localization study. Clin- ical Neurophysiology, 114, 2469-2486.
[49] Bölte, J., Schulz, C. and Dobel, C. (2010) Processing of existing, synonymous, and anomalous German derived adjectives: An MEG study. Neuroscience Letters, 469,
107-
[50] Giglio, A.C., Minati, L. and Boggio, P.S. (2013) Throwing the banana away and keeping the peel: Neuroelectric responses to unexpected but physically feasible action endings. Brain Research, 1532, 56-62.
[51] Haan, H., Streb, J., Bien, S. and Rosler, F. (2000) Indi- vidual cortical current density reconstructions of the se- mantic N400 effect: Using a generalized minimum norm model with different constraints (L1 and L2 norm). Hu- man Brain Mapping, 11, 178-192.
[52] Halgren, E., Dhond, R.P., Christensen, N., Van Petten, C., Marinkovic, K., Lewine, J.D. and Dale, A.M. (2002) N400-like magnetoencephalography response modulated by semantic context, word frequency, and lexical class in sentences. Neuroimage, 17, 1101-1116.
[53] Khateb, A., Pegna, A.J., Landis, T., Mouthon, M.S. and Annoni, J.M. (2010) On the origin of the N400 effects: An ERP waveform and source localization analysis in three matching tasks. Brain Topography, 23, 311-320.
[55] Proverbio, A.M., Crotti, N., Zani, A. and Adomi, R. (2009) The role of left and right hemispheres in the com- prehension of idiomatic language: An electrical neuroi- maging study. BMC Neuroscience, 10, 116.
[56] Qiu, J., Li, H., Chen, A. and Zhang, Q. (2008) The neural basis of analogical reasoning: An event-realted potential study. Neuropsychologia, 46, 3006-3013.
[57] Ren, G.Q., Liu, Y. and Han, Y.C. (2009) Phonological activation in chinese reading: An event-related potential study using low-resolution electromagnetic tomography. Neuroscience, 164, 1623-1631.
[58] Schulz, E., Maurer, U., van der Mark, S., Bucher, K., Brem, S., Martin, E. and Brandeis D. (2008) Impaired semantic processing during sentence reading in children with dyslexia: Combined fMRI and ERP evidence. Neu- roimage, 41, 153-168.
[59] Travis, K.E., et al. (2013) Independence of early speech processing from word meaning. Cerebral Cortex, 23,
2370-
[60] Trujillo-Barreto, N.J., Aubert-Vázquez, E. and Valdés-Sosa, P.A. (2004) Bayesian Model Averaging in EEG/MEG imaging. Neuroimage, 21, 1300-1319.
[61] Kotz, S.A., Opitz, B. and Friederici, A.D. (2007) ERP effects of meaningful and non-meaningful sound pro- cessing in anterior temporal patients. Restorative Neu- rology and Neuroscience, 25, 273-284.
[62] Thierry, G., Giraud, A.L. and Price, C. (2003) Hemis- pheric dissociation in access to the human semantic sys- tem. Neuron, 38, 499-506.
[63] Schnider, A., Benson, D.F., Alexander, D.N. and Schnider- Klaus, A. (1994) Non-verbal environmental sound recog- nition after unilateral hemispheric stroke. Brain, 17, 281-
[64] Opitz, B., Mecklinger, A. and Friederici, A.D. (2006) Functional asymmetry of human prefrontal cortex: En- coding and retrieval of verbally and nonverbally coded information. Learning Memory, 7, 85-96.
[65] Thierry, G. and Price, C. (2006) Dissociating verbal and nonverbal conceptual processing in the human brain. Journal of Cognitive Neuroscience, 18, 1018-1028.
[66] Zatorre, R.J., Bouffard, M. and Belin, P. (2004) Sensitivity to auditory object features in human temporal neocortex. Journal of Neuroscience, 24, 3637-3642.
[67] Hoeting, J.A., Madigan, D., Raftery, A.E. and Volinsky, C.T. (1999) Bayesian model averaging: A tutorial. Statis- tical Science, 14, 382-417.
[68] MacKay, D.J.C. (1992) Bayesian interpolation. Neural Computation, 4, 415-447.
[69] Pascual-Marqui, R.D., Michel, C.M. and Lehmann, D. (1994) Low resolution electromagnetic tomography: A new method for localizing electrical activity in the brain. International Journal of Psychophysiology, 18, 49-65.
[70] Dunn, L.M., Thériault-Whalen, C.M. and Dunn, L.M. (1993) Échelle de vocabulaire en images Peabody. PSYCAN, To- ronto.
[71] Alario, F.X. and Ferrand, L. (1999) A set of 400 pictures standardized for French: Norms for name agreement, image agreement, familiarity, visual complexity, image variability, and age of acquisition. Behavior Research Methods, 31, 531-552.
[72] Bonin, P., Peereman, R., Malardier, N., Méot, A. and Chalard, M. (2003) A new set of 299 pictures standar- dized for French for name agreement, image agreement, conceptual familiarity, visual complexity, image variabi- lity and age of acquisition. Behavior Research Methods, 35, 158-167.
[73] Chalard, M., Bonin, P., Méot, A., Boyer, B. and Fayol, M. (2003) Objective age-of-acquisition (AoA) norms for a set of 230 object names in French: Relationship with psycholinguistic variables, the English data from Morri- son et al. (1997), and naming latencies. European Jour-nal of Cognitive Psychology, 15, 209-245.
[74] Ferrand, L., Grainger, J. and New, B. (2002) Normes d’âge d’acquisition pour 400 mots monosyllabiques. Notes mé-
thodologiques s
[75] Gratton, G., Coles, M.G., Donchin, E. (1983) A new me- thod for off-line removal of ocular artifact. Electroence- phalography and Clinical Neurophysiology, 55, 468-484.
[76] McCarthy, G. and Wood, C.C. (1985) Scalp distribution of event-related potentials: An ambiguity associated with analysis of variance models. Electroencephalography and Clinical Neurophysiology, 62, 203-208.
[77] Urbach, T.P. and Kutas, M. (2006) Interpreting event- related brain potential (ERP) distributions: Implications of baseline potentials and variability with application to amplitude normalization by vector scaling. Biological Psychology, 72, 333-343.
[78] Rush, S. and Driscoll, D.A. (1969) EEG electrode sensi- tivity-An application of reciprocity. IEEE Transactions on Biomedical Engineering, 16, 15-22.
[79] Riera, J.J., Fuentes, M.E., Valdes, P.A. and Oharriz, Y. (1997) Theoretical basis of the EEG spline inverse solu- tions for spherical head model. Biomedical Technology, 42, 219-222.
[80] Riera, J., Valdes, P., Fuentes, M.E. and Oharriz, Y. (1997) Explicit Backus and Gilbert EEG inverse solution for spherical head model. Biomedical Technology, 42, 216- 218.
false discovery rate: A practica1 and powerful approach to multiple testing. Royal Statistic Society Series B (Me- thodological), 57, 289-300.
[82] Besson, M. and Kutas, M. (1993) The many facets of re- petition: A cued-recall and event-related potential analy- sis of repeating words in same versus different sentence contexts. Journal of Experimental Psychology: Learning Memory and Cognition, 19, 1115-1133.
[83] Besson, M., Kutas, M. and Van Petten, C. (1992) An event-related potential (ERP) analysis of semantic con- gruity and repetition effects in sentences. Journal of Cog- nitive Neuroscience, 4, 132-149.
[84] Daltrozzo, J. and Schön, D. (2009) Conceptual processing in music as revealed by N400 effects on words and mu- sical targets. Journal of Cognitive Neuroscience, 21, 1882-
[85] Painter, J.G. and Koelsch, S. (2011) Can out-of-context musical sounds convey meaning? An ERP study on the processing of meaning in music. Psychophysiology, 48, 645-655.
[86] Willems, R.M., Ozyurek, A. and Hagoort, P. (2008) Seeing and Hearing Meaning: ERP and fMRI Evidence of Word versus Picture Integration into a Sentence Context. Jour- nal of Cognitive Neuroscience, 20, 1235-1249.
[87] Lau, E.F., Phillips, C. and Poeppel, D. (2008) A cortical network for semantics: (de)constructing the N400. Nature Reviews. Neuroscience, 9, 920-933.
[88] Fujii, T., Fukatsu, R., Watabe, S., Ohnuma, A., Teramura, K., Kimura, I., Saso, S. and Kogure, K. (1990) Auditory sound agnosia without aphasia following a right temporal lesion. Cortex, 26, 263-268.
[89] Alkire, M.T., Haier, R.J., Fallon,J.H. and Cahill, L. (1998) Hippocampal, but not amygdala, activity at encoding cor- relates with long-term, free recall of nonemotional infor- mation. PNAS, 95, 14506-14510.
[90] Young, M.P. and Rugg, M.D. (1992) Word frequency and multiple repetition as determinants of the modulation of event-related potentials in a semantic classification task. Psychophysiology, 29, 664-676.
[91] Doyle, M.C., Rugg, M.D. and Wells, T. (1996) A com- parison of the electrophysiological effects of formal and repetition priming. Psychophysiology, 33,132-147.
[92] Aramaki, M., Marie, C., Kronland-Martinet, R., Ystad, S. and Besson, M. (2010) Sound categorization and concep- tual; priming for nonlinguistic ans linguistic sounds. Journal of Cognitive Neuroscience, 22, 2555-2569.