Munich Personal RePEc Archive
Changes in REIT liquidity 1988 - 2007:
Evidence from daily data
Cannon, Susanne E. and Cole, Rebel A.
DePau University, DePaul University
27 October 2008
Changes in REIT Liquidity 1988 - 2007:
Evidence from Daily Data
Susanne E. Cannon Department of Real Estate
DePaul University Chicago, IL 60604, USA E-mail: [email protected]
Rebel A. Cole *
Departments of Finance and Real Estate DePaul University
Chicago, IL 60604, USA E-mail: [email protected]
Abstract In this study, we present panel-data evidence on REIT liquidity and its determinants over the 1988 – 2007 period. We focus upon liquidity measures that do not require
micro-structure data (1) to facilitate use of our results as benchmarks for comparisons with results from international markets for which micro-structure data may be unavailable, (2) to provide
benchmarks that do not require access to costly (and voluminous) micro-structure data. We find that REIT liquidity improved during the early and mid-1990s, deteriorated during the late 1990s, and then improved dramatically during 2000 – 2006, with the notable exception of 2007.
Liquidity improved the most for REITs traded on the NYSE, and was an order of magnitude better than liquidity of REITs traded on the AMEX or NASDAQ. We link the deterioration in liquidity observed in 2007 to the investment portfolio of a REIT. We find that the percentage bid-ask spread is highly correlated with the measure of price impact proposed by Amihud (2002). We provide panel-data evidence on the key determinants of the percentage bid-ask spread that largely confirms the results reported by Bhasin, Cole and Kiely (1997) for 1990 and 1994: the percentage spread is a positive function of the volatility of stock returns, and a negative function of dollar volume turnover, share price and market capitalization. Finally, we provide evidence that these results obtained using daily closing bid- and ask-prices are not qualitatively different from those obtained using market micro-structure data. This suggests that we can use liquidity measures based upon readily available daily return data rather than being forced to rely upon market micro-structure data.
Keywords: Bid-Ask, Spread, Depth, Liquidity, Price Impact, REIT, Tightness
JEL Classification: G12, G21, G23, G29
FORTHCOMING: Journal of Real Estate Finance and Economics
* Corresponding Author (1-312-362-6887). We are grateful for helpful comments from Jim Shilling, David Ling and participants at the DePaul University REIT Conference held Oct. 24-25, 2008 in Chicago, IL USA.
1. Introduction
When U.S. Real Estate Investment Trusts (―REITs‖) were first created during the 1970s,
they were viewed as a tax-preferred mechanism enabling retail investors to own shares in
diversified real-estate portfolios. Following the U.S. commercial real estate debacle of the late
1980s, REITs were ―re-discovered‖ as a mechanism enabling institutional investors to hold real
estate in their portfolios and obtain relatively high dividend yields while maintaining the ability
to exit their investments at will without requiring a sale of the underlying real estate assets. The
liquidity of REIT investments relative to alternatives, such as separate accounts and commingled
real estate funds, had great appeal to these investors, and led to tremendous change in the REIT
industry during the past two decades. Market capitalization grew from $11 billion in 1987 to
$141 billion in $1997 and $312 billion in 2007. However, the 2007 figure was down by more
than 25% from its high of $438 billion in 2006. Institutional investors played a pivotal role in
this growth, with institutional ownership of equity REITs accounting for 76 percent of all
outstanding shares as of year-end 2008 (Source: SNL Securities).
The number of REITs grew from 110 in 1987 to a high of 226 in 1994 and then fell to
152 as of year-end 2007. Most REITs acquire and manage real estate (―equity REITs‖), but
REITs that either issue their own loans or purchase secondary market securities (―mortgage
REITs‖) exist, as well. Equity REITs have come to dominate the industry. In 1987, equity REITs
accounted for slightly less than half of both the number and market cap of the industry. By 1997,
equity REITs accounted for more than 90 percent of the industry market cap, and that percentage
has remained relatively stable through 2007. By 1997, equity REITs accounted for three out of
Mortgage REITs saw their fortunes rise and fall during the past two decades. The market
cap of mortgage REITs reached what was then a high of $3.6B in 1987, declined in the early
1990s to a low of $2.5B in 1994 before rising again during the late 1990s to a high of $7.4B in
1997. Their market cap fell to a low of $1.6B in 2000 and then rose to an all-time high of $29B
in 2006 before dropping to $19B in 2007.
In view of these seismic changes in the industry, it is time to revisit the issue of REIT
liquidity. If REITs were attractive because of their liquidity, have the improvements in REIT
liquidity documented by researchers for the early 1990s continued into the late 1990s and on into
the 21st century, paralleling the increase in the industry’s market capitalization? How has REIT
liquidity changed in response to the housing bubble and financial crisis of 2008-2009, when
credit in general all but dried up?
In this study, we shed new light on these important issues by presenting evidence on
REIT liquidity and its determinants over the 1988 – 2007 period. Our panel data, covering 337
REITs over 20 years, enable us to be the first to employ panel-data techniques in exploring the
determinants of REIT liquidity.
We focus upon liquidity measures that do not require micro-structure data (1) to facilitate
use of our results as benchmarks for comparisons with results from international markets for
which micro-structure data may be unavailable, (2) to provide benchmarks that do not require
access to costly (and voluminous) micro-structure data.
We find that REIT liquidity deteriorated during the late 1990s, rebounded dramatically
during 2000 – 2006, and then declined again during 2007. Liquidity improved most for REITs
the AMEX or NASDAQ. We link the deterioration in liquidity observed in 2007 to the
investment portfolio of a REIT.
We also find that the percentage bid-ask spread is highly correlated with the measure of
price impact proposed by Amihud (2002). The percentage spread has been criticized by some
academics as only a measure of inventory costs; our finding refutes this criticism, at least for
REITs.
We provide panel-data evidence on the key determinants of the percentage bid-ask spread
that largely confirms the results reported by Bhasin, Cole and Kiely (1997) for 1990 and 1994—
the percentage spread is a positive function of the volatility of stock returns, and a negative
function of dollar-volume turnover, share price and market capitalization.
Finally, we provide evidence that these results obtained using daily closing bid- and
ask-prices are not qualitatively different from those obtained using market micro-structure data. This
finding suggests that, at least for U.S. REITs, we can use liquidity measures based upon readily
available daily-return data rather than being forced to rely upon difficult-to-obtain market
micro-structure data.
2. Literature Review
The literature on stock market liquidity dates back at least to Demsetz (1968), but we
focus only on studies that examine the liquidity of REITs. For good survey articles of stock
market liquidity, see O’Hara (1995), Madhavan (2000), and Biais, Glosten and Spatt (2005).
Nelling et al. (1995) were the first to examine REIT liquidity. They analyze daily closing
bid-ask spreads primarily for NASDAQ firms over the late 1980s. They find that REIT liquidity
as measured by the percentage spread declined during the 1980s, i.e., percentage spreads
Below, Kiely and McIntosh (1996) use market-microstructure data from 1991 to examine
the intraday-trading behavior of REITs. They find that REITs have lower volume and fewer
trades than non-REITs, and that mortgage REITs trade at narrower spreads than equity REITs.
They also find that REITs with higher institutional ownership trade at narrower spreads that are
closer to those observed for non-REITS.
Bhasin, Cole and Kiely (1997) also use market micro-structure data to examine REIT
liquidity. They analyze TAQ data from 1990 and 1994 and find that percentage bid-ask spreads
declined significantly over that period—a time when there was significant growth in the number
and market capitalization of REITs. They also use an empirical model of the spread developed
by Stoll (1978) to provide evidence on the determinants of the spread. They confirm, for REITS,
the basic results reported by Stoll—that liquidity is a positive function of the price and dollar
volume, and a negative function of the volatility of stock returns.
Cole (1998) reexamines the 1990 and 1994 data used by Bhasin, Cole and Kiely (1997).
He finds that the improvements in liquidity reported by Bhasin, Cole and Kiely are attributable to
the ―new REITs‖ that went public during 1991 – 1993 and were larger, higher priced, and traded
with more volume than REITs existing in 1990. When he looks only at REITs that existed during
both periods, he finds that REIT liquidity for these firms actually declined.
Clayton and MacKinnon (2000) use intraday data from 1993 and 1996 to decompose the
percentage spread into three components, as suggested by the model developed by Kyle
(1985)—the cost of liquidating a position quickly (―tightness‖), the ability to liquidate a large
position without materially affecting price (―depth‖), and the ability of a stock’s price to recover
quickly from a random market shock (―resiliency‖) . Like Bhasin, Cole and Kiely (1997), they
sample. This finding contrasts with those of Cole (1998), but most of the ―new REITs‖ in Cole’s
study only began to trade during 1992. Clayton and MacKinnon’s decomposition of the spread
suggests that most of the improvement in liquidity was attributable to improvements in depth
rather than tightness.
Benveniste, Capozza and Seguin (2001) use data on REITS from 1985 – 1992 to analyze
the relation between liquidity and market value. Comparing the replacement value of assets held
by a REIT to the value of the REIT itself, they find that securitization through the REIT structure
increases the value of the underlying real estate assets by 10 – 20 percent. They also analyze
cross-sectional determinants of liquidity as measured by dollar volume, and find that the market
value of equity explains almost half the variation in dollar volume, but that the statistical
significance of this relation disappears when they include control variables for institutional
ownership and property focus.
Danielson and Harrison (2002) examine how private information affects the liquidity of
REITs. They find that NYSE and AMEX REITs are significantly more liquid than NASDAQ
REITs and that REITs holding more transparent portfolios trade at narrower spreads.
Marcato and Ward (2007) develop a model for decomposing REIT liquidity into the three
components suggested by the model of Kyle (1985), but, unlike Clayton and MacKinnon (2000),
they use data on daily stock returns rather than market microstructure data. Marcato and Ward
seek to establish that the results reported by Clayton and MacKinnon intraday data can be
approximated by their model using daily data. Marcato and Ward find that many of the results
reported by Clayton and MacKinnon can, indeed, be approximated by their model using daily
In a study very similar in spirit to our own, Brounen, Eichholtz and Ling (2009) employ
three liquidity measures based upon daily data to explore liquidity across four international
markets (Australia, Europe, the U.K. and the U.S.). They find that both property and
non-property shares trading in the U.S. market are more liquid than shares trading in the other three
markets analyzed.
3. Data and Methodology
3.1 Data
Our data come primarily from two sources: CRSP and Compustat. From CRSP, we
obtain daily data from 1988 – 2007 on exchange listing, price, volume, returns and shares
outstanding for all firms with standard industrial classification 6798. We also obtain closing bid
and ask prices from 1993 – 2007 as NYSE and AMEX data on bids and asks became available in
late December of 2002. To mitigate the influences of IPOs and mergers, we require that a REIT
trade on at least 245 days in a year for that firm-year data to be included in our analysis.
From Compustat, we obtain annual data from 1988 – 2007 on total assets, total debt, total
liabilities, and equity investments in real estate. We then merge our data from CRSP and
Compustat by CUSIP and YEAR to obtain our final sample of 3,209 firm-year observations on
337 REITs over 20 years.
Table 1 shows the number of REITs in our sample by year and exchange. The total
number of REITs ranges from a low of 99 in 1988 to a high of 206 in 1995. The number of
NYSE REITs ranges from a low of 36 in 1988 to a high of 155 in 2005, while the number of
AMEX (NASDAQ) REITs ranges from a low of 18 (7) in 2007 (2007) to a high of 53 (36) in
3.2 Methodology
3.2.1. Measuring Liquidity
We calculate three alternative measures of liquidity based upon daily stock-price data—
the percentage bid-ask spread, the dollar volume, and the price impact as proposed by Amihud
(2002).
The Percentage Bid-Ask Spread is calculated as:
Percentage Spread i, t = (Bid i, t– Ask i, t) / [(Bid i, t + Ask i, t) / 2] (1)
The percentage spread is the most widely used measure of liquidity, but has been criticized by
some academics as measuring only the ―tightness‖ component of liquidity. Lower values indicate
greater liquidity.
The Dollar Volume is calculated as:
Dollar Volume i, t =Volume i, t x Price i, t (2)
The dollar volume has been used by Benveniste, Capozza, Seguin (2001) and others to capture
the ―depth‖ component of liquidity. Higher values of dollar volume indicate greater market depth
and greater liquidity.
The Price Impact measure of liquidity was originally proposed by Amihud (2002), and is
closely related to another measure of liquidity known as the Amivest Measure, which is the ratio
Eleswarapu (1998) and Amihud et al. (1997). The Price Impact for stock i on day t is calculated
as:
Price Impact i, t = ABS (Return i, t) / Dollar Volume i, t (3)
Where ABS indicates the absolute value, Return i, t is the daily return on stock i for day t; and
Dollar Volume i, t is as defined above. The advantage of the Price Impact over the Amivest
measure is the ease of its interpretation—the price impact is simply the change in share price per
dollar of volume. Like the Dollar Volume, the Price Impact is primarily a measure of the ―depth‖
component of liquidity. Lower values of Price Impact indicate more depth and liquidity.
For each measure of liquidity, we first calculate its value on a daily basis for each REIT.
Next, we calculate annual averages for each REIT. We then use these annual averages by REIT
to calculate annual measures of liquidity for the industry so that we can track changes in liquidity
over time.
3.2.2. Explaining the Percentage Spread
We use an empirical model of the percentage spread developed by Stoll (1978) and used
by Chiang and Venkatesh (1988) and Bhasin, Cole and Kiely (1997). Market makers incur three
types of costs: fixed costs, inventory costs, and adverse-information costs. In Stoll’s model, fixed
costs are proxied by share price; inventory costs are proxied by volatility as measured by the
standard deviation of returns; and adverse information costs are proxied by turnover, as
We also include size (as measured by market capitalization) because Chiang and
Venkatesh (1988) and Nelling et al. (1995) find this variable to be a significant determinant of
spreads. We include exchange dummies because Kadlec and McConnell (1994) find that
changing from an AMEX or NASDAQ listing to a NYSE listing reduces a stock’s spread. Our
model is as follows:
Percentage Bid-Ask Spread i, t =
F ( Price, Standard Deviation of Returns, Turnover, Market Cap, AMEX, NASDAQ) (4)
We transform all continuous variables into natural logarithms. We summarize our expectations
regarding the relation between liquidity and our explanatory variables below:
Variable Expected Sign
ln (Share Price) -
ln (Std. Dev of Returns) +
ln (Turnover) -
ln (Market Cap) -
4. Results
4.1. Percentage Bid-Ask Spreads By Year and Exchange
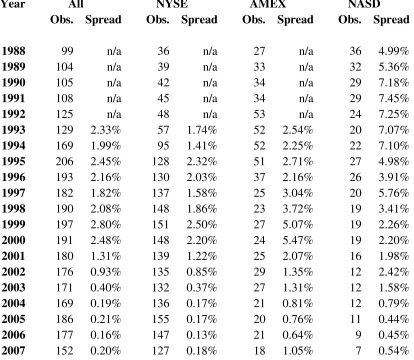
In column 2 of Table 2, we present median daily REIT percentage bid-ask spreads over
the period 1993 – 2007.1 For all REITs, the average annual percentage spread rose from 2.33%
in 1993 to 2.45% in 1995, fell to 1.82% in 1997, and peaked at a high of 2.80% 1999. From 1999
through 2004, we find dramatic declines in the percentage spread—from 2.80% to 0.19%.
During 2005 – 2007, the percentage spread dropped to a low of 0.16% in 2006 before rising to
0.20% in 2007.
In columns 3 – 5 of Table 2, we present median annual REIT percentage bid-ask spreads
by exchange listing: NYSE, AMEX or NASDAQ. The spreads of NYSE firms are lower than
those of firms on either the AMEX or NASDAQ in each year except for 2000. In most years,
these differences are massive; in 2006, for example, the 0.13 percentage spread is less than one
fourth that of AMEX REITs and one-third that of NASDAQ REITs. For 2003 – 2007, the
percentage spreads of NYSE REITs are less than half the spreads of AMEX and NASDAQ
REITs in each year.
Overall, the statistics in Table 2, which we present graphically in Figure 1, show
fluctuating percentage spreads during the 1990s, followed by dramatic declines during the
2000 – 2004 period, and a leveling off during 2005 – 2007.
1
4.2. Dollar Volume by Year and Exchange
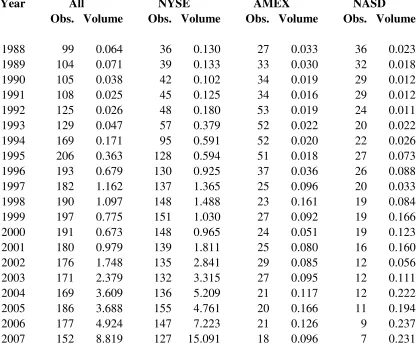
In column 2 of Table 3, we present the median daily dollar volume (in millions) over the
period 1988 – 2008. Median dollar volume fluctuated between 0.025 million and 0.071 million
1988 – 1993, then more than doubled to 0.17 million in 1993, and doubled again in 1994 to 0.36
million and in 1995 to 0.68 million . Dollar volume hit its 1990s peak at 1.16 million in 1997,
before declining to 0.67 million in 2000. Over the subsequent eight years from
2000 through 2007, dollar volume spiked upward in each year to a peak of 8.82 million in 2007,
a more than twelve-fold increase in this measure of liquidity.
In columns 3 – 5 of Table 3, we explore the changes in dollar volume by exchange
listing. In this table, we see that the huge increases in dollar volume were limited to NYSE
firms, which rose from 0.96 million in 1999 to 15.1 million in 2007. In contrast, the dollar
volume of NASDAQ REITs over the same period did not even double, from 0.12 million to a
high of 0.23 million in 2007. The dollar volume of AMEX REITs rose from 0.05 million in 2000
to a high of 0.17 million in 2005 before declining to 0.10 million in 2007.
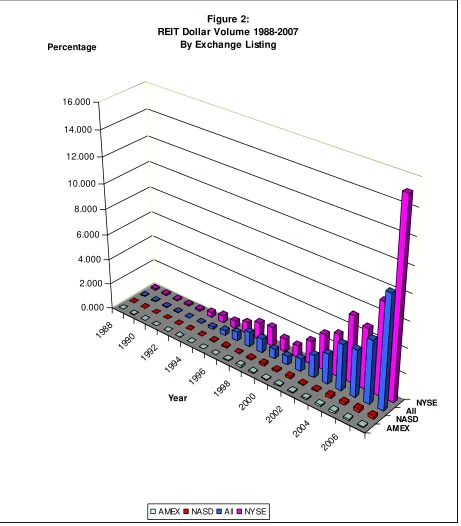
In summary, the statistics in Table 3, which we present graphically in Figure 2, show that
REIT liquidity as measured by median daily dollar volume increased by more than tenfold
during the 1990s, and then increased by another tenfold during the 2000s. However, most of this
increased liquidity was realized only by NYSE REITs; REITs listed on AMEX and NASDAQ
enjoyed increased liquidity on a much more modest scale, finishing in 2007 at an order of
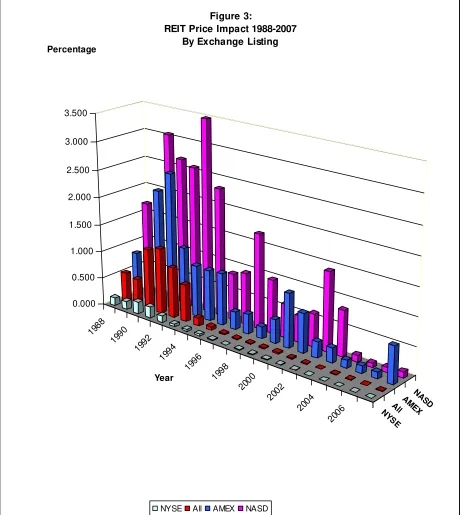
4.3. Price Impact by Year and Exchange
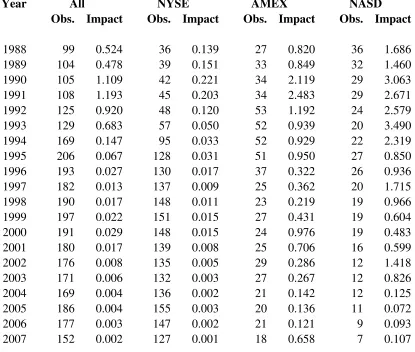
In column 2 of Table 4, we present the median daily price impact over the 1988 – 2007
period. After jumping from around 0.5 in 1988 and 1989 to 1.11 in 1990 and to a peak of 1.19 in
1991, the price impact declined to 0.68 in 1993 and then plummeted to 0.15 in 1994. During
1995 – 1997, the price impact continued to decline to a low of 0.01 before rising to 0.03 in 2000.
From 2001 – 2007, the price impact resumed its decline, signaling greater market depth, from
0.017 in 2001 to a low of 0.002 in 2007.
In columns 3 – 5 of Table 4, we explore changes in the price impact by exchange listing.
Most striking in these columns are the wide differences across exchanges. In 1988, the Price
Impact is 1.69 for NASDAQ REITs, 0.82 for AMEX REITs, but only 0.139 for NYSE REITs.
AMEX REITs do not reach the 1988 level of Price Impact for NYSE REITs until 2005;
NASDAQ REITs until 2004. However, the Price Impact of NYSE REITs had dropped to a
miniscule 0.004 in 2004 and 2005. By 2004, the Price Impact of NYSE REITs had fallen to only
0.002. Thus, liquidity as measured by the Price Impact remained roughly five times greater for
AMEX and NASDAQ REITs than for NYSE REITs pretty much throughout the last two
decades.
In summary, the statistics in Table 4, which we present graphically in Figure 3, show that
REIT liquidity as measured by Amihud Price Impact declined by an order of magnitude during
the 1990s, and then declined by another order of magnitude during the 2000s. However, this
improvement in depth was limited to NYSE REITs; AMEX and NASDAQ REITs realized much
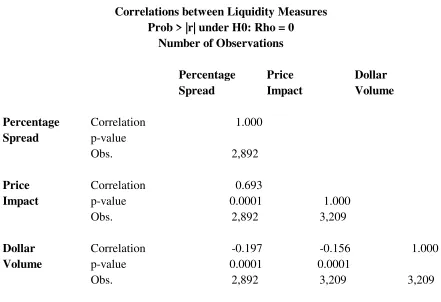
4.4. Correlations of Liquidity Measures
In Table 5, we present the Pearson product-moment correlation coefficients calculated
over the 1993 – 2007 period for each of our three annual measures of liquidity: the Percentage
Spread, the Dollar Volume and the Price Impact. We find statistically significant and
numerically large correlations between the Percentage Spread and both the Price Impact (+0.69)
and the Dollar Volume (−0.20)—each of which is a measure of market depth. The percentage
spread has been criticized by some academics, such as Brennan and Subrahmanyam (1996), as
measuring only the ―tightness‖ of the market. Our results strongly refute this criticism—at least
for REITs. Clearly, the percentage spread is also measuring the depth of the market, as well. We
also find a negative and significant correlation between the Price Impact and Dollar Volume.
(−0.16). What is surprising is that the Price Impact is far more highly correlated with the
Percentage Spread than with the Dollar Volume.
4.5. Descriptive Statistics and Correlations of the Explanatory Variables
In Table 6, we present descriptive statistics for the variables that, after logarithmic
transformations, we use in Stoll’s empirical model of the percentage spread. The mean
percentage spread is 2.7 percent, the mean dollar volume is $3.68 million and the mean price
impact is 0.76. The average share price is $19.41, and ranges from $0.30 to $397.51. The
average dollar turnover is $3.14 million, with a range of $0.18 million to $174 million. The
average market cap is $764 million and ranges from a low of $28 million to a high of $23 billion.
The average standard deviation of returns (volatility) is 0.020.
The explanatory variables are likely to be highly correlated, so we present pair-wise
explanatory variables are statistically significant at better than the 0.0001 level, with correlation
coefficients ranging from 0.08 between the AMEX dummy and the log of the standard deviation
of returns to 0.77 between the log of share price and the log of market cap. These statistics
indicate the potential for multicollinearity in our regression results, which we will explore in
more detail below.
4.6. Determinants of Percentage Bid-Ask Spread
In Tables 8 – 12, we present results from estimating eq. (4), where we use Stoll’s
empirical model of the percentage bid-ask spread to explore determinants of REIT spreads. In
Table 8, we estimate the model for several different sub-periods. In Table 9, we add controls for
year fixed-effects by including a set of year dummy variables to explore the incremental
explanatory power of this panel estimation technique; we also estimate the basic model
separately for NYSE REITs and for AMEX and NASDAQ REITs. In Table 10, we repeat the
analysis in Table 9 while limiting the sample to a balanced panel of 46 REITs for which annual
data are available throughout the 1993-2007 period. In Table 11, we limit our analysis to 1994 in
order to compare our findings with those of Bhasin, Cole and Kiely (1998). Finally, in Table 12,
we explore the impact of portfolio composition on the percentage spread.
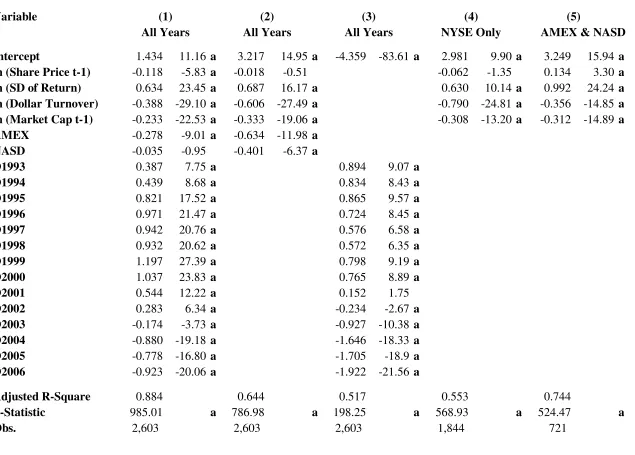
4.7. Explaining the Percentage Bid-Ask Spread 1993 – 2007
In Table 8, we present the results from estimating eq. (4) without time fixed effects for
various time periods within 1993 - 2007. In specification (1), we include our six explanatory
variables and examine data from 1993 – 2007. Our results show that these six variables account
of the explanatory variables has the expected sign, except for the two exchange dummies. Both
AMEX and NASD are negative and statistically significant, indicating that percentage spreads
are lower for AMEX and NASD REITs than for NYSE REITs, but only after controlling for the
other four explanatory variables. The results for those four variables indicate that percentage
spreads are narrower when share prices are higher, when turnover is higher and when market
capitalization is higher; and when return volatility is lower. The coefficients indicate that the
influence on the percentage spread is largest for Dollar Turnover, followed by Volatility of
Returns, Market Cap and Share Price.
One concern about Stoll’s model is the possibility for endogeneity caused by the
inclusion of Share Price as the denominator of the dependent variables and as an explanatory
variable. Share Price also is a component of market cap (share price times shares outstanding).
To address these concerns, we replace the log of share price and the log of market cap observed
for year t with the same variables observed for year t−1, i.e., with lagged values of those two
variables. Inclusion of these lagged variables causes us to lose 289 firm-year observations. As
shown in specification (2), the results are virtually unchanged, except that the log of share price
is no longer statistically significant. Its coefficient drops from -0.168 (t-statistic = -5.23) in
specification (1) to only -0.18 (t-statistic=-0.51) in specification (2). In this specification, the
coefficients indicate that the influence on the percentage spread is largest for Volatility of
Return, followed by Dollar Turnover and (lagged) Market Cap, with Share Price being
statistically insignificant. In the remainder of our tests, we will use the two lagged variables in
place of their contemporaneous counterparts.
Another concern about our model is the potential for multicollinearity, which can lead to
the explanatory variables are highly correlated. Consequently, we run collinearity diagnostics to
assess whether collinearity is a problem in our model. We examine the condition indices for each
variable, as suggested by Besley, Kuhn and Welsch (1980), who caution about values greater
than 10, and, especially, about values greater than 100. The highest condition index in our model
is only 4.1, indicating that multicollinearity is not a problem. We also check the variance
inflation factor for each variable, and also find that our model does not appear to be materially
affected by multicollinearity.
Another concern about our model are the vast changes that occurred in the REIT industry
during the 15 years we study. To address this concern, we split our sample roughly in half and
analyze the seven-year sub-periods 1993 – 2000 and 2001 – 2007 separately. Another reason for
examining the two periods separately is the decimalization of the three stock exchanges that
occurred during late 2000 through early 2001. Decimalization of the NYSE and AMEX was
completed in January 2001, with the NASDAQ following in April 2001. The results for the first
half and last half of our sample period appear in Table 8 as specifications (3) and (4),
respectively. In each specification, each of the six explanatory variables is statistically significant
with the same sign as in specification (2). However, the coefficients for Share Price, Market Cap
and Dollar Turnover are significantly larger in magnitude during the later period. These results
indicate that controls for year fixed effects are likely to be appropriate.
For the 1993 – 2000 period, the model explains 74 percent of the variability in the
percentage spread; for the 2001 – 2007 period, the model explains 66 percent of the variation in
4.8. Explaining the Percentage Bid-Ask Spread 1993 – 2007 including Time Fixed Effects
In Table 9, we explore the effects of controlling for time fixed effects by including a
series of dummy variables for each year in our sample. We exclude 2007 so that these variables
measure the difference in the percentage spread relative to the 2007 percentage spread. In
specification (1), we include the six explanatory variables appearing in Table 8 along with a set
of 14 year dummies, indicating observations from 1993 – 2006. In specification (2), we include
only the six explanatory variables from Table 8, whereas, in specification (3), we include only
the 14 year dummies. By comparing the adjusted-Rsquares of these three alternative
specifications, we can estimate the incremental explanatory power of the two sets of variables. In
specification (1), we find that 19 of our 20 explanatory variables are statistically significant, with
the sole exception being the dummy variable indicating REITs that trade on the NASDAQ
exchange. All 14 of the year dummies are statistically significant, and indicate the differences in
percentage spreads across years relative to 2007. For 1993 – 2002, the coefficients on the year
dummies are positive, indicating that spreads were wider in those years relative to 2007. For
2003 – 2006, the coefficients on the year dummies are negative, indicating that spreads were
narrower in those years relative to 2007. In other words, liquidity declined in 2007 as the
financial crisis hit the REIT industry, by 92 basis points from 2006, after controlling for price,
volatility, turnover, market cap and exchange. Overall, the variables in specification (1) explain
88 percent of the variation in the percentage spread over the 1993 – 2007 period.
To evaluate the incremental explanatory power of the two sets of variables, we compare
the adjusted Rsquares of specifications (2) and (3) relative to specification (1). Price, volatility,
turnover, market cap and exchange explain 64 percent of the variability in the percentage spread
model to explain the percentage spread by an incremental 24 percentage points. Alternatively,
the 14 year dummies explain 52 percent of the variation in the percentage spread over the 1993 –
2007 period so that the six variables in specification (2) improve our ability to explain the
percentage spread by 36 percentage points.
4.9. Explaining the Percentage Bid-Ask Spread 1993 – 2007: NYSE vs. AMEX/NASDAQ
Another potential concern about our results is the vast differences in liquidity
documented in Table 2 for NYSE REITs relative to AMEX and NASDAQ REITs. A logical
question is whether our empirical model is valid for this latter group of firms or just for NYSE
firms. To address this concern, we estimate our basic model (without exchange dummies and
year dummies) separately for NYSE REITs in specification (4) of Table 9 and for AMEX and
NASDAQ REITs in specification (5) of Table 9. The primary difference in the two specifications
is that Share Price is negative and insignificant for NYSE REITs but positive and significant for
AMEX/NASDAQ REITs. Volatility is positive and significant in both specifications and both
turnover and market cap are negative and significant in both specifications. These four variables
explain only 55 percent of the variability in the percentage spread of NYSE REITs but 74
percent of the variability of AMEX/NASDAQ REITs during 1993 – 2007. Not shown in Table 9
are results from estimating the same two specifications but also including the 14 year dummy
variables. The results for price, volatility, turnover and market cap are qualitatively unchanged
by adding the time fixed effects, but the explanatory power of the model improves to 91 percent
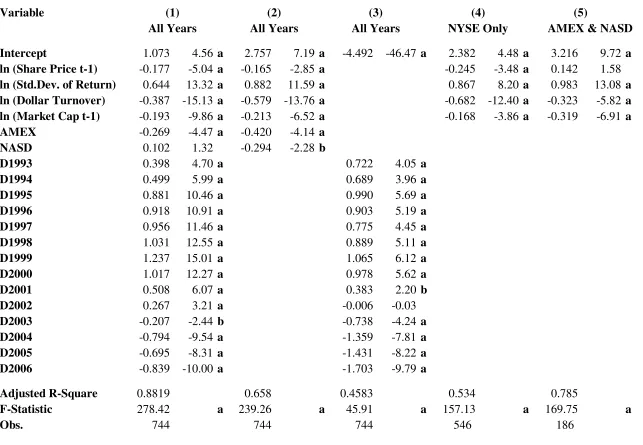
4.10. Explaining the Percentage Bid-Ask Spread 1993 – 2007 for a Balance Panel of REITs
Thus far, we have conducted our analysis using an unbalanced panel of REITs. In other
words, the composition of the sample changes each year, depending upon IPOs and mergers &
acquisitions. As Cole (1998) documents, increases in REIT liquidity reported by Bhasin, Cole
and Kiely (1998) from 1990 to 1994 were driven by changes in the sample across the two years.
The large REITs that went public during 1993 exhibited much greater liquidity than the smaller
REITs that existed during both 1990 and 1994. In fact, the liquidity of these latter REITs actually
declined over the 1990 to 1994 period.
Similar concerns arise about our results. Does liquidity improve for the average REIT or
are the observed improvements in liquidity driven by differences in the annual cross-sections
over time? To address this concern, we construct a balanced panel of the 46 REITs in our sample
for which data are available for all 15 years from 1993 – 2007. For this balanced panel, the
percentage spread ranges from 2.0% to 2.5% during 1993 – 2000, but from 2001 – 2004,
percentage spreads dropped from 1.6% to 0.2%, where they remained for 2005 – 2007. The
dollar volume increased from 0.10 million during the 1988 – 1992 period to 0.71 million in
2000, and then increased to 6.60 million in 2007. The price impact dropped from 0.20 in 1988 –
1992 to 0.03 in 2000 and then to 0.003 in 2005 – 2007. In general, these results (which are
available from the author upon request) are consistent with those reported in Tables 2 – 4, which
leads us to conclude that improvements in liquidity were not driven by changes in the annual
cross-sections within our unbalanced panel.
We explore this issue further in Table 10, where we replicate the analysis in Table 9 but
using our balanced panel. In specification (1), price, volatility, turnover and market cap are
and significant, but the dummy for NASDAQ REITs is positive and insignificant. Each of the
year dummies is significant, with 1993 – 2002 coefficients being positive and 2003 – 2006
coefficients being negative. This specification explains 88 percent of the variability in the
percentage spreads of these 46 REITs over 1993 – 2007. In specification (2), we exclude the year
dummies while, in specification (3), we include only the year dummies. Specification (2)
explains 66 percent of the variability in the percentage spread while specification (3) explains
only 46 percent of the variability in the percentage spread. Hence, the incremental explanatory
power of the year dummies is 22 percentage points whereas the incremental explanatory power
of the remaining variables is 42 percentage points.
Finally, specifications (4) and (5) present results from estimating our model without time
fixed effects estimated separately for NYSE REITs and for AMEX and NASDAQ REITs,
respectively. As in Table 9, the key difference is that the sign of Share Price flips to positive for
AMEX/NASDAQ REITs; however, this coefficient is not significantly different from zero in
Table 10. In general, all of the results in Table 10 based upon the balanced panel are not
qualitatively different than those appearing in Table 9 for the unbalanced panel.
4.11. Comparison with Bhasin Cole and Kiely (1997)
In Table 11, we estimate eq. (4) for 1994 only in order to compare our results with those
reported by Bhasin, Cole and Kiely (1997) (―BCK‖) using intraday market microstructure data
from 1994. We are unable to make comparisons with the BCK results for 1990 because daily
bid- and ask-prices are not available for NYSE or AMEX firms prior to 1993. Our sample is
significantly smaller than that of BCK (169 versus 337), but the explanatory power of the two
statistically significant in BCK’s model also is statistically significant in our model and each has
the same sign across the two models. This suggests that percentage bid-ask spread measured
using daily closing spreads make reasonable proxies for percentage bid-ask spreads measured
using intra-day market micro-structure data.
4.12. Equity Real-Estate Investments and REIT Liquidity
In Table 12, we present the coefficients from re-estimating eq. (4) on a year-by-year basis
from 2001 – 2007 with one additional variable—the percentage of equity investments in real
estate as a percentage of total assets. Unfortunately, this variable is not available for earlier years.
For brevity, we only present the coefficient on the equity estate variable. The equity
real-estate variable is positive throughout the 2002-2004 period, indicating that percentage spreads
are wider when firms held more equity investments in real estate, but that this relation switched
signs in 2006-2007. These results are consistent with the story that, in the early part of the
decade, investors viewed equity real estate investments as more opaque than the primary
alternative REIT asset—mortgage-backed securities; but, as the subprime mortgage crisis
emerged, investors changed their perceptions in favor of equity real estate investments and
5. Summary and Conclusions
In this study, we present evidence on REIT liquidity and its determinants over the
1988-2007 period. We focus upon three liquidity measures that do not require micro-structure data: the
percentage bid-ask spread, the dollar volume and the price impact measure proposed by Amihud
(2002).
We find that REIT liquidity deteriorated during the late 1990s but improved dramatically
during 2000 – 2006, with the notable exception of 2007. Liquidity improved the most for REITs
traded on the NYSE, and was an order of magnitude better than liquidity of REITs traded on the
AMEX or NASDAQ. We link the deterioration in liquidity observed in 2007 to the investment
portfolio of a REIT. Greater portfolio allocations to equity real estate rather than to mortgage
investments were associated with greater liquidity in 2007.
We provide panel-data evidence on the key determinants of the percentage bid-ask spread
that largely confirms the results reported by Bhasin, Cole and Kiely (1997) for 1990 and 1994:
the percentage spread is positively related to the volatility of stock returns and negatively related
to dollar volume turnover, share price and market capitalization.
Finally, we provide evidence that these results obtained using daily closing bid- and
ask-prices are not qualitatively different from those obtained using market micro-structure data. This
suggests that we can use liquidity measures based upon readily available daily return data rather
References:
Amihud, Y. 2002. Illiquidity and Stock Returns: Cross-section and Time-series Effects.
Journal of Financial Markets 5: 31–56.
Amihud, Y. and H. Mendelson. 1986. Asset Pricing and the Bid-Ask Spread. Journal of Financial Economics 17:223-249.
Below, S., J. Kiely and W. McIntosh. 1995. An Examination of Informed Traders and the Market Microstructure of Real Estate Investment Trusts. Journal of Real Estate Research 10: 335-361.
Benveniste, L., D. Capozza and P. Seguin. 2001. The Value of Liquidity. Real Estate Economics
29: 633-660.
Bhasin, V., R. Cole and J. Kiely. 1997. Changes in REIT Liquidity 1990 – 1994: Evidence from Intra-Day Transactions. Real Estate Economics 25: 615-630.
Besley, D., E. Kuh and R. Welsch. 1980. Regression diagnostics: Identifying influential data and sources of collinearity. New York: John Wiley & Sons.
Biais, B., L. Glosten, and C. Spatt. 2005. Market Microstructure: A Survey of Microfoundations, Empirical Results, and Policy Implications. Journal of Financial Markets 8: 217-264.
Brennan, M. and A. Subrahmanyam. 1996. Investment Analysis and Price Formation in Securities Markets. Journal of Financial Economics 38: 361–381.
Brounen, D., P. Eichholtz, and D. Ling. 2009. The liquidity of property shares: An international comparison. Real Estate Economics 37, 413-445.
Chiang, R. and P. Venkatesh. 1988. Insider Holdings and Perceptions of Information Asymmetry: A Note. The Journal of Finance 43: 1041-1048.
Demsetz, H. 1968. The Cost of Transacting. Quarterly Journal of Economics 82:33-53.
Chordia, T., R. Roll and A. Subrahmanyam. 2000. Commonality in Liquidity. Journal of Financial Economics 56: 3–28.
Chordia, T., R. Roll and A. Subrahmanyam. 2001. Market Liquidity and Trading Activity. The Journal of Finance 56: 501–530.
Clayton, J. and G. MacKinnon. 2000. Measuring and Explaining Changes in REIT Liquidity: Moving Beyond the Bid-Ask Spread. Real Estate Economics 28: 89–115.
Danielson, B. and D. Harrison. 2002. The Impact of Potential Private Information on REIT Liquidity. Journal of Real Estate Research 19: 49-71.
Kadlec, G. and J. McConnell. 1994. the Effect of Market Segmentation and Illiquidity on Asset Prices: Evidence from Exchange Listings. The Journal of Finance 49: 611-636.
Kyle, A. 1985. Continuous Auctions and Insider Trading. Econometrica 53: 1315–1335.
Madhavan, A. 2000. Market Microstructure: A Survey. Journal of Financial Markets 3: 205-258.
Marcato, G., Ward, C. 2007. Back from Beyond the Bid – Ask Spread: Estimating Liquidity in International Markets. Real Estate Economics 35: 599-622.
Nelling, E., J. Mahoney, T. Hildebrand and M. Goldstein. 1995. Real Estate Investment Trusts, Small Stocks and Bid-Ask Spreads. Real Estate Economics 23: 45–63.
O’Hara, M. 1995. Market Microstructure Theory. Blackwell, Cambridge, MA.
Stoll, H. 1978. The Pricing of Security Dealer Services: An Empirical Study of NASDAQ Stocks. The Journal of Finance 33: 1153-1172.
Year Total NYSE AMEX NASD
1988 99 36 27 36
1989 104 39 33 32
1990 105 42 34 29
1991 108 45 34 29
1992 125 48 53 24
1993 129 57 52 20
1994 169 95 52 22
1995 206 128 51 27
1996 193 130 37 26
1997 182 137 25 20
1998 190 148 23 19
1999 197 151 27 19
2000 191 148 24 19
2001 180 139 25 16
2002 176 135 29 12
2003 171 132 27 12
2004 169 136 21 12
2005 186 155 20 11
2006 177 147 21 9
2007 152 127 18 7
Table 1:
Number of REITs 1988 - 2007 By Year and Exchange Listing
NYSE indicates REITs trading on the New York Stock Exchange. AMEX indicates REITs trading on the American Stock Exchange. NASD indicates REITs trading on the NASDAQ Stock
Year
Obs. Spread Obs. Spread Obs. Spread Obs. Spread
1988 99 n/a 36 n/a 27 n/a 36 4.99%
1989 104 n/a 39 n/a 33 n/a 32 5.36%
1990 105 n/a 42 n/a 34 n/a 29 7.18%
1991 108 n/a 45 n/a 34 n/a 29 7.45%
1992 125 n/a 48 n/a 53 n/a 24 7.25%
1993 129 2.33% 57 1.74% 52 2.54% 20 7.07%
1994 169 1.99% 95 1.41% 52 2.25% 22 7.10%
1995 206 2.45% 128 2.32% 51 2.71% 27 4.98%
1996 193 2.16% 130 2.03% 37 2.16% 26 3.91%
1997 182 1.82% 137 1.58% 25 3.04% 20 5.76%
1998 190 2.08% 148 1.86% 23 3.72% 19 3.41%
1999 197 2.80% 151 2.50% 27 5.07% 19 2.26%
2000 191 2.48% 148 2.20% 24 5.47% 19 2.20%
2001 180 1.31% 139 1.22% 25 2.07% 16 1.98%
2002 176 0.93% 135 0.85% 29 1.35% 12 2.42%
2003 171 0.40% 132 0.37% 27 1.31% 12 1.58%
2004 169 0.19% 136 0.17% 21 0.81% 12 0.79%
2005 186 0.21% 155 0.17% 20 0.76% 11 0.44%
2006 177 0.16% 147 0.13% 21 0.64% 9 0.45%
[image:28.612.93.507.156.516.2]2007 152 0.20% 127 0.18% 18 1.05% 7 0.54%
Table 2:
Median Daily Percentage Bid-Ask Spread 1988 - 2007 By Year and Exchange Listing
All NYSE AMEX NASD
Spread is the median of the annual averages of the daily percentage bid-ask spread for REITs that traded for at least 245 days during the year. NYSE indicates REITs trading on the New York Stock Exchange. AMEX indicates REITs trading on the American Stock Exchange. NASD
1993 19
94 1995
19 96
19 97
1998 19
99 2000
20 01 20 02 20 03
2004 20
05 2006
[image:29.612.78.539.77.570.2]20 07 All NYSE AMEX NASD 0.00% 1.00% 2.00% 3.00% 4.00% 5.00% 6.00% 7.00% 8.00% Percentage Year Figure 1:
REIT Percentage Spreads 1993-2007 By Exchange Listing
All NYSE AMEX NASD
Spread is the median of the annual averages of the daily percentage bid-ask spread for REITs that traded for at least 245 days during the year. NYSE indicates REITs trading on the New York Stock Exchange. AMEX indicates REITs trading on the American Stock Exchange. NASD
Year
Obs. Volume Obs. Volume Obs. Volume Obs. Volume
1988 99 0.064 36 0.130 27 0.033 36 0.023
1989 104 0.071 39 0.133 33 0.030 32 0.018
1990 105 0.038 42 0.102 34 0.019 29 0.012
1991 108 0.025 45 0.125 34 0.016 29 0.012
1992 125 0.026 48 0.180 53 0.019 24 0.011
1993 129 0.047 57 0.379 52 0.022 20 0.022
1994 169 0.171 95 0.591 52 0.020 22 0.026
1995 206 0.363 128 0.594 51 0.018 27 0.073
1996 193 0.679 130 0.925 37 0.036 26 0.088
1997 182 1.162 137 1.365 25 0.096 20 0.033
1998 190 1.097 148 1.488 23 0.161 19 0.084
1999 197 0.775 151 1.030 27 0.092 19 0.166
2000 191 0.673 148 0.965 24 0.051 19 0.123
2001 180 0.979 139 1.811 25 0.080 16 0.160
2002 176 1.748 135 2.841 29 0.085 12 0.056
2003 171 2.379 132 3.315 27 0.095 12 0.111
2004 169 3.609 136 5.209 21 0.117 12 0.222
2005 186 3.688 155 4.761 20 0.166 11 0.194
2006 177 4.924 147 7.223 21 0.126 9 0.237
[image:30.612.94.513.167.517.2]2007 152 8.819 127 15.091 18 0.096 7 0.231
Table 3:
Median Daily Dollar Volume 1988 - 2007 By Year and Exchange Listing
All NYSE AMEX NASD
Volume is the median of the annual averages of the daily dollar trading volume for REITs that traded for at least 245 days during the year. NYSE indicates REITs trading on the New York Stock Exchange. AMEX indicates REITs trading on the American Stock Exchange.
198 8 199 0 199 2 199 4 199 6 199 8 200 0 200 2 200 4 200 6 AMEX NASDAll NYSE 0.000 2.000 4.000 6.000 8.000 10.000 12.000 14.000 16.000 Percentage Year Figure 2:
REIT Dollar Volume 1988-2007 By Exchange Listing
AMEX NASD All NYSE
Year
Obs. Impact Obs. Impact Obs. Impact Obs. Impact
1988 99 0.524 36 0.139 27 0.820 36 1.686
1989 104 0.478 39 0.151 33 0.849 32 1.460
1990 105 1.109 42 0.221 34 2.119 29 3.063
1991 108 1.193 45 0.203 34 2.483 29 2.671
1992 125 0.920 48 0.120 53 1.192 24 2.579
1993 129 0.683 57 0.050 52 0.939 20 3.490
1994 169 0.147 95 0.033 52 0.929 22 2.319
1995 206 0.067 128 0.031 51 0.950 27 0.850
1996 193 0.027 130 0.017 37 0.322 26 0.936
1997 182 0.013 137 0.009 25 0.362 20 1.715
1998 190 0.017 148 0.011 23 0.219 19 0.966
1999 197 0.022 151 0.015 27 0.431 19 0.604
2000 191 0.029 148 0.015 24 0.976 19 0.483
2001 180 0.017 139 0.008 25 0.706 16 0.599
2002 176 0.008 135 0.005 29 0.286 12 1.418
2003 171 0.006 132 0.003 27 0.267 12 0.826
2004 169 0.004 136 0.002 21 0.142 12 0.125
2005 186 0.004 155 0.003 20 0.136 11 0.072
2006 177 0.003 147 0.002 21 0.121 9 0.093
[image:32.612.92.507.153.505.2]2007 152 0.002 127 0.001 18 0.658 7 0.107
Table 4:
Median Price Impact 1988 - 2007 By Year and Exchange Listing
All NYSE AMEX NASD
Impact is the price impact as defined by Amihud (2002), which is the absolute value of the daily stock return divided by the daily dollar trading volume, for REITs that traded for at least 245 days during the year. NYSE indicates REITs trading on the New York Stock Exchange. AMEX
198 8 199 0 199 2 199 4 199 6 199 8 200 0 200 2 200 4 200 6 N YSE A ll AM EX NA SD 0.000 0.500 1.000 1.500 2.000 2.500 3.000 3.500 Percentage Year Figure 3:
REIT Price Impact 1988-2007 By Exchange Listing
NYSE All AMEX NASD
Impact is the price impact as defined by Amihud (2002), which is the absolute value of the daily stock return divided by the daily dollar trading volume, for REITs that traded for at least 245 days during the year. NYSE indicates REITs trading on the New York Stock Exchange. AMEX
Percentage Price Dollar Spread Impact Volume
Percentage Correlation 1.000
Spread p-value
Obs. 2,892
Price Correlation 0.693
Impact p-value 0.0001 1.000
Obs. 2,892 3,209
Dollar Correlation -0.197 -0.156 1.000
Volume p-value 0.0001 0.0001
[image:34.612.72.513.85.387.2]Obs. 2,892 3,209 3,209
Table 5
Correlations between Liquidity Measures Prob > |r| under H0: Rho = 0
Number of Observations
Variable Obs. Median Mean Std. Error Minimum Maximum
Percentage Spread 2,892 0.016 0.027 0.001 0.000 0.701
Price Impact 3,209 0.028 0.762 0.030 0.000 12.003
Dollar Volume 3,209 0.653 3.676 0.187 0.000 174.268
Share Price 3,209 16.12 19.408 0.307 0.097 397.512
Std.Dev. of Return 3,209 0.015 0.020 0.000 0.000 0.139
Dollar Turnover 3,209 2.42 3.142 0.070 0.019 143.911
Market Cap ($M) 3,209 251.7 764.5 28.4 0.3 22,767.9
AMEX 3,209 0 0.195 0.007 0.000 1.000
[image:35.612.66.514.136.478.2]NASD 3,209 0 0.120 0.006 0.000 1.000
Table 6: Descriptive Statistics
Percentage Spread is the annual average of the daily percentage bid-ask spread. Price Impact is the annual average of the daily price impact as defined by Amihud (2002). Dollar Volume is the annual average of the daily dollar trading volume. Share Price is the annual average of the daily closing share price. Std. Dev. of Return is the annual standard deviation of the daily stock return.
ln (Price) ln (SD Return) ln ($ Turnover) ln (Market Cap) AMEX NASD
ln (Price) 1.000
ln (SD of Return) -0.681 1.000 0.0001
ln (Dollar Turnover) 0.462 -0.176 1.000 0.0001 0.0001
ln (Market Cap) 0.773 -0.544 0.603 1.000
0.0001 0.0001 0.0001
AMEX -0.292 0.081 -0.400 -0.468 1.000
0.0001 0.0001 0.0001 0.0001
NASD -0.315 0.458 -0.203 -0.387 -0.169 1.000
0.0001 0.0001 0.0001 0.0001 0.0001
Table 7:
Correlations between Explanatory Variables
ln (Price) is the natural logarithm of the annual average of the daily closing price. ln (SD of Return) is the natural logarithm of the annual standard deviation of the daily stock return. ln (Dollar Turnover) is the natural logarithm of the annual average of the dollar turnover, which is defined as the daily dollar trading volume divided by market capitalization. ln (Market Cap) is the natural logarithm of the annual average of the market capitalization. AMEX is an indicator variable for REITs trading on the American Stock Exchange.
NASD is an indicator variable for REITs trading on the NASDAQ Stock Exchange. In each column, the first number is the Pearson product moment correlation coefficient and the second is the p-value that the correlation coefficient is different from zero.
Variable
Intercept 2.636 13.04 a 3.217 14.95 a 1.280 8.69 a 1.936 6.73 a 1.772 9.59 a ln (Share Price t) -0.168 -5.23 a
ln (Share Price t-1) -0.018 -0.51 -0.150 -6.10 a -0.222 -5.50 a 0.003 0.13
ln (SD of Return) 0.446 10.38 a 0.687 16.17 a 0.708 24.71 a 0.643 10.89 a 0.825 22.05 a ln (Dollar Turnover) -0.525 -25.40 a -0.606 -27.49 a -0.153 -9.92 a -0.544 -17.87 a -0.410 -21.10 a ln (Market Cap t) -0.334 -20.84 a
ln (Market Cap t-1) -0.333 -19.06 a -0.125 -10.46 a -0.254 -11.31 a -0.290 -21.93 a AMEX -0.623 -12.82 a -0.634 -11.98 a -0.236 -7.04 a -0.339 -4.62 a 0.146 3.15 a NASD -0.277 -4.98 a -0.401 -6.37 a -0.141 -3.59 a -0.329 -3.62 a 0.158 2.74 a
Adjusted R-Square 0.655 0.644 0.738 0.658 0.895
F-Statistic 915.96 a 786.98 a 681.62 a 365.55 a 893.17 a Obs. 2,892 2,603 1,457 1,146 631
Table 8:
Determinants of the Percentage Bid-Ask Spread
(5) 2004-2007
(1) (2) (3) (4)
Percentage Bid-Ask Spread is the natural logarithm of the annual average of the daily percentage bid-ask spread. ln (Share Price t) is the natural logarithm of the median daily closing price in year t. ln (Share Price t-1) is the natural logarithm of the annual average of the daily closing price in year t – 1. ln (SD of Return) is the natural logarithm of the annual standard deviation of the daily stock return.
ln (Dollar Turnover) is the natural logarithm of the annual average of the dollar turnover, which is defined as the daily dollar trading volume divided by market capitalization. ln (Market Cap t) is the natural logarithm of annual average of the market capitalization in year t. ln (Market Cap t-1) is the natural logarithm of annual average of the market capitalization in year t – 1. AMEX is an indicator variable for REITs trading on the American Stock Exchange. NASD is an indicator variable for REITs trading on the NASDAQ Stock Exchange. Under each column, the first number is the coefficient and the second number is the standard error.
Variable
Intercept 1.434 11.16 a 3.217 14.95 a -4.359 -83.61 a 2.981 9.90 a 3.249 15.94 a ln (Share Price t-1) -0.118 -5.83 a -0.018 -0.51 -0.062 -1.35 0.134 3.30 a ln (SD of Return) 0.634 23.45 a 0.687 16.17 a 0.630 10.14 a 0.992 24.24 a ln (Dollar Turnover) -0.388 -29.10 a -0.606 -27.49 a -0.790 -24.81 a -0.356 -14.85 a ln (Market Cap t-1) -0.233 -22.53 a -0.333 -19.06 a -0.308 -13.20 a -0.312 -14.89 a AMEX -0.278 -9.01 a -0.634 -11.98 a
NASD -0.035 -0.95 -0.401 -6.37 a
D1993 0.387 7.75 a 0.894 9.07 a
D1994 0.439 8.68 a 0.834 8.43 a
D1995 0.821 17.52 a 0.865 9.57 a
D1996 0.971 21.47 a 0.724 8.45 a
D1997 0.942 20.76 a 0.576 6.58 a
D1998 0.932 20.62 a 0.572 6.35 a
D1999 1.197 27.39 a 0.798 9.19 a
D2000 1.037 23.83 a 0.765 8.89 a
D2001 0.544 12.22 a 0.152 1.75
D2002 0.283 6.34 a -0.234 -2.67 a
D2003 -0.174 -3.73 a -0.927 -10.38 a
D2004 -0.880 -19.18 a -1.646 -18.33 a
D2005 -0.778 -16.80 a -1.705 -18.9 a
D2006 -0.923 -20.06 a -1.922 -21.56 a
Adjusted R-Square 0.884 0.644 0.517 0.553 0.744
[image:39.792.82.717.104.559.2]F-Statistic 985.01 a 786.98 a 198.25 a 568.93 a 524.47 a Table 9:
Determinants of the Percentage Bid-Ask Spread
(4) (5)
(1) (2) (3)
Percentage Bid-Ask Spread is the natural logarithm of the annual average of the daily percentage bid-ask spread. ln (Share Price t-1)
is the natural logarithm of the annual average of the daily closing price in year t – 1. ln (Std. Dev of Return) is the natural logarithm of the annual standard deviation of the daily stock return. ln (Dollar Turnover) is the natural logarithm of the annual average of the dollar turnover, which is defined as the daily dollar trading volume divided by market capitalization. ln (Market Cap t-1) is the natural logarithm of annual average of the market capitalization in year t – 1. AMEX is an indicator variable for REITs trading on the
Variable
Intercept 1.073 4.56 a 2.757 7.19 a -4.492 -46.47 a 2.382 4.48 a 3.216 9.72 a ln (Share Price t-1) -0.177 -5.04 a -0.165 -2.85 a -0.245 -3.48 a 0.142 1.58
ln (Std.Dev. of Return) 0.644 13.32 a 0.882 11.59 a 0.867 8.20 a 0.983 13.08 a ln (Dollar Turnover) -0.387 -15.13 a -0.579 -13.76 a -0.682 -12.40 a -0.323 -5.82 a ln (Market Cap t-1) -0.193 -9.86 a -0.213 -6.52 a -0.168 -3.86 a -0.319 -6.91 a AMEX -0.269 -4.47 a -0.420 -4.14 a
NASD 0.102 1.32 -0.294 -2.28 b
D1993 0.398 4.70 a 0.722 4.05 a
D1994 0.499 5.99 a 0.689 3.96 a
D1995 0.881 10.46 a 0.990 5.69 a
D1996 0.918 10.91 a 0.903 5.19 a
D1997 0.956 11.46 a 0.775 4.45 a
D1998 1.031 12.55 a 0.889 5.11 a
D1999 1.237 15.01 a 1.065 6.12 a
D2000 1.017 12.27 a 0.978 5.62 a
D2001 0.508 6.07 a 0.383 2.20 b
D2002 0.267 3.21 a -0.006 -0.03
D2003 -0.207 -2.44 b -0.738 -4.24 a
D2004 -0.794 -9.54 a -1.359 -7.81 a
D2005 -0.695 -8.31 a -1.431 -8.22 a
D2006 -0.839 -10.00 a -1.703 -9.79 a
Adjusted R-Square 0.8819 0.658 0.4583 0.534 0.785
[image:41.792.75.718.108.553.2]F-Statistic 278.42 a 239.26 a 45.91 a 157.13 a 169.75 a
Table 10:
Determinants of the Percentage Bid-Ask Spread
(4) (5)
(1) (2) (3)
Percentage Bid-Ask Spread is the natural logarithm of the annual average of the daily percentage bid-ask spread. ln (Share Price t-1)
Parameter Parameter
Variable Estimate t Value Estimate t Value
Intercept 2.210 0.5 4.17 16.3 a
ln (Price) -0.274 -5.5 a -0.41 -3.3 a ln (Std.Dev Returns) 0.551 7.2 a 0.38 6.7 a ln (Dollar Volume) 0.097 0.3 -0.01 -0.1
ln (Turnover) -0.189 -0.5 -0.17 -1.3
ln (Market Cap) -0.248 -0.7 -0.08 -0.7
AMEX -0.123 -2.3 b -0.34 -5.8 a
NASD 0.477 6.6 a 0.28 4.0 a
Adj. Rsquare 0.93 0.89
Number of Obs. 169 337
[image:43.612.74.482.132.382.2]CC 2008 BCK 1997
Table 11:
Determinants of the Percentage Bid-Ask Spread 1994 Comparison with Bhasin, Cole and Kiely 1997
Percentage Bid-Ask Spread is the natural logarithm of the annual average of the daily percentage bid-ask spread. ln (Share Price) is the natural logarithm of the annual average of the daily
closing price. ln (Std. Dev of Return) is the natural logarithm of the annual standard deviation of the daily stock return. ln (Dollar Turnover) is the natural logarithm of the annual average of the dollar turnover, which is defined as the daily dollar trading volume divided by market
capitalization. ln (Market Cap t-1) is the natural logarithm of annual average of the market capitalization in year t – 1. AMEX is an indicator variable for REITs trading on the American Stock Exchange. NASD is an indicator variable for REITs trading on the NASDAQ Stock
Year Coef. t-statistic
2001 -0.242 -2.41 b
2002 0.056 0.49
2003 0.168 1.91 c
2004 0.023 0.30
2005 0.079 1.18
2006 -0.016 -0.24
2007 -0.195 -1.97 b
Table 12:
Determinants of the Percentage Bid-Ask Spread Real Estate Coefficients