Lancaster University Management School
Working Paper
2006/019
Education and economic growth
Geraint Johnes
The Department of Economics Lancaster University Management School
Lancaster LA1 4YX UK
© Geraint Johnes
All rights reserved. Short sections of text, not to exceed two paragraphs, may be quoted without explicit permission,
provided that full acknowledgement is given.
The LUMS Working Papers series can be accessed at http://www.lums.lancs.ac.uk/publications/
EDUCATION AND ECONOMIC GROWTH
Geraint Johnes
Professor of Economics
Lancaster University Management School Lancaster LA1 4YX
United Kingdom
T: +44 1524 594215 F: +44 1524 594244 E: G.Johnes@lancs.ac.uk
ABSTRACT
Contemporary views on the determinants of economic growth place education in centre stage. Yet the way in which education affects growth is not yet well understood. This paper begins by surveying the recent literature on the factors that affect growth, paying particular attention to education. It then proceeds to estimate a comprehensive model of growth, testing its robustness across regions of the world. Policy conclusions are drawn.
JEL Classification: F43, I20, O40, O57, P16
Keywords: growth, education, political economy
Introduction
It is a great honour to have been invited to give the twelfth Eric John Hanson Memorial Lecture. Amongst his many achievements, Hanson remains well known for the contributions he made to the study of public finance in the health and education sectors. For me, as an education economist, the books he published in the 1970s on the financing of education in Alberta, and in western Canada more generally, have provided a particularly interesting and instructive read. They are scholarly, written with a painstaking attention to detail and with a clear understanding of the interplay between economic forces and the force of history. Yet Hanson’s interests were quite eclectic, and he is perhaps best known in these parts for his financial history of Alberta, a volume that provides a wealth of insight into the operation of the macroeconomy in an important and distinctive region of a federal country. Professor Hanson’s work in these areas is kept alive at Alberta by a younger generation of economists; it is testament both to his influence and to a sense of continuity that so many of the current department – including Professors Boothe, Dahlby, Landon, McMillan, and Smith – share some of the interests of their illustrious predecessor, and continue to produce work of international excellence.
In this lecture, I want to home in on two of Professor Hanson’s interests – the economics of education and the performance of the macroeconomy. In doing so, my lecture will address issues that have previously been addressed separately in previous Hanson lectures given by Josef Ritzen and Judith Maxwell, but I will bring these themes together. To be more specific, I intend to examine the contribution that education, alongside other factors, makes to long term economic growth.
I make no claim that this is a new topic. In a quote that now seems both jingoistic and sexist, but which is nonetheless appropriate for a lecture by a British man visiting Canada, Adam Smith (1776), the father of economics, wrote the following:
‘In what way, therefore, has the policy of Europe contributed either to the first establishment, or to the present grandeur of the colonies of America? In one way, and in one way only, it has contributed a good deal. Magna virum mater (mighty mother of men)! It bred and formed the men who were capable of achieving such great actions, and of laying the foundation of so great an empire; and there is no other quarter of the world; of which the policy is capable of forming, or has ever actually, and in fact, formed such men. The colonies owe to the policy of Europe the education and great views of their active and enterprizing founders.’ (Wealth of Nations, ch. 7)
Smith elsewhere noted the contribution that education makes to individuals’ productivity:
with at least the ordinary profits of an equally valuable capital. It must do this too in a reasonable time, regard being had to the very uncertain duration of human life, in the same manner as to the more certain duration of the machine.’ (Wealth of Nations ch. 10)
It is hard to think of a clearer exposition of the concept that economists now refer to as ‘human capital’ – the stock of skills that people are endowed with or acquire through investment in training and education and which renders them more productive in their work.
Unfortunately, Adam Smith’s early insights on human capital were largely overlooked. He is remembered more often as the developer of the theory of the ‘invisible hand’ which guides a free market economy toward a socially optimal solution – in effect he contributed more than anyone to the fall of the Berlin Wall 200 years after his death, and that is no mean feat.
But the notion of human capital really only started to interest economists more recently – once the age of the jet airliner had arrived and people started to make comparisons about living standards in different parts of the world. In 1960, a development economist called Theodore Schultz gave an address to the American Economic Association (Schultz, 1961). He had been researching the determinants of farmers’ incomes in developing countries. He found that education was an important factor. In his lecture, he coined the term ‘human capital’. In 1979, Schultz was awarded the Nobel prize. As things turned out, that award was to herald a renewal of interest in his contribution.
Around the start of the 1980s, economists’ understanding of the macroeconomy was in a state of flux. The post-war Keynesian consensus had led many economists to focus on the short and medium term. The management of the business cycle using a full range of fiscal and monetary policies was the order of the day. The election of new governments – first in the UK led by Thatcher, and second in the US led by Reagan – with explicitly monetarist credentials shifted the focus of attention somewhat. Economists became more interested in the way in which policy tools can affect long run outcomes, such as economic growth. And one thing that quickly became clear was that our traditional models of economic growth were broken. They simply failed to predict the most basic of stylized facts about international differences in growth patterns or income levels.
Economists responded to this failure of the consensus model in a variety of ways. But each solution to the conundrum has, in some way, drawn on the work of Schultz – each has given education a core role to play in the determination of growth.
do it? If we want better to address some of the most acute problems of the world – famine in Niger, natural disasters in Indonesia or New Orleans – how do we do it?
This has been a long introduction. But I needed to set the scene in some detail. At last I have come to a stage where I feel I can tell you where I am going, and I can say something about what the shape of the rest of the lecture will be. I will first comment in some more detail on the state of play as regards economists’ understanding of the forces that determine economic growth. I will then focus on the role that education has to play in that growth, but I will recognise that there are gaps in our understanding, and so I shall point to some areas where more work is needed to plug these gaps. Likewise, I will recognise that education is far from being the only important determinant of growth, and I shall say something about the other factors that matter. Finally I shall comment on some policy issues and suggest some ways forward.
New Models of Economic Growth
Let me begin then by saying something about the models that economists nowadays use to explain growth. Here I need to tread carefully, for I could well end up sounding like the British Treasury Minister, Gordon Brown, who famously befuddled journalists and the public alike when he pronounced that economic policy should be grounded in ‘post-neoclassical endogenous growth theory’. Despite the jargon, the basics are really quite simple: there are two competing views about how economic growth is generated.
The first view is that it is easier to catch up than it is to lead. This idea resonates with many economists because it draws on a lot of concepts that have been drilled into us since we first learned the subject. The so-called law of diminishing returns suggests that you get more utility out of something when you only consume a little than when you consume a lot; for a firm, extra output is cheaper to produce when you have plenty of spare capacity than when you don’t. This concept of diminishing returns is a very powerful one: it explains, for example, why McDonalds don’t produce furniture, and why Canada and the United States are separate countries. It lies at the heart of what we know of as ‘neoclassical’ economics – the economics that has its origins in the work of Jevons and Marshall. In the context of growth, the neoclassical model implies that the growth rate of the gross domestic product in each country will converge on a rate that is determined by the growth of technical progress.1 Since technical progress develops at different rates in different countries, we would expect the economies of different countries to grow at different speeds. But since poorer countries are typically copying technologies developed elsewhere, while richer countries must themselves push the frontiers of technology, it would not be surprising if we found that poorer countries grow faster than richer ones. Think of China.
Simple variants of this neoclassical model can be constructed where production is determined simply by the employment of labour and capital. These simple representations have, as I noted earlier, generally performed badly in that, when applied in an international context, they make predictions that are severely at odds
1
with the facts. In particular, they failed to account for the large gap that exists between rich and poor countries in the average per capita incomes of people. For example, while the average person in Canada is about 25 times better off than the average person in China, the neoclassical model predicts that the gap will be only about 2½ times. By any standard that is a spectacular failure.
However, Mankiw et al. (1992) have shown that this failure may not be due to the model per se, but rather to the way in which it has been implemented empirically. The models that fail assume that there are just two factors of production – the amount of capital that is employed and the amount of labour. There is nothing in these models about the quality of labour. Once this is taken into consideration, by including education as a key variable in the production function, the failings of the model go away. The augmented neoclassical growth model – augmented, that is, by the inclusion of education as a key factor of production – is the first of the major new growth theories to have been developed over the last 20 years.
Now since technical progress in this view is beamed in on the model from outside, this type of model is often called an exogenous growth model. This is really quite a misleading title, since it is technical progress, rather than growth, that is actually exogenous to the model. But the nomenclature does serve to highlight a serious limitation of the neoclassical growth model – namely that it doesn’t really explain anything at all about growth. It merely passes the buck, and says that economies will grow at a rate determined by technical progress. The obvious question to ask then is: what determines the rate of technical progress?
And that is where the second major new theory of growth comes in. This view is that growth and the state of technology are mutually dependent. Countries that grow quickly invest in research and development, and as a consequence their growth is magnified. According to this view, some countries can get into a virtuous spiral of growth and development, while others can get stuck into a viscious circle of
stagnation. Think of sub-Saharan Africa. Some people have termed this the
‘cumulative causation’ model of growth, a terminology introduced long ago by Kaldor (1966). Others, noting the fact that technology is now determined within the model itself, have dubbed it the endogenous growth theory.2 The role played by research and development in this theory is critical – and investment in research and development necessarily implies an investment in education and human capital.
Proponents of the two main contemporary views on economic growth therefore agree that education is a critical determinant of growth, but they do not agree on why. Advocates of the neoclassical model suggest that labour of higher quality is likely to be a more productive factor of production. Endogenous growth theorists meanwhile argue that it is the creation of new knowledge that is important.
So much for the theory. What about the facts? We can test the new theories of growth against the old theories quite simply by evaluating whether or not education and human capital add anything to our ability to explain the international experience of economic growth. Several studies, of which the most influential has been that of
2
Levine and Renelt (1992) have confirmed that, along with the rate of investment in new capital, education does indeed matter – and matters a great deal.3
To demonstrate this, consider the graph shown in Figure 1.4 The horizontal axis indicates the value of wealth per person in an economy that is attributable to human capital – this is a measure of schooling, spread appropriately over the whole age range of those in work. The vertical axis represents economic growth over the period 1980-2000. Each data point in the scatter diagram represents one of 85 countries for which I was able to obtain complete information. The diagram shows fairly unambiguously that there is a positive relationship between human capital and growth. (The one clear outlier, with growth of almost 400%, is China. Ignoring this, the scatterplot suggests that an increase of $100000 in wealth due to human capital is associated with an increase of about 25% in the 20-year growth rate – in annual terms that amounts to a little over 1.1 percentage points.) The data in this graph, however, suggest that there may be (at least) two groups of countries in the sample – for one group, the relationship between growth and human capital is quite flat, while for the other group it is relatively steep. Countries in the former group include most of Western Europe, North America and Oceania. Countries in the latter group include primarily the south east Asian tigers, but also some outliers such as Mauritius and Botswana. Explaining the outliers is something that I shall try to do later in the talk.
But what is clear from the graph is that education matters. So the new theories beat out the old. Remember, though, that there are two new growth theories. Attempts to sort out the debate between proponents of these two theories have, unsurprisingly, been frustrated by the fact that education is central to both views of the world. It is essential when we want to test one theory against another to have some sort of distinguishing feature. There is a distinguishing feature here, but it isn’t education. It is to do with convergence. Recall that the neoclassical model predicts that lagging economies will find it relatively easy to play catch-up, while the endogenous growth model suggests that such economies are in a viscious circle of stagnation. So the debate has focused on the question of whether or not economies are converging.
It would be nice to suppose that some clear-cut evidence on this would be obtainable from Figure 2. This shows the relationship between the level of the gross domestic product in the initial period, and subsequent growth. If convergence is happening – if, that is, the neoclassical story is right – then we would expect to see a pattern emerging where growth is negatively related to initial gross domestic product. This would indicate that initially poorer countries grow quickest because they are catching up. If, on the other hand, the processes of endogenous growth dominate, then the richer countries will continue to benefit from high growth, while the poorer countries continue to stagnate. A quick look at Figure 2 shows that no clear and simple conclusions are possible. Certainly if China is treated as an exception, there does not seem to be much of a pattern in the data at all.
3
The relationship between growth and investment in physical capital is shown in Appendix 1.
4
A more detailed analysis provides more detailed information, however. There are at least two clearly identifiable clusters in the diagram. First, there are those countries whose gross domestic products grew by about 50 per cent or more in the last 20 years of the last century. Some of these have exceptionally high growth, having started out with low levels of income. These countries include China, Malaysia, India, Korea, and the small economies of Mauritius and Botswana. The Republic of Ireland is also in there, having developed very rapidly and been dubbed a ‘celtic tiger’ since its admission to the European Union. Other countries have somewhat lower growth rates, having started out with relatively high levels of income. These include the United States, Japan, and several northern European countries. If we view all of these countries as a single group, it would appear that there is some convergence going on.
On the other hand, we could examine a second group comprising countries where growth has been 25 per cent or less over the 20 year period. At the bottom end of the scale, these include much of sub-Saharan Africa and much of Latin America. There is some evidence of convergence within each of the geographical regions in this group – for example, El Salvador played catch-up with Venezuela and Ghana played catch-up with Zambia. But it is clearly not the case that these countries taken as a whole are converging on the economies of the far east and the north Atlantic. Relative to these more prosperous economies, the low growth economies appear to be in a state of chronic stagnation.5
The conclusion one can draw from this is that there are clusters of countries.6 Within clusters, neoclassical growth mechanisms ensure that catch-up takes place, sometimes quickly, sometimes slowly. But between clusters, the process seems to be one of cumulative causation, with groups of poor countries continuing to stagnate in relation to groups of rich countries. This is quite a complex picture, but it is one that makes room for both the neoclassical catch-up model and the endogenous growth model of virtuous and viscious circles or spirals.
Refining our Understanding of Education and Growth
Within each model, it is clear that education affects growth (though we don’t yet fully understand how or why). Equally, it is clear that quite a lot of the variation in countries’ experience of growth remains unexplained by education – the scatter diagrams are indicative of a pattern, but they really aren’t that good. Indeed, unless we appeal to further variables capable of contributing to our understanding of growth, we can still only explain about 35 per cent of the variation in growth rates across countries. So in the remainder of my lecture, I will first investigate whether we can learn more about why education matters, and then I shall investigate some other variables that could also affect growth.
In considering education so far, all my attention has been on the quantity of education provided. This is unsatisfactory for at least two reasons. First, it pays no heed to differences in the quality of education. And secondly, it pays no heed to differences in the distribution of education experience across individuals within a country.
5
Sachs and Warner (1995) argue that the two groups identified here can be distinguished by the degree to which their economies are open to international trade. This is an issue to which we return later.
6
Ric Hanushek and Dennis Kimko (2000) have used the results of international tests of student learning7 to evaluate the impact of workforce quality on national output and growth. These international tests are familiar to any avid newspaper reader; they generate headlines – just look back at the Toronto Star for December 7, 2004: “International Math Test Scores Canada Third”.8 The tests cover only a relatively small set of countries, but by using some rather clever statistical imputation methods, Hanushek and Kimko have been able to expand the dataset to include some 90 countries. Lurking behind the estimates of schooling quality are a host of resource variables, such as the pupil-teacher ratio, recurrent expenditure, enrolment rates, and regional information.
To see the impact that schooling quality has on growth, take a look at Figure 3.9 This maps schooling quality, measured by average test scores on six underlying subject tests, onto the 1980-2000 growth rate. The scatterplot here shows a clear positive relationship – and a much closer fit than we saw in the earlier scatterplot. Very noticeable is the fact that China now does not appear to be anywhere near such a prominent outlier as it was before.
The effect of all this is that the inclusion of schooling quality in our set of variables that might affect economic growth leads to a very dramatic increase in explanatory power. Whereas before we could explain only 35 per cent of the variation in growth rates across countries, now we can explain over 40 per cent. Clearly the quality of education is very important indeed as a determinant of economic growth and prosperity.
And the quality differentials between countries are really wide. In Britain, the educational quality measure is 63 points; in Canada it is 55; in France, Australia, Japan and New Zealand, the scores are, respectively 56, 59, 66 and 67. Contrast that with some poorer countries. In Botswana, the score for educational quality is just 32; in Kenya, it is 30. In Bolivia, Ghana, Mozambique, the Central African Republic, and in Bolivia and El Salvador, the scores are lower still. In the face of these quality differentials, it is difficult to see how some of the developing countries can ever catch up, however strong the neoclassical mechanisms might be.
There is a clear policy implication here. The World Bank and other international institutions have made a commitment to seek universal primary education – that is a global 100 per cent completion rate – by the year 2015. Such an investment in the quantity of education is welcome, though we are still far from achieving it – the
7
These are administered by the International Association for the Evaluation of Educational Achievement (IAE) and the International Assessment of Educational Progress (IAEP). Other international measures of student learning, not used by Hanushek and Kimko, are the Trends in International Mathematics and Science Studies (TIMSS) and the OECD’s Programme for International Student Assessment (PISA). The TIMSS data are collected at the University of British Columbia, and, in addition to international comparisons, allow interprovincial comparisons; within Canada, it is pleasing to note that Alberta vies with Quebec for the top spot.
8
On the same day, the same story was covered on the front page of the Edmonton Journal with the headline “Alberta students rank among world’s best” and – on the other side of the Atlantic – the headline in the Times on the following day was “English Teenagers Slide Down World Education League”.
9
primary school completion rate across the whole of Africa was just 55 per cent in 2001. However, put aside for a moment the desirability of universal education. An investment in the quality of that education would also be highly desirable, and would significantly aid economic growth. Otherwise the investment in quantity may well be wasted. It seems to me that an obvious mechanism that could be of huge mutual benefit to rich and poor countries alike would involve the developed countries in sending able young teachers for periods of work experience in developing countries; they could be tasked with teaching children in these countries themselves, but also with passing on the benefits of their own training to other local teachers. Such a scheme could be financed in part by national governments which see benefits in the experience which teachers gain abroad, but also by international agencies keen to ensure that the extra quantity of education they provide is matched by quality.
High quality of education is, of course, particularly important in the endogenous growth view of the world. If growth is stimulated by research and development, then it is likely that it is those individuals at the top end of the educational ladder who will be the generators of economic advancement. This reinforces the view that quality is important, but it also suggests that the distribution of education might be just as significant a determinant of growth as is the average level of educational attainment. And, again if this is correct, it may be the case that growth in developing economies can more cost-effectively be secured, not by guaranteeing primary education for all, but by guaranteeing higher education for some. This is not a very politically correct suggestion, but it is one that should be investigated – doubly so because there are reasons why the relationship might work the other way. Governments have apoor track record at picking winners. If I may mix my metaphors, the best way to make sure the cream rises to the top may be to let a thousand flowers grow.
So what is, then, the relationship between educational inequalities and growth? Until the last few years, this was not a question that could be answered. The distribution of education is not a straightforward thing to measure. It requires information not only about the proportions of the current cohort of young people who leave education after completing various levels, but also similar information for every generation still alive. For many countries, this extent of detail in data which are quasi historic in nature has become available only very recently.10 Nevertheless, several datasets have now been constructed that allow the analysis of educational inequalities within each of a large number of countries.
An admirably comprehensive study of these data has been conducted by Amparo Castelló and Rafael Doménech (2002).11 They find unambiguous evidence that education inequalities dampen growth, and that this effect is over and above the effect due to the level of investment in schooling per se.
Figure 4 shows the mapping between educational inequalities and growth.12 It is very clear from this diagram that countries where educational provision is relatively unequal across individuals tend to perform relatively poorly in terms of economic growth.
10
The first attempt was by Thomas et al. (2000).
11
Earlier studies include Birdsall and Londoño (1997).
12
This finding, based as it is on a macroeconomic analysis, should not be surprising to those who study the economics of education from a microeconomic perspective. The social rate of return on investments in primary education in developing countries substantially exceeds those obtainable on investments in more advanced levels of education. In sub-Saharan Africa, taken as a whole, for example, the social rate of return on primary education is 25 per cent, while the corresponding figure for higher education is just 11 per cent (Psacharopoulos and Patrinos, 2004). So we should not be surprised to find that the best place to put the marginal dollar of spending is in widening access to primary education. There is, therefore, no case for educational resources in poor countries to be focused on an élite. This is, after all, the underpinning of the initiative to provide universal primary education by the year 2015.
All of this tells us that the quality and distribution of education offer us some extra insight into the relationship between education and growth. With the variables that I have considered already we can now explain about 42 per cent of the variation in international growth rates by appeal to education variables, investment, and initial income alone. That means there is still a lot of explaining to do. I shall therefore, in the time that remains, consider some further candidates that could conceivably influence growth.
Further Determinants of Growth
The first new candidate determinant of growth is something that I shall refer to as the
openness of the economy – does the economy open itself up to free trade, or does it impose restrictive trade barriers in the forms of tariffs and quotas. This is, of course, quite a controversial issue. The movement toward free trade and increased globalisation has drawn critics from many areas. Some environmentalists view free trade as a threat because it increases pollution due to transportation of goods across the globe – though I would argue that this is a separate issue. Some left wing activists resist free trade for ideological reasons, or because they perceive threats to the working conditions of the domestic labour force – though constant flexibility probably poses less of a threat than retrenchment followed by periodic seismic readjustments. Some aid organisations oppose free trade because they consider it harmful to the interests of developing countries – though usually what they are thinking of is the perpetuation of barriers to free trade that Western governments have, in a masterpiece of doublethink, argued are there to protect free trade. (I’m thinking here of things like the European Union’s iniquitous Common Agricultural Policy.) And doubtless there are militant groups in parts of the world that are not free who oppose globalisation because they see it as economic imperialism – the McDonaldsisation of the universe. And who can blame them – except for the fact that people in those parts of the world surely choose to buy hamburgers (otherwise the stores would not be there), and so are presumably made better off by their availability.
have a comparative advantage. By freeing up trade, we give each country the flexibility to concentrate on the things that, in relative terms, it does best. And that being the case, world output should be higher under free trade than under any alternative regime. The recent ‘bra wars’ between the European Union and China – still not satisfactorily resolved – illustrate just how hot a political potato this issue can be.
A large body of research has investigated the impact of openness on growth. The vast bulk of the studies conclude that openness does indeed stimulate economic development.13 To see how this works out in practice, consider Figure 5. As usual, this shows growth on the vertical axis. The indicator of openness on the horizontal axis is a binary measure developed by Sachs and Warner (1995); this equals 1 if the country has an open trade regime (as defined by the existence or otherwise of high tariffs, non-tariff barriers, a high black market premium on international currency, government monopoly in major exports, and rule by a socialist government) – otherwise it equals zero. To be sure this is a crude measure of openness, but the message that the graph provides is clear enough for us to be pretty confident that openness, however measured, has an impact.
This is important, of course, in terms of the economic history of the world, and in particular in terms of the experience of many countries in the latter part of the 20th century after they gained freedom from colonial rule. During that period, a powerful counterargument to free trade held sway; this took the form of the infant industry case for protectionism. Impressed by the rapid industrialisation achieved by countries in the Soviet bloc, many countries – especially in Africa – eschewed the opportunity to integrate fully with the global economy. But small countries do not benefit from the diversity of resources available to a large country, and countries with strong tribal cultures differ from countries with a strong and unified authoritarian tradition. One person’s meat is another person’s poison, and the African experiements with protectionism failed, at great cost to the general population.
Some time ago, I mentioned a couple of outliers – Mauritius and Botswana – which in some respects have behaved more like south east Asian economies than like countries in the Indian Ocean or Africa. Both of these countries are distinct from other economies in their region because of a high degree of openness (which in turn may owe much to their small size – both have populations of well under 2 million). In this respect, they are similar rather to the economies that we think of as the Asian tigers. And they have reaped rewards for their willingness to engage with the global economy: over the last two decades of the last century, the gross domestic product of Botswana grew by 135 per cent while that of Mauritius grew by some 145 per cent. For each of these two countries, that is the difference between a gross domestic product of about $1500 per person per year (measured in 1995 US$) and $4000 per person per year.
The second new candidate determinant of growth is closely related to the first. It is the economic performance of trading partners. This sounds like an obvious explanation, but it is one that is quite difficult to test empirically. Suppose that three
13
countries form an exclusive trading partnership – America, Britain and Canada. I shall conveniently label these three countries A, B and C. Now suppose that a spurt of growth occurs in A. This might be because the development of a new technology increases productivity in that country, thereby making the country richer. A’s citizens will have more income and so their consumption will increase – including their consumption of imported chemicals from B and wood from C. The extra exports from B and C generate growth in those countries too. As a result, these countries start to import more electronics from A (and also more things from each other). This spillover effect further boosts growth in all three countries - and subsequently a kind of global multiplier effect ensues where growth in one country stimulates growth in the others. The conceptual mechanism is not therefore difficult to grasp, but the problem with testing this statistically is that with so much going on, it is difficult to distinguish between the extent to which one country’s growth is affected by the growth of its trading partners, and the extent to which it is the first country’s growth that is stimulating growth elsewhere. There is an extremely complicated chicken-and-egg problem here.14
If I may digress for a moment, I should note that the chicken-and-egg problem affects also the determinants of growth that I have mentioned earlier. Certainly it seems as though education influences growth; it seems as though investment influences growth; and it seems as though growth in one country depends on growth in its trading partners. But equally it might be the case that higher growth economies tend to invest more in both physical and human capital, that they tend to be more stable, and that their own high growth stimulates the economies of the countries that they trade with. In a real sense, of course, this two-way causality is what lies at the heart of the endogenous growth theory: a virtuous spiral of growth, investment, growth, investment and growth again. But correlation is no proof of causation, and it would be misleading to infer that the graphs I have shown are sufficient, on their own, to demonstrate that education policies can deliver economic prosperity. To establish what causes what requires the use of statistical and econometric techniques that are more powerful than simple graphs. Likewise it should be borne in mind that graphs can only allow us a two dimensional view of any issue; we have seen that various aspects of the education system, investment, and the economic environment each individually appears to affect growth, but this is not the same as knowing that all of these together combine to determine the growth rate. But, as it happens, the results that I have reported are all robust; they survive the most rigorous interrogations that can be imposed on them by econometric testing. In other words we can have a high degree of confidence that these really are the things that determine economic growth.
But let me get back now to the specific chicken and the specific egg – growth in one country and growth in that country’s trading partners. Arora and Vamvakidis (2005) have recently studied this issue and have taken pains to correct statistically for the chicken and egg issue. Their estimates suggest that the spillover effects of growth from one trading partner to another are substantial – indeed that an increase of 1 per cent in the growth rate of a country’s trading partners can lead to a rise of 0.8 per cent in the country’s own growth rate after the spillover effects have been taken into account. That is a huge impact. They also show that geographically proximate countries tend, not surprisingly, to trade with each other. This explains in large
14
measure why the experience of growth across the globe varies much more between the most broadly defined regions of the world (continents, say) than it does between countries within those regions.
Figure 6 plots growth against a measure of the growth experience of countries’ trading partners.15 The positive relationship here is clear and unambiguous.
This result suggests that a policy consideration for developing countries should be to encourage production of goods and services that can readily be marketed to high growth countries, and to encourage also their effective marketing in those countries.
The third new candidate determinant of growth is political stability. Several researchers have investigated the role of the political environment from a number of slightly different perspectives – stability, democracy, absence of corruption.16 But, of these, it is political stability that seems to be the most promising in explaining growth.
The relationship between political stability and economic growth is illustrated in Figure 7.17 Of course, there may be something of a chicken and egg situation embedded in this relationship, as in the others that I have discussed. Political regimes are likely to come under most pressure when they are unsuccessful, and regimes that are in some other respects unpleasant find their subjects to be forgiving so long as sufficient economic growth is being delivered. As James Carville so memorably said: it’s ‘the economy, stupid’. Nonetheless there is good reason to suppose that political stability is a prerequisite for successful economic development; investors in both physical and human capital are more likely to have confidence in an environment which is stable than in one which is not.
Research by Yi Feng (1997) is particularly careful to correct statistically for the chicken and egg problems. He concludes that ‘democracy tends to have a positive effect on economic growth by inhibiting extra-constituitional political change and favouring constitutional political change. Democracy provides a stable political environment which reduces unconstitutional government change at the macro level; yet along with regime stability, democracy offers flexibility and the opportunity for substantial political change within the political system.’ Of course, there are non-democratic countries, of which China is the prime example, that have recently demonstrated similar flexibility, though this is perhaps less usual. Perhaps the free market in that vast country imposes disciplines on government that come close to mimicking those of a free electorate. Whatever, Feng goes on to conclude that ‘the juxtaposition of macropolitical certainty and micropolitical adjustability may be regarded as the ultimate basis for sustainable economic growth and expansion’.
Following that ringing endoresement for our own political system, I am tempted to say only a little about some other determinants of growth that have been identified in the literature. The quality and extent of health care maintains human capital in much the same way as education augments it; we would therefore expect countries that
15
The measure is derived from Table 2 in Arora and Vamvakidis (2005).
16
See, for example, Feng (1997), Quinn and Woolley (2001), and Pellegrini and Gerlagh (2004).
17
invest heavily in health care to have relatively low morbidity rates, so that people can work more, and so that the economy can prosper.18
Rates of entrepreneurship vary considerably across countries owing to cultural and economic factors. Countries where the incidence of entrepreneurship is high might be expected to have high rates of investment and so also of growth.19
The next factor is good news for Canada and Britain, but bad news for Alberta – it has been argued that landlock influences growth.20 Doubtless this explains the funny shapes of some countries on the map – Iraq is one example, but a more extreme case is Russia, which has a small annexe sandwiched between Lithuania, Poland, and the Baltic Sea. This might explain also the extent to which many countries have developed mainly along their seaboard: again, think of China, and think of how nine of the world’s ten largest cities are located on the coast. (The exception is Mexico City.) This is all, of course, to do with trade. It is not all doom and gloom for Alberta, however. Switzerland is landlocked and rich, and it specialises in watches and finance which are both easily transportable. Likewise, pipelines make easy the transportation of Alberta’s rich reserves of oil and gas.
Next, let us consider the tendency for some governments to distort markets by way of price controls. This leads to a ‘black market premium’ for some goods and services. Several studies have found that a higher level of government price distortion leads to lower growth.21 Where prices are distorted, incentives are blunted, and this likely diverts investment away from the areas that would be most efficient.
The final factor that I shall discuss is institutions. Daron Acemoglu et al. (2001) have argued persuasively that the institutions that many African countries inherited from colonial times have survived into the present and have equipped them poorly to make the transition out of poverty.
I have made much of the roles played by investment, education, openness, trading patterns and political stability in the determination of growth. Taking a global view, using, as I have done, data from countries all over the world to evaluate the strength of the claims made for these variables, it is clear that these things really are important. But are they equally important in all places? Or are some of these things more, or less, important, in developing countries than elsewhere?
To address this issue, I have estimated a statistical model in which growth depends on initial income, the investment to GDP ratio, school enrolment rates, schooling quality, schooling distribution, openness, growth amongst trading partners, and a measure of political stability.22 The equation allows me to explain almost 50 per cent of the inter-country variation in growth rates. That is far from perfect, but it is also far better than the simple models with which we started out. I have tested to see whether the equation is any different for Africa and Latin America compared with the rest of the world. My results suggest that there are some very considerable differences of this kind; so much
18
See Fogel (2004).
19
See van Stel et al. (2005)
20
See Sachs (2003)
21
See, for example, Castelló and Doménech (2002).
22
so, in fact, that if I allow for these differences I can explain well over 80 per cent of the inter-country variation in growth rates. In the countries of Africa and Latin America, the amount of wealth due to human capital, the extent of openness to trade, and the catch-up effect are all much stronger determinants of growth than elsewhere. Meanwhile in these regions, the rate of investment in physical capital is less important than in other parts of the world. These findings themselves have important policy implications. Amongst other things, for example, they imply that foreign direct investment is likely to be a more effective stimulator of growth in, say, China, than in sub-Saharan Africa – in the latter region, the pressing needs are for education and open trade policies. Here it may be the case that investment in education and openness are, in the most literal sense, prerequisites that must be met, but which as yet have not been met, before investments in physical capital can become effective propellants of growth.
Conclusion
Back to Eric Hanson. In ‘Financing Education in Alberta’ he wrote: ‘ Education increases the effectiveness of labour in production by its impact on the individual. It also affects the productivity of co-workers who are influenced by the guidance, skills and viewpoints transmitted by the educated person… Education generally facilitates the spread of innovations and it induces research and technological progress. Expenditures on post-secondary education need to be sufficiently high that they ensure the preservation and enrichment of the welfare of the society, the promotion of democracy in government, and the achievement of productivity and efficiency in the economy.’
Where will our understanding of growth go next? There are some clear policy implications that fall out of the analysis that I have surveyed. These include: how to achieve universal primary education, a goal that looks like proving elusive despite the huge investments being made – I would suggest that effective, incentive-based, policies to reduce the incidence of child labour might be a good place to start; how to improve the quality of education especially in countries which lag behind the pace in economic terms – international transfer of expertise would help; and some of the poorest countries need to support both production and marketing in industries where the potential exists to trade with the fastest growing nations. The implementation and evaluation of policies such as these will be an obvious next step. Understanding how groups of countries are formed into convergence clusters, and how policy can change the composition of these clusters, will also be key to the enhancement of our understanding of the processes underpinning economic development.
References:
Acemoglu, Daron, Johnson, Simon and Robinson, James A. (2001) The colonial origins of comparative development: an empirical investigation, American Economic Review, 91(5), 1369-1401.
Arora, Vivek and Vamvakidis, Athanasios (2005) How much do trading patterns matter for economic growth?, IMF Staff Papers, 52, 24-40.
Baldwin, Robert E. (2003) Openness and growth: what’s the empirical relationship, National Bureau of Economic Research Working Paper 9578.
Baumol, William (1986) Productivity growth, convergence and welfare, American Economic Review, 76(5), 1072-1085.
Birdsall, Nancy and Londoño, Juan Luis (1997) Asset inequality matters: an assessment of the World Bank’s approach to poverty reduction, American Economic Review, 87(2), 32-37.
Castelló, Amparo and Doménech, Rafael (2002) Human capital inequality and economic growth: some new evidence, Economic Journal, 112(3), C187-C200.
Edwards, Sebastian (1998) Openness, productivity and growth: what do we really know, Economic Journal, 108(1), 383-398.
Edwards, Sebastian (1993) Openness, trade liberalization and growth in developing countries, Journal of Economic Literature, 31(3), 1358-1393.
Feng, Yi (1997) Democracy, political stability and economic growth, British Journal of Political Science, 27(3), 391-418.
Fogel, Robert W. (2004) Health, nutrition and economic growth, Economic Development and Cultural Change, 52(3), 643-658.
Hanushek, Eric A. and Kimko, Dennis D. (2000) Schooling, labor force quality, and the growth of nations, American Economic Review, 90(5), 1184-1208.
Kaldor, Nicholas (1966) Causes of the slow rate of economic growth in the UK, Cambridge: Cambridge University Press.
Kunte, Arundhati, Hamilton, Kirk, Dixon, John and Clemens, Michael (1998) Estimating National Wealth: methodology and results, World Bank Environment Department Paper 57.
Levine, Ross and Renelt, David (1992) A sensitiveity analysis of cross-country growth regressions, American Economic Review, 82(4), 942-963.
Lucas, Robert (1988) On the mechanics of economic development, Journal of Monetary Economics, 22(1), 3-42.
Mankiw, N. Gregory, Romer, David and Weil, David (1992) A contribution to the empirics of economic growth, Quarterly Journal of Economics, 107(2) 407-437.
Nelson, Richard R. and Phelps, Edmund (1966) Investment in humans, techology diffusion, and economic growth, American Economic Review, 56(2), 69-75.
Psacharopoulos, George and Patrinos, Harry A. (2004) Human capital and rates of return, in Johnes, Geraint and Johnes, Jill (eds) International Handbook on the Economics of Education, Cheltenham: Edward Elgar.
Quinn, Dennis P. and Woolley, John T. (2001) Democracy and national economic performance: the preference for stability, American Journal of Political Science, 45(3), 634-657.
Rodríguez, Francisco and Rodrik, Dani (2000) Trade policy and economic growth: a skeptic’s guide to the cross national evidence, mimeo, Harvard University.
Romer, Paul M. (1986) Increasing Returns and Long Run Growth, Journal of Political Economy, 94(5), 1002-37.
Sachs, Jeffrey D. and Warner, Andrew (1995) Economic reform and the process of global integration, Brookings Papers on Economic Activity, 1, 1-118.
Sachs, Jeffrey D. (2003) Institutions don’t rule: direct effects of geography on per capital income, National Bureau of Economic Research Working Paper 9490.
Schultz, Theodore (1961) Investment in human capital, American Economic Review, 51(1), 1-17. Smith, Adam (1776) The Wealth of Nations, republished in 1970, Harmondsworth: Penguin
Solow, Robert (1956) A contribution to the theory of economic growth, Quarterly Journal of Economics, 70(1), 65-94.
Thomas, Vinod, Wang, Yan and Xibo, Fan (2000) Measuring education inequality: Gini coefficients of education, mimeo, World Bank.
Appendix 1: The relationship betwen growth and the investment:GDP ratio
Appendix 2: Statistical model
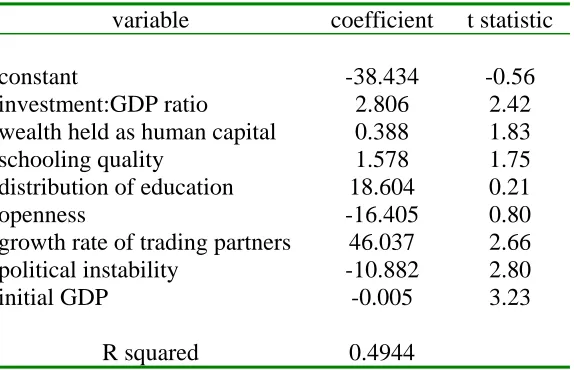
A straightforward multivariate OLS regression of growth against the variables in the graphs above provides results that are broadly in accord with the discussion in the main part of the paper. All but two variables are statistically significant at conventional levels; those that are not are the distribution of education and openness. Of the significant variables, all have the expected signs. The regression is based on data for 64 countries for which complete data are available. See Table A1.
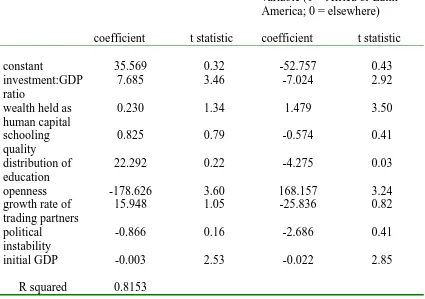
The null hypothesis that that the equation is the same for (i) African and Latin American and (ii) all other countries can be tested by way of an F test. The resulting F9,46 statistic is 8.88 which clearly indicates that we should reject the null in favour of
the alternative. Table A2 shows the re-estimated equation with separate coefficients for the two areas of the world that we have identified. Note that the explanatory power in this equation, as measured by R squared, rises to 82 per cent.
[image:25.595.91.378.402.587.2]Some circumspection is needed when analysing equations of this kind. In particular, issues of endogeneity bias are of concern. These issues are not tackled here owing to a lack of available instruments. Nevertheless, the finding that the equation is not robust across broadly defined regions is likely to be instructive.
Table A1 Regression explaining % per capita growth rate 1980-2000
variable coefficient t statistic
constant -38.434 -0.56
investment:GDP ratio 2.806 2.42
wealth held as human capital 0.388 1.83
schooling quality 1.578 1.75
distribution of education 18.604 0.21
openness -16.405 0.80
growth rate of trading partners 46.037 2.66
political instability -10.882 2.80
initial GDP -0.005 3.23
Table A2 Regression explaining % per capita growth rate 1980-2000, two region world
variable non-interacted variables
coefficient t statistic
variables interacted with binary variable (1 = Africa or Latin America; 0 = elsewhere)
coefficient t statistic
constant 35.569 0.32 -52.757 0.43
investment:GDP ratio
7.685 3.46 -7.024 2.92
wealth held as human capital
0.230 1.34 1.479 3.50
schooling quality
0.825 0.79 -0.574 0.41
distribution of education
22.292 0.22 -4.275 0.03
openness -178.626 3.60 168.157 3.24
growth rate of trading partners
15.948 1.05 -25.836 0.82
political instability
-0.866 0.16 -2.686 0.41
initial GDP -0.003 2.53 -0.022 2.85