Munich Personal RePEc Archive
Donor fragmentation
Knack, Stephen and Rahman, Aminur
World Bank
2008
Online at
https://mpra.ub.uni-muenchen.de/28043/
Donor Fragmentation
Stephen Knack*
and
Aminur Rahman**
*World Bank, 1818 H St. NW, Washington DC 20433. E-mail: [email protected].
**Foreign Investment Advisory Service, The World Bank Group. E-mail: [email protected].
1. Introduction
Every few years, there are calls to launch a ―new Marshall Plan,‖ whether for
Africa, Central America, the ex-Soviet bloc countries, or to fight scourges such as
HIV/AIDS. Most recently, Condoleeza Rice framed US plans for spreading democracy
in the Middle East in terms of a ―new Marshall Plan.‖
Why is the Marshall Plan analogy so popular? Because advocates for grand new
aid initiatives must go back all the way to the 1940s for an example that was widely
acknowledged as a success. Performance of aid programs for less-developed nations in
recent decades is generally considered to be abysmal, even by many aid industry
advocates and practitioners. What accounts for the difference in performance?
Today’s aid recipient nations are certainly different from Marshall Plan
beneficiaries in important ways. Despite wartime death and destruction, Western Europe
had skilled labor, experienced managers and entrepreneurs, and a history of reasonably
effective financial and judicial systems, and public administrations
(Degnbol-Martinussen and Engberg-Pedersen, 2003: 288).
Donors are also different today, however. There are many, many more of them.
Marshall Plan recipients had to deal only with a single donor, in contrast to the dozens of
bilateral and multilateral agencies and hundreds of NGOs in the aid business today. ―The
Marshall Plan worked because there was one donor, the U.S., and the U.S. set up rules
that ensured the Europeans would themselves take charge.‖ 1
Marshall Plan aid was
similar to a structural adjustment program (De Long and Eichengreen, 1993), but with
conditions both fewer in number and more aligned with preferences of recipient
governments than characterize many latter-day programs. Moreover, unlike much of
today’s aid, Marshall Plan loans were not disbursed in the form of hundreds of separate
donor-managed projects in each recipient nation.
The success of aid programs in Taiwan, Botswana and Korea are also commonly
attributed in part to the presence of a single or dominant donor (Brautigam, 2000; Azam,
Devarajan and O’Connell, 2002). In contrast, most recent recipients of large amounts of
foreign aid interact with dozens of donors, each with projects in a large and increasing
number of economic sectors (World Bank, 2001). The UNDP Resident Representative in
Lesotho in 1981 counted 61 donors financing 321 projects, in a country of only 1.4
million people (Morss, 1984). In 2002, there were 25 bilateral and 19 multilateral donors
and about 350 international NGOS operating in Vietnam, accounting for over 8000
development projects (Acharya et al., 2003). In the typical African country, aid is
provided by ―some thirty official donors in addition to several dozen international
NGOs…through over a thousand distinct projects and several hundred resident foreign
experts‖ (van de Walle, 2001: 58). Thousands of quarterly project reports are submitted
to multiple oversight agencies. Hundreds of missions monitor and evaluate these projects
and programs annually in many recipients, and each mission expects to meet with key
government officials and to obtain comments from officials on its reports (van de Walle
and Johnston, 1996).2
Why should aid may be more effective when delivered by a single (or dominant)
donor? Where many donors -- each responsible for only a small part of development
assistance – operate, responsibility is diffused. Any single donor has little reputational
stake in success or failure of the recipient’s development program (Belton, 2003). From
the perspective of a recipient country’s welfare, incentives for any one donor to shirk on
2
activities that maximize overall development in favor of activities that contribute to
donor-specific goals strengthen as the number of donors increases.
Donors’ multiple and conflicting objectives exacerbate this basic collective action
problem. Donors are undoubtedly in most or all cases concerned with development of
the recipient country, but must trade this objective off against other goals as well, such as
commercial and security objectives. Aid agencies additionally have the objective of
maximizing their budgets, requiring them to satisfy key domestic constituencies in
parliament – requiring in turn that they sacrifice development objectives when those
inevitably sometimes conflict with the need to maintain good relations with domestic aid
contractors and advocacy groups. To build domestic support for large aid budgets --
particularly in donor nations such as the U.S. where voters tend to be more skeptical of
the value of foreign aid – the impact of aid programs must be visible, quantifiable, and
directly attributable to the donor’s activities. These requirements often can be met only
at the expense of reducing the actual developmental benefits from aid programs.
Costs associated with a proliferation of donors can be grouped into two broad
categories. Some costs are felt immediately, with the burden falling primarily on the
projects or sectors in question. Tying aid to the employment of donor-country
contractors is a major example.3 Also detracting from aid’s value are transactions costs
associated with numerous and diverse donor rules and procedures for managing aid
projects and programs, different languages and fiscal calendars, etc. (see Berg, 1993: 81;
UNDP, 2003: 148).4
3 This practice is estimated to reduce aid’s real value by between 15% and 30% (Jepma, 1991).
The second category of costs is more insidious and long-lasting, involving donor
practices that tend to undermine the quality of governance or retard the development of
public sector capacity. A few examples of these practices include providing aid through
projects rather than through budget support, bypassing central government units (for
example, by the use of project implementation units), relying on expatriates instead of
subsidizing ―learning by doing‖ by hiring local staff, and funding investment projects that
in the aggregate imply unrealistically high recurrent expenditures in future years – so that
roads are often built but not repaired, and schools are built but not staffed (Brautigam,
2000). Donors engage in these practices to increase the visibility of their efforts and the
short-term appearance of success for their individual projects, at the expense of coherent
policy making and capacity building in the recipient country’s public sector (World
Bank, 1998: 84). It is well-known in the aid business that however successful a project
appears on its own terms, it will have little or no sustained impact in a poor sector-policy
environment, and where it is not integrated into other donor-funded or government
projects (Easterly, 2003: 7; Kanbur and Sandler, 1999: 29). However, where there are
numerous donors, any one of them would gain only a small share of the total benefits, in
terms of project success, from devoting resources to improving administrative capacity in
the country, and would be subsidizing the success mostly of other donors’ projects.
Shifting this discussion from conceptual arguments and anecdotes toward
systematic measurement and testing, the next section introduces measures of the degree
of donor fragmentation in aid recipient countries. Using these measures, section 3
describes several pieces of cross-country evidence, suggesting that fragmentation may
reduce quality of the public administration in aid recipients, distort public expenditure
allocations, and impair progress on public budgetary management reform efforts.
2. Measuring Donor Fragmentation and Project Proliferation
Two different data sources can be used for constructing useful measures of donor
fragmentation and project proliferation. A breakdown of annual disbursements of official
development assistance (ODA) by various bilateral and multilateral donor agencies,
treating the various UN agencies as separate donors, is provided in OECD (2004). From
these data, an index of donor fragmentation can be calculated for each aid recipient
country, for each year, by summing the squared shares of aid over all donor agencies and
subtracting the resulting Herfindahl index from 1, to form an index for which higher
values reflect greater fragmentation of aid.5 Values for this index increase with the
number of donors providing aid to the country, and with greater equality of aid shares
among donors, reflecting the absence of a dominant donor.
During the year 2000 among recipients of substantial amounts of aid,
fragmentation averages about .7. Values were lowest for Jordan (.21) and Zimbabwe
(.25). Many African countries had values above .9, including Mozambique (.91),
Ethiopia (.92), Lesotho and Cape Verde (.93).
Year-by-year changes in this fragmentation index, averaged over all countries,
show an upward trend from 1975 onward (figure 1). This increase largely reflects an
increase in the number of DAC donors. For example, the European Bank for
Reconstruction and Development (EBRD) was founded in 1991, to aid the transition
5 O’Connell and Saludo (2001) compute Herfindahl indexes of donor concentration for aid recipients in
economies in Eastern Europe and former Soviet Union. Over time, some aid recipients
such as Greece and Portugal became donors.6
In addition to the DAC disbursements data, the Development Gateway’s AiDA
(Accessible Information on Development Activities) data base is used to construct an
alternative fragmentation index. This source contains records provided by the DAC and
other sources on hundreds of thousands of investment projects and other activities
financed by various donor agencies.7 A count of projects sponsored by each donor can be
made. From these counts, a fragmentation index is computed from donors’ shares of
projects. Fragmentation indexes were computed two different ways, first treating each
agency or department as separate donors (for example, USAID and USDA), and second,
treating each funding nation (e.g. the USA) or multilateral institution as a single donor.
The mean for the first index is (by construction) somewhat higher, but the two indexes
turn out to be nearly perfectly correlated. For this project-based fragmentation index for
the post-1990 period, values range from .07 for Suriname to .90 for Niger and Mongolia,
and .92 for Turkey.
The fragmentation indexes calculated from project counts in AiDA provide a
somewhat different picture of donor fragmentation across countries than does the index
calculated from DAC aid volumes. The latter, averaged for the 1990s, is correlated at
only .44 with indexes based on projects with start dates in the 1990s. The two types of
indexes are not directly comparable, however. First, the DAC data used include only
ODA, while the AiDA data base also includes some non-concessional loans. Second, it
is more difficult to pin down relevant dates for the projects data. About 60% of all
6 The trend in this measure may overstate the increase in donor uncoordination, however, as budget support and the prevalence of sector-wide approaches has increased somewhat in recent years.
7
activities included in AiDA lack project start and end dates. Indexes computed for any
given sub-period, such as the post-1990 period, require dropping all projects without start
dates. Particularly for years prior to 1987, such indexes will therefore be based on very
incomplete project data.8 Unlike the case using the DAC disbursements data, AiDA
cannot be used to generate annual fragmentation values at all. However, it is likely that
fragmentation is fairly stable across countries over time; e.g. the fragmentation indexes
for 1982 and 1997 based on DAC aid volumes are correlated at .87. An index based on
all AiDA records (some dating to the late 1940s) is correlated with one based on
activities with start dates of 1990 or later at .81.
Certain caveats apply equally to interpretation of both sets of fragmentation
measures. Most notably, a donor’s expenditure share or project count share will not
always accurately reflect its level of involvement and influence in a recipient’s
development program. Both the DAC- nor AiDA-based indexes measure only donors’
―market shares.‖ One donor may undertake its activities in ways that are less intrusive
and less institutionally corrosive than another donor with a similar share of aid.
Fragmentation can be computed for different aid sectors, such as education,
health, and water, because projects (in AiDA) and aid commitments (but not
disbursements, in the DAC data) are coded by sector. A high level of fragmentation
overall is in principal consistent with donor specialization and hence low fragmentation
in individual sectors. Mean levels of fragmentation in fact are somewhat -- but not
dramatically -- lower within individual sectors. However, in countries where
fragmentation overall is high, fragmentation within sectors also tends to be high.
8
The AiDA data base can also be used to construct a project proliferation measure,
from the total count of projects recorded in a period (with or without adjusting for size of
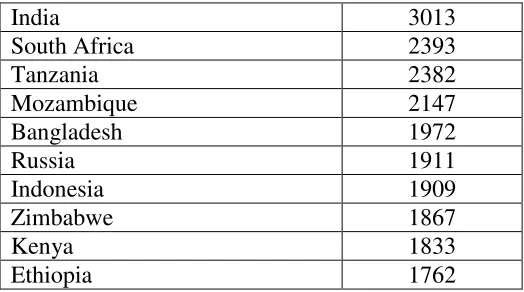
the recipient country), subject to the limitations noted above. Table 1 lists the ten
countries with the largest number of projects with start dates after 1990.9 Larger
countries, unsurprisingly, tend to have more projects. The correlation between (log of)
1990 population and (the log of) projects is .62. Also not surprising, fragmented aid
tends to be associated with project proliferation: the DAC-based and AiDA-based
fragmentation indexes for the 1990s are each correlated at about .51 with (the log of) the
number of projects with start dates of 1990 or later. This relationship remains very strong
controlling for population.
3. Where is Aid More Fragmented?
Table 2 reports mean levels of fragmentation and project counts (for 1990 and
later) for various country groups. Donor fragmentation and project proliferation tends to
be more extreme in low-income than in middle-income aid recipients. By region, Latin
America and East Asia/Pacific stand out for having lower rates of fragmentation. Both
project counts and fragmentation measures are highest in South Asia; an obvious
hypothesis is that this has something to do with the average size of countries and low
average incomes in this region, which includes India, Bangladesh and Pakistan.
Table 3 reports regressions of country-level fragmentation and project counts on
aid/GNI, per capita income, country size, and as et of regional dummies (with
sub-Saharan Africa as the reference category). The partial effect of aid levels on the
AiDA-based fragmentation variables is insignificant (equations 1 and 2). Aid is actually
9
negatively related to fragmentation averaged over 1990-2001 as measured by DAC
disbursements (equation 3). As expected, aid is positively and significantly associated
with project counts (equation 4).
Per capita income is significantly related only to the disbursements-based
fragmentation measure, with higher incomes associated with lower fragmentation
(equation 3). Some but not all fragmentation measures are positively and significantly
associated with country size (equations 1-3). Other things (including aid/GNI) equal,
larger countries have more projects (equation 4).
Even with the control variables, the same two regions -- Latin America/Caribbean
and East Asia/Pacific – stand out for their lower rates of fragmentation. Latin America
however has significantly more projects than otherwise predicted by country size, and aid
and income levels (equation 4). East Europe/Central Asia stands out for its high
fragmentation values (equations 1 and 2). The South Asia dummy is insignificant in
every case: the high average rates of fragmentation and project proliferation for these
countries in Table 2 are explained very well in Table 3 by their large populations, and to
a lesser extent by their relatively low incomes and aid/GNI levels.
4. Does Fragmentation Matter? Cross-Country Evidence
Poaching
Pressures to show tangible results for their projects commonly leads donors to pay
salary supplements to the more talented local staff. This practice distorts incentives for
civil servants to turn their attention away from their other responsibilities—even those
-7).10 It also creates incentives for officials to protect and extend aid projects from which
they benefit, regardless of their merit, and to help perpetuate the practice of spending aid
funds in the form of independent projects rather than in the form of coordinated,
sector-wide programs or budget support (Acharya et al., 2003). Examples of these problems are
prevalent in Africa.
In Niger, for instance, the majority of NGOs appear to be operated by moonlighting civil servants and ex-ministers of cabinet. In several cases, high-level officials left government to create NGOs in order to receive donor support that had once gone to
the official’s ministry (van de Walle, 2001: 165).
In Malawi and other southern African countries, doctors and nurses are leaving public
hospitals and clinics in droves, ―to take more lucrative positions in foreign-funded
HIV-AIDS programs‖ (Burkhalter, 2004). Fallon and da Silva (1994: 98) write of
Mozambique:
Donor-driven competition for skilled personnel is creating immense problems for government. The preoccupation of many donors with ensuring that their local administrations have a full complement of qualified staff and with securing, at all costs, the manpower required to implement their projects is depriving the government of the capacity to effectively manage its administration.
In this spirit, Knack and Rahman (2003) write down a simple formal model of
donors’ choices regarding whether or not to ―poach‖ the better-qualified civil servants to
run their own projects. A competent government bureaucracy increases the returns to all
donor-run projects, but in maximizing the likelihood of success in their respective
projects, each donor treats the government bureaucracy as a common-pool resource.
Where there are fewer donors, each with a larger share of projects adversely affected by
10
deteriorating administrative capacity, the external costs from poaching may be
sufficiently high for an individual donor to influence its decision.
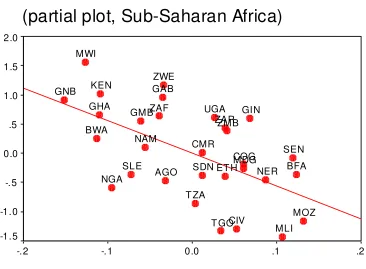
The model predicts that bureaucratic quality will erode more in recipients with
greater donor fragmentation, i.e. with a larger number of donors each with a smaller share
of the project market. Bureaucratic quality can be measured by a subjective index
available for most countries from the International Country Risk Guide (ICRG), over the
1982-2001 period. Controlling for aid/GNI, the initial level of bureaucratic quality, the
length of the interval over which ICRG data are available for each country, population
growth, and per capita income growth, Knack and Rahman (2004) find that donor
fragmentation is associated with larger declines (or smaller improvements) in
bureaucratic quality. Figure 2 depicts the partial relationship between fragmentation
(measured by the AiDA project counts) and changes in bureaucratic quality for
sub-Saharan Africa, the most aid-intensive region.
Public Expenditures
Greater donor fragmentation, implying reduced donor accountability, can increase
the risk of uncontrolled investment spending. A donor with a small share of the aid
market in a country is less likely to be concerned about whether future recurrent spending
implied by today’s investment projects are sustainable, and about whether the projects are
mutually consistent. It is more likely to bypass the central finance and planning
ministries to work directly with line ministries or local governments which view future
budgets as a common resource pool (Brautigam, 2000).
Unless aid is fully fungible, more aid can be expected to raise capital expenditure
be stronger where donor fragmentation is greater. Equations 1 and 2 of Table 4 test this
proposition using cross-country annual data for the period 1975-2001. Control variables
include per capita income, population, and a time trend.11 In both random (equation 1)
and fixed (equation 2) effects estimation, the interaction term aid x fragmentation has a
positive and significant coefficient as expected. The mean value for capital expenditure
in the sample is about 22% of central government spending. The insignificant coefficient
on the fragmentation term indicates that when aid/GNI is near 0, the level of
fragmentation unsurprisingly has no significant effect on capital spending. This effect
increases significantly as aid increases, however. For aid/GNI of about 10% (a threshold
exceeded in about 1/6 of the observations), an increase in fragmentation from .4 to .9 is
associated with an increase of about 2 percentage points to the capital spending share.
Fragmentation can also free donors to target their aid to more ―fashionable‖
sectors that appeal to home-country constituencies. In recent years, education and health
have emerged as the clear fashionable sectors among most donors, in part because of
their more apparently direct impacts on poverty reduction, which has displaced growth
and other objectives as the primary motive of aid for most major donors.12
Equations 3 and 4 test the hypothesis that the share of aid targeted to the
fashionable sectors, education and health, is higher where fragmentation is higher. The
hypothesis is supported in the random effects test in equation 3. Each .1 increment in
fragmentation is associated with an increase of nearly 0.5 percentage points in the share
of aid targeted at health and education. This is a fairly large effect, relative to the sample
11
Results on fragmentation are unchanged when year dummies are substituted for the linear time trend variable.
12
mean of 11.5% of aid going to those sectors. Fragmentation is not significant in the more
demanding fixed effects test of equation 4, however, in which estimates are influenced
only by within-country variation over time.
Public Budgetary Management Reform
Even where recipient countries are committed to public sector reform programs
advocated by donors, fragmentation can impair progress if donors’ ideas of ―best
practice‖ vary at all, or if donors are each responsible for only a small part of the overall
reform program. As part of the HIPC debt relief initiative, 24 HIPC countries agreed to
participate in an IMF-World Bank assessment of their public budgetary systems. With
assistance from these institutions, countries agreed to ―action plans‖ to address various
weaknesses that were diagnosed in these systems, with the goal of improving donors’
confidence that debt relief would be used by recipient governments for worthy
poverty-fighting purposes. In some countries, a very small number of donor agencies were
involved in these budgetary reform efforts, while in other countries numerous donors
provided technical support and advice. A systematic review found that, controlling for
other factors, more progress was made on budgetary reform in countries with fewer
donors ―helping‖ them (IMF/World Bank, 2004).
5. Conclusions
If fragmentation has damaging consequences, why aren’t more recipients more
selective about the aid they accept? In principal, aid recipient governments can take
measures to prevent the inefficiencies associated with competitive donor practices, either
by refusing some aid13 or by attempting to reduce the number of donors active in the
13 Uganda’s stated policy is to decline all offers of stand
country (or, at least, the number active in each sector). In practice, principal-agent
problems within the recipient country, either between a government with short time
horizons and its citizens, or between line ministries and central ministries (Wuyts, 1996:
742; van de Walle, 2001: 208), often reduce the government’s ability or willingness to
curtail donor activities that are destructive for the long-run development of the country
overall. For political leaders without sufficiently lengthy time horizons, the short-term
personal benefits of corruption and patronage practices often outweigh the long-term
costs of subverting administrative capacity (and judicial systems); insecure leaders treat
the rational-legal order essential for development as a common-pool resource (van de
Walle, 2001).
At least in some cases, therefore, poor people in recipient countries could be made
better off if donors organized to undertake measures aimed at reducing fragmentation.
This does not mean that a donor cartel should decide on a sole or lead donor to be
matched with each recipient. Each recipient could be encouraged to select for itself a
lead donor, at least for each sector receiving significant volumes of aid. Presumably
recipients would normally choose as its lead donor the one with the most relevant
expertise (based on region or sector) or which comes with the least commercial/security
objective baggage.
Strong political forces and other interests work against further increases in donor
specialization by country or by sector, however. Leaving certain problems or countries
for other donors to deal with exposes an aid agency to charges by NGOs or the media that
it is irresponsibly under-funding critically important development problems.14 Arcane
14For example, a Washington Post editorial (―Action for AIDS,‖ December 6 2003) complained that
justifications based on efficiency benefits of donor harmonization and comparative
advantage are unlikely to be an effective public-relations response. Inter-agency funding
could be a partial solution to this problem. Norway and Sweden both fund education and
health sector programs in Ethiopia, but Sweden is arranging to channel its health funding
through Norway, while Norway will channel its education funding through Sweden
(OECD, 2003: 97).
Competition at the global level among aid agencies also tends to inhibit
specialization; for example the World Bank attempts to establish intellectual leadership in
as many development themes and sectors as possible. Despite the ongoing high-level
harmonization initiatives by aid agencies, there remain grounds for skepticism that
political and bureaucratic exigencies of donors will be trumped by demands for improved
aid effectiveness (van de Walle, 2001: 233; OECD, 2003: 118).
Publicizing various measures of donor performance, by the OECD DAC or by
independent organizations such as the Center for Global Development, could marginally
improve the incentives faced by aid agencies. Performance measures could include not
only the share of aid that is tied, but also measures of how each donor proliferates aid
across recipients and sectors (Acharya et al., 2003), the share of aid channeled through
multilateral organizations, the number of missions and reports required relative to aid
Table 1
Project Counts (start date of 1990 or subsequent) Source: AidA, 2003 (Development Gateway)
India 3013
South Africa 2393
Tanzania 2382
Mozambique 2147
Bangladesh 1972
Russia 1911
Indonesia 1909
Zimbabwe 1867
Kenya 1833
Ethiopia 1762
Table 2
Fragmentation and Proliferation by income and region groupings
AiDA (agency)
AiDA (donor)
DAC Projects (AiDA)
Low-income .79 .78 .80 606
Middle-income .68 .67 .68 325
Sub-Saharan Africa (45) .79 .78 .80 606
East Europe/Central Asia (10) .86 .85 .66 537
South Asia (6) .81 .80 .85 809
Middle East/North Africa (8) .80 .79 .75 242 Latin America/Caribbean (18) .58 .57 .64 361
[image:18.612.85.527.381.539.2]Table 3
Correlates of Donor Fragmentation
Equation 1 2 3 4
Dependent variable AIDA (agency)
AIDA (donor)
DAC Project count
Constant 14.60
(44.27) 12.87 (43.97) 201.71 (40.31) -3.50 (1.52)
Aid/GNI 0.11
(0.12) 0.12 (0.12) -0.20* (0.10) 0.02** (0.01) Log GDP per capita,
1990 -0.85 (3.53) -0.68 (3.52) -13.21* (3.52) 0.04 (0.12) Log population, 1990 4.48** (1.56) 4.46** (1.54) -2.36 (1.31) 0.58** (0.06) Latin America/Caribbean -13.01* (6.36) -12.84* (6.32) 1.26 (5.61) 0.59** (0.21) East Europe/Central Asia 8.79** (3.28) 8.08* (3.29) -7.04 (4.75) -0.26 (0.27) Middle East/North Africa -0.66 (7.84) -1.09 (7.45) 4.46 (5.59) -0.66 (0.34) South Asia 0.83
(5.83) 1.04 (5.83) 1.61 (2.60) 0.22 (0.18) East Asia/Pacific -12.70*
(4.99) -12.32* (4.94) -12.27* (5.15) 0.19 (0.20)
R2 .50 .49 .52 .69
Std. error of est. 13.9 13.7 12.8 0.65 Mean, dep. var. 73.6 72.9 75.6 5.63
Sample includes countries with aid’s share of GDP exceeding 2%. Sample size is 89 in
equations 1-2 and 4, and 90 in equation 3. Robust standard errors are in parentheses. A * (**) indicates significance at .05 (.01) for two-tailed tests. Dependent variable is
Table 4
Donor Fragmentation and Distortion of Public Expenditures
Equation 1 2 3 4
Dependent variable Capital expenditure as share of total
Social sector share of aid
Method Random effects Fixed effects Random effects Fixed effects
Year -0.396**
(0.035) -0.666** (0.056) 0.461** (0.037) 0.576** (0.082) Log GDP per
capita 3.796** (0.898) 10.809** (1.163) -0.449 (0.512) 1.196 (1.502) Log population 0.081
(0.586) 8.684** (2.014) -0.854** (0.221) -6.078* (3.009) Aid/GNI (%) -0.045
(0.153) -0.040 (0.153) -0.136** (0.039) -0.165** (0.047) Fragmentation (DAC) 0.368 (1.734) 0.211 (1.717) 4.583** (1.745) 0.620 (2.328) Aid*fragmentation 0.393*
(0.185)
0.368* (0.186)
N 1338 2867
R2 (within group) .13 .16 .05 .05
Mean, dep. var. 21.8 11.5
References
Acharya, Arnab; Ana Fuzzo de Lima and Mick Moore (2003). ―The Proliferators: Transactions Costs and the Value of Aid.‖ Institute of Development Studies.
Arndt, Channing (2000). ―Technical Cooperation.‖ In Foreign Aid and Development: Lessons Learnt and Directions for the Future, edited by F. Tarp. London: Routledge.
Azam, Jean-Paul; Shantayanan Devarajan and Stephen A. O’Connell (2002).
―Equilibrium Aid Dependence.‖ Unpublished manuscript, University of Toulouse.
Belton, Rachel (2003). ―Rebuilding Iraq: No Job For a Coalition.‖ Washington Post, April 28 (op-ed page).
Berg, Elliot (1993). Rethinking Technical Cooperation: Reforms for Capacity Building in Africa. New York: UNDP.
Brautigam, Deborah (2000). Aid dependence and governance. Stockholm: Almqvist & Wiksell International.
Burkhalter, Holly (2004). ―Misplaced Help in the AIDS Fight.‖ Washington Post, May
25, A17 (op-ed page).
Degnbol-Martinussen, John and Poul Engberg-Pedersen (2003). Aid: Understanding International Development Cooperation. London: Zed Books.
DeLong, J. Bradford and Barry Eichengreen (1993). ―The Marshall Plan: History’s Most
Successful Structural Adjustment Program.‖ In Postwar Economic Reconstruction and Lessons for the East Today, edited by Rudiger Dornbusch, Wilhelm Nolling, and Richard Layard. Cambridge, MA: MIT Press.
Easterly, William (2003). ―The Cartel of Good Intentions: The Problem of Bureaucracy in Foreign Aid.‖ Journal of Policy Reform 5(4): 1-28.
Fallon, Peter R. and Luiz A. Pereira da Silva (1994). ―Recognizing Labor Market Constraints: Government-Donor Competition for Manpower in Mozambique.‖ In Rehabilitating Government: Pay and Employment Reform in Africa, edited by D. L. Lindauer and Barbara Nunberg. Washington DC: The World Bank.
IMF/World Bank (2004). Update on Implementation of Action Plans to Strengthen Capacity of HIPCS to Track Poverty-Reducing Public Spending. Washington DC.
Kanbur, Ravi and Todd Sandler (1999). The Future of Development Assistance: Common Pools and International Public Goods. ODC Policy Essay No. 25. Washington DC: Overseas Development Council.
Knack, Stephen and Aminur Rahman (2004). ―Donor Fragmentation and Bureaucratic
Quality in Aid Recipients.‖ World Bank Policy Research Working Paper 3186.
Morss, Elliott R. (1984). ―Institutional Destruction Resulting from Donor and Project Proliferation in Sub-Saharan African Countries.‖ World Development 12(4): 465-70.
OECD (2004). Geographical Distribution of Financial Flows to Aid Recipients 1998-2002 (CD-ROM). Paris: OECD Development Assistance Committee.
OECD (2003). Harmonizing Donor Practices for Effective Aid Delivery. Paris: OECD.
O’Connell, Stephen A. and Charles C. Soludo (2001). ―Aid Intensity in Africa.‖ World Development 29(9): 1527-52.
UNDP (2003). Human Development Report 2003. New York: Oxford University Press.
Van de Walle, Nicolas (2001). African Economies and the Politics of Permanent Crisis. Cambridge: Cambridge University Press.
Van de Walle, Nicolas and Timothy Johnston (1996). Improving Aid to Africa. ODC Policy Essay No. 21. Washington DC: Overseas Development Council.
World Bank (2003). ―Cutting the Red Tape: Better Aid Delivery Through Better Donor Coordination.‖ Press Release, February 21. Washington, DC.
World Bank (2001). The Drive to Partnership: Aid Coordination and the World Bank. Operations Evaluation Department. Washington, DC.
World Bank (1998). Assessing aid: What works, what doesn't, and why. New York: Oxford University Press.
Wuyts, Marc (1996). ―Foreign Aid, Structural Adjustment, and Public Management: The Mozambican Experience.‖ Development and Change 27: 717-49.
Trend in mean donor fragmentation
Year
1999 1997 1995 1993 1991 1989 1987 1985 1983 1981 1979 1977 1975 .70
.68
.66
.64
.62
.60
.58
.56
[image:23.612.140.549.83.461.2].54
Donor fragmentation & bureaucratic quality
(partial plot, Sub-Saharan Africa)
Donor fragmentation (residual)
.2 .1
0.0 -.1
-.2 2.0
1.5
1.0
.5
0.0
-.5
-1.0
-1.5
ZWE
ZMB ZAR
ZAF UGA
T ZA
T GO SLE
SEN
SDN
NGA NER
NAM MWI
MOZ
MLI MDG
KEN GNB
GMB GIN
GHA
GAB
ET H COG CMR
CIV BWA
[image:24.612.134.500.141.410.2]BFA AGO