http://dx.doi.org/10.4236/jpee.2014.24020
Probabilistic Issue of Reliability for Power
Machinery Operating in Coal Fired Power
Plants
Janusz Buchta, Andrzej Oziemski, Maciej Pawlik
Lodz University of Technology, Institute of Electrical Power Engineering, Lodz, Poland Email: janusz.buchta@p.lodz.pl, andrzej.oziemski@p.lodz.pl
Received January 2014
Abstract
The paper presents results of reliability analysis made for lignite fired 370 MW rated power units installed in the Belchatow Power Plant (Poland). The concept of standardized power unit and the method of a histogram with a set number of observations in each class were applied in a study. The study includes analysis of probability distributions of operation times and repair times for the main power unit components. Empirical probability distribution functions have been identified and their parameters estimated in the study. The final forecast includes an estimation of such re-liability measures like expected operation time, expected failure rate, average repair time and expected annual failure duration.
Keywords
Power Unit; Reliability Indices; Probability Distribution Functions of Operation Time and Repair Time
1. Introduction
The maintenance practice shows that failure frequency of power unit components is many times higher than other components of the power system (overhead lines, transformers, switchgear, control systems, protections etc.) [1,2]. Intense wear and tear of machine elements as well as the necessity of maintenance works effect rou-tine repairs of power units. The economic impact of power unit shut-down depends mainly on failure frequency, duration of repair and the period of the year in which the shut-down happens. A very important issue is therefore to optimize the values of these quantities.
The main reasons of power machinery failures can be classified as follows:
• Errors in construction and design;
• Material defects;
• Assembly errors;
• Operational wear and tear of material (corrosion, erosion, fatigue, strain, ageing);
• Influence of external conditions (e.g. lack of fuel or water, power system disturbances);
• Mistakes in machinery operation;
• Insufficient care to keep installation in appropriate technical condition.
The first three groups of mentioned above reasons generally reveal during the early lifetime of power machi-nery and are removed au courant during the warranty repairs. Reasons belonging to the fourth revealed after a longer period of operation. However, particular attention should be paid to the last three groups of reasons which depend directly on skills of operational staff working in power plant.
2. Mathematical Basis of the Reliability Estimation of Power Units by the Method
of a Histogram
Power units are complicated thermal and mechanical installations consisting of several components with a dif-ferent level of redundancy. Basic power unit components (boiler, turbine, generator) are singular. However, an auxiliary devices (ID fans, FD fans, coal mills, feed pumps, condensate pumps, cooling water pumps, ash han-dling etc.), in order to increase reliability of operation, have overt or latent reserve (structural redundancy).
The characteristic feature of power unit reliability, directly resulting from the redundancy of an auxiliary sys-tem is the possibility to appear failures of different kind, i.e. power unit continues operation with its rates, power unit operates with power limitation or power unit must be shut-down. This means that power unit is a mul-ti-stage object in sense of its reliability, on the contrary to the two-stage installations staying in ability or inabil-ity to operate, which refers to many power transmission and distribution devices. A multi-stage feature causes that reliability analysis of power unit uses Markov or more complex semi-Markov processes, which form an adequate probabilistic model.
An operational reliability analysis of complex installation is performed using a reliability diagram which layout usually differs from the functional structure of an installation. Reliability diagram maps the impact of any item on the reliability of the entire system. The layout of reliability diagram of power plant is of a mixed type with dominance of serial connections of elements.
Analytical methods for the assessment of power unit reliability based on Markov processes, in which reliabil-ity measures for the entire unit are determined from reliabilreliabil-ity indices of single components, have one important drawback—the lack of a sufficiently large population of analyzed events for most components under considera-tion.
Since the first of dozen 370 MW units was commissioned in the Bełchatów Power Plant in 1982, a systematic research on power units reliability was initiated by the Institute of Electrical Power Engineering at Lodz Univer-sity of Technology. The principal target of analyses prepared yearly has been estimation of actual reliability measures of main generating devices of power units. Statistical data files of the successive years of the power plant operation have been systematically complemented and verified. The verification of statistical data consist in elimination of events which are not of random origin (i.e. actively influenced by operation and maintenance staff) and these, which were not qualified as break-downs only because there was enough ready-reserve power during failure.
Using reliability model and computer database worked out for the 370 MW power unit, the most defective elements of the boiler, turbine, generator and auxiliary systems have been identified [3,4]. For selected elements, empirical probability density functions of operation times, repair times have been determined with use of the histogram with a set number of observations in each class.
fol-lowing steps:
• sorting numbers in a data set of n observations in an ascending order t1, t2, t3,… tn;
• calculating number of classes r by the formula r = 2ln(n) and rounding down r to the nearest integer;
• calculating number of observations m in each class by the formula m = n / r and rounding down m to the nearest integer;
• assigning all observations to each class in such a way that equal numbers from a data set are included in the same class; therefore the number of observations in the i-th class—ni can vary from an assumed value m;
• determining the lower and upper bound of each class; for example the upper bound of the 4th class (lower bound of the 5th class) is an arithmetic mean of the greatest number included in the 4th class and the lowest number included in the 5th class;
• calculating the i-th class interval width - ∆ti as the difference of its upper and lower bound; determining the i-th class mid value—ti as an arithmetic mean of its lower and upper bounds;
• calculating the value of an empirical probability density function by the formula
( )
x i
i
i n f t
n t =
⋅ ∆ . (1)
The histogram is completed by drawing a bar for each class.
The main advantage of this histogram is the possibility to apply for the amount of classes r≥ 7 and less nu-merous data sets. If take into account the minimum required amount of observations in a single class (ni ≥ 5), the minimum statistical sample (n≥ 35) is easy to achieve in practice.
Calculation unit was implemented in computer database to identify probabilistic models for empirical distri-butions of operational times and shut-down times of standardized 370 MW unit. Considering times of failures recorded in a computer database, times to failure and times of failure duration have been calculated. An empiri-cal probability density function fx(t) is compared with the shape of the density function of different theoretical distributions (exponential, Weibull, normal, log-normal [5]), and subjectively best distribution is selected as the one representing the random variable under investigation. The hypothesis thus constructed is verified by means of (Pearson’s and Kolmogorov) statistical tests of goodness of fit and only on this basis is the decision made to accept or reject it. All calculations are performed for the standard significance level α = 0.05.
The Kolmogorov test compares the empirical distribution function with the cumulative distribution function specified by the null hypothesis and tests goodness of fit with this distribution. The hypothesis regarding the dis-tributional form is rejected if the test statistic, λ, is greater than the critical value λα obtained from a table (λ0.05 =
1.358). Person’s chi-square test is an alternative to the Kolmogorov goodness-of-fit test. For the chi-square goodness-of-fit computation, the data are divided into r classes and the test statistic χ2 is calculated. The hypo-thesis that the data are from a population with the specified distribution is rejected if χ2〉χ2(α, r-c ). The critical
value χ2(α,r-c) is the chi-square percent point function with r-c degrees of freedom and a significance level of α.
The variable c is the number of estimated parameters for the distribution increased by 1. For example, for a 3-parameter Weibull distribution, c = 4.
A Weibull distribution is very popular statistical model in reliability engineering and failure analysis. Opera-tion times are modeled in the study by a Weibull distribuOpera-tion with the probability density funcOpera-tion defined as follows:
1
( ) exp
b b
b t t
f t
a a a
−
= ⋅ ⋅ −
(2)
where b is the shape parameter and a is the scale parameter.
When b = 1, then the Weibull distribution reduces to the exponential distribution. Failure duration times are modeled in the study by a log-normal distribution with the probability density function defined as follows:
(
)
22
ln 1
( ) exp
2 2
t m
f t
t σ π σ
−
= ⋅ −
⋅
⋅ ⋅ (3)
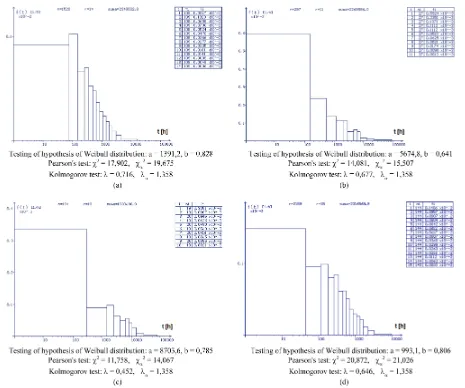
Let’s consider the histogram shown in Figure 1(a). The data set consists of n = 1520 observations. The num-ber of class intervals equals r = 14. According to the table shown in the upper-right corner, each class includes 108 or 109 observations, so that it’s a histogram with set number of observations. The width of the 1st class in-terval is 78 hours, the width of the 2nd class interval—70 hours, the 3rd class—108 hours, etc. The width of each class interval varies from another but the number of observations in each class is nearly the same. The hypothe-sis of the Weibull distribution has been tested. The shape and scale parameters of the Weibull distribution have been estimated for a given data set. The statistics χ2 and λ have been calculated in Pearson’s and Kolmogorov tests. The obtained values are less then critical statistics χα2 andλα respectively, so that both tests accept the Weibull distribution with parameters a = 1391.2 and b = 0.828.
Probability density functions f(t), cumulative distribution functions F(t) and means E(T) for considered dis-tributions are presented in Table 1.
3. Histograms of Operation Times and Repair Times for the 370 MW Power Unit,
Its Main Components and Selected Elements of the BB-1150 Steam Boiler
Dozen of lignite fuelled 370 MW rated power units operate currently in Polish power system, located in Bel-chatow Power Plant, which is the largest power plant of this type in Europe.
The idea of a standardized unit has been introduced into the reliability study of the 370 MW units. All units are homogenous in several respects such as constructional uniformity and similar conditions in which units op-erate. The standardized unit is the unit in its useful life with stabilized failure rate that substitutes a dozen of power plant units. The assumption that a standardized unit is in its useful life requires excluding a period of an early life from an operation time of respective power units. The concept of a standardized unit allows to obtain an appropriately numerous population of failures not only for a power unit but also for its main generating de-vices (boiler, turbine, generator).
While establishing the population, the cases of incidental failures that occurred in the initial period of the power plant operation were neglected. It particularly refers to units 1 and 2 during the first three years of the power plant operation. The cases of failures that occurred in first year of operation were also skipped for re-maining units. One can state that a higher failure frequency of a 370 MW power units in the initial period of their operation was caused mainly by a design, construction and assembly defects. All these factors are distinc-tive for an adaptation of new generation power units. Therefore this period was excluded while population of failures for a standardized 370 MW unit was selected.
[image:4.595.89.541.560.708.2]An investigated probability distribution functions were identified as Weibull distributions with parameter b < 1 (Figure 1). In emergency states, strong dependence of the time of damage liquidation on the cause of its oc-currence was found. Average times of shut-downs, in the case of permanent defects of the installations clearly differ from the times of shut-downs caused by the incorrect operation of the automatic control systems and safety devices, the operational staff mistakes and the like. And so, the values of times are as follows: 41.2 h and 1.76 h for the boiler, 59.3 h and 1.27 h for the turbine, 78.9 h and 1.48 h for the generator, 40.1 h and 1.95 h for
Table 1. Probability density functions f(t), cumulative distribution functions F(t) and means E(T) for considered distribu-tions.
Distribution f(t) F(t) E(T)
Exponential
λ > 0 λ⋅exp(− ⋅λ t) 1−exp(− ⋅λ t) λ
1
Weibull
a > 0
b > 0
1 exp
b b
b t t
a a a
−
⋅ ⋅ −
1 exp
b t a − − 1 1 a b
⋅ Γ +
Normal
m≥ 0
σ> 0
( )2 2 1 exp 2 2 t m σ σ π − ⋅ − ⋅
⋅ 0.5
t m
σ −
+ Φ m
Log-normal
m > 0
σ > 0
( )2 2 lg lg exp 2 2 t m e
t σ π σ
−
⋅ − ⋅
⋅ ⋅
lg
0.5 t m
σ −
+ Φ ( )
2 2
exp
lg 2 lg
m e e σ + ⋅
Figure 1. Probability density of times between failures identified as Weibull’s distribution: (a) Boiler BB-1150, (b) Turbine 18K360, (c) Generator GTHW-370, (d) Power unit. Explanations: χ2—Pearson's statistics, χα2—critical Pearson’s statistics for the significance level α = 0.05, λ—Kolmogorov statistics, λα—critical value of Kolmogorov statistics (α = 0.05) i—the class number, n—the sample size, r—the number of classes, sum—the total value of all the observations in the sample, ni—the number of observations in the i-th class, fi—the value of empirical probability density function for the i-th class.
feed water pump, respectively. Thus, it should be concluded that the times of long-term failures and short-term defects belong to two statistically different populations and that it is advisable to study their distributions sepa-rately. Generally speaking, the distributions of failure duration times are log-normal distributions (Figure 2). Empirical distribution functions of operation and failure times for each of dozen power units (Figure 3) have been also examined.
4. The Assessment of Reliability Indices of 370 MW Power Units and Their
Components
By means of estimation, parameters of identified probability distribution functions of operation times and repair times have been calculated for power machinery of 370 MW rated power units under study. Such reliability in-dices as expected failure rate, expected mean time of the shutdown, expected total time of the shutdowns and expected mean time between failures have been estimated. Table 2 presents expected values of basic reliability indices for power machinery of the standardized 370 MW rated power unit. Similarly, Table 3 presents basic re-liability indices for all power units of Belchatow Power Plant.
Figure 2. Probability density of failures times identified as log-normal distribution: (a) Generator GTHW-370 (times of long-term failures), (b) Generator GTHW-370 (times of short-term failures).
Figure 3. Probability density of times between failures identified as Weibull’s distribution: (a) Unit 1, (b) Unit 12.
Table 2. Reliability indices for main power unit components.
Failure location Expected failure rate [1/a]
Mean time of a shut-down [h]
Total time of shut-downs [h/a]
Mean time between failures [h]
B 3.90 37.8 147.3 1540
T 0.76 13.0 9.89 7880
G 0.69 25.0 17.3 8690
F 0.30 11.0 3.24 20350
W 0.16 9.3 1.52 36660
O 0.46 9.0 4.1 13160
Unit 5.36 31.0 166.1 1120
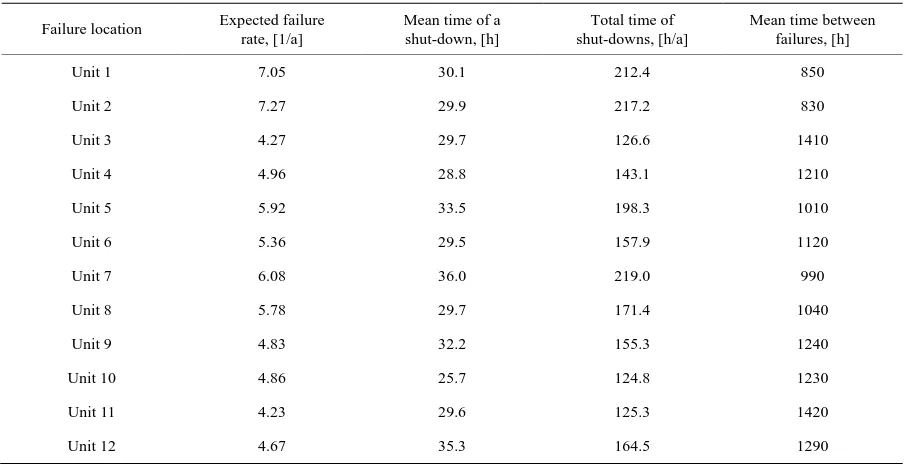
[image:6.595.89.538.551.699.2]Table 3. Reliability indices for dozen power units of Belchatow Power Plant.
Failure location Expected failure rate, [1/a]
Mean time of a shut-down, [h]
Total time of shut-downs, [h/a]
Mean time between failures, [h]
Unit 1 7.05 30.1 212.4 850
Unit 2 7.27 29.9 217.2 830
Unit 3 4.27 29.7 126.6 1410
Unit 4 4.96 28.8 143.1 1210
Unit 5 5.92 33.5 198.3 1010
Unit 6 5.36 29.5 157.9 1120
Unit 7 6.08 36.0 219.0 990
Unit 8 5.78 29.7 171.4 1040
Unit 9 4.83 32.2 155.3 1240
Unit 10 4.86 25.7 124.8 1230
Unit 11 4.23 29.6 125.3 1420
Unit 12 4.67 35.3 164.5 1290
achieved by Belchatow Power Plant. One can state that steam boiler marks out the potential to improve power plant availability factor by reduction of emergency shutdowns with support of optimal scheduling of power plant repairs. Such activities should improve operational durability of the weakest power unit components.
5. Conclusions
The security level of power system is determined by its weakest links represented by large power units which failure rates are many times higher than other components of the power system. The lack of knowledge on the reasons and frequency of failures of power machinery makes scheduling plant operation a difficult task as well as optimal scheduling of power plant repairs and enabling of power supply continuity.
Statistical data on operational disturbances that appeared in power plant lifetime have been carried out syste-matically for Polish power units rated at 370 MW and fuelled with lignite. Having this database, it’s possible to analyze the changeability of reliability indices in a long-term perspective and define reasons or effects of defec-tive operation of power machinery. Economically excused failure rates are reasonable measures for durability of power machinery and their components in determination of modernization schedules and rationalization of maintenance and materials management in entire power plants under study.
The final decision on power machinery maintenance should be accepted on the ground of observation of the element intended to repair with use of both diagnostic and prognostic methods. In global sense, power units availability and reliability indices may be useful to determine operating and replacement reserve in power sys-tem.
References
[1] Allan, R.N. and Billinton, R. (1993) Power System Reliability and Its Assessment. Power Engineering Journal. [2] J. Paska, P. Wójcik, J. Bargiel, W. Goc and P. Sowa, “Data for electric power system calculations,” 8th International
Conference on Electrical Power Quality and Utilisation, Poland, 1-5 September 2005, pp. 477-482.
[3] Oziemski, A. (2012) Racjonalizacja Gospodarki Remontowej Bloków Energetycznych Opalanych Węglem w Ujęciu Probabilistycznym. Przegląd Elektrotechniczny, 12a, 159-166.
[4] Pawlik, M., Skierski, J. and Oziemski, A. (2001) Zuverlässigkeitsbewertung von Braunkohlegefeuerten Kraftwerk- sblöcken großer Leistung. XXXIII Kraftwerkstechnischen Kolloquium, Dresden, 141-152.