A Study on Total Literacy Campaign Adopted by Andhra
Pradesh Particularly in Guntur District
Dr. Smt. M. Esther Suneela *, Mr. G. Yenoku **
* Research Director, Principal, A L College Of Education, Guntur
** Researcher, Principal, Repalle Chrisitan College Of Education, Repalle, Guntur, Dist
DOI: 10.29322/IJSRP.9.01.2019.p8552
http://dx.doi.org/10.29322/IJSRP.9.01.2019.p8552
Synapses- "Development obviously has its economic side, and important it is. But, if the human resources of a country are viewed in the same manner as the mineral and animal reserves, a grossly distorted image will inevitably ensure. Real development must depend on balanced growth of the person both as an economic and social being" (Coles 1977: 4).
Perceptions of functionaries, who worked under NLM, TLC, EFA, DPEP, SSA and NAEP, on various aspects of the administrative system adopted under the programmes were taken and these opinions on administrative aspects were classified into positive and negative categories. Many functionaries during the Focus Group Discussions and interviews revealed that the administrative structure of NAEP was well organized compared to any other adult education programme implemented in India. They opined that the government, for the first time, has institutionalized the adult education programme and created permanent structures for its implementation. In Andhra Pradesh, the structures created under NLM, TLC, EFA, DPEP, SSA and NAEP are still in existence and have blown a backbone for the successive programmes launched in India.
Index Terms- Literacy, campaign, National Literacy Mission, Total Literacy campaign, Education for all, District Primary Education Programme, Sarva Shiksha Abhiyan and National Adult Education Programme, etc
I. INTRODUCTION
NESCO: “Define literacy as the ability to identify, understand, interpret, create, communicate complete and use printed and with materials associate with varying context literacy involves a continuous of learning in enabling individuals to achieve to their goals, to develop their knowledge and potential to participate fully in their community and with society.
The working definition of literacy in the India census 1991 is as follows:
• Literacy rate: The total percentage of population of an
area at a particular time aged seven and above who can read and write with understanding. Hence the Denominator is the population aged seven years or more
• Crude literacy rate: The totally percentage of the people of an area at a particular time aged seven years or above
who `can read and write with understanding taking the total population of the area as the denominator.
II. CONCEPT OF EDUCATION:
Man by nature is a social animal. Silence is unnatural in his life. He wants to have contact with his fellow beings one way of the other. He wants to gain something out of something. He becomes knowledge through different sources like books, films, radio, T.V., Newspaper, or through different contact with different persons and places. He will be a different individual from thereafter. His inquisitive mind craves knowledge and staying isolated is unnatural to man. He begins life with a cry, to know everything around him. This leads him from ignorance to light – the light of life. The continuous accumulation of knowledge from different directions is Education. This exterminates barricades in one’s own life. This is only the means to life but not life itself. Life without proper direction will lack essence. One will lose the nectar of cultured, civilized life. He will not become what he wants to become if he is deprived of education.
III. HISTORICAL IMPORTANCE OF THE EDUCATION: As for population is concerned, India is the largest democracy in the world. Geographically, we are a vast country spread over 329 million hectares of land supporting 1045 million people (2002 estimate) about 1.25 times the total pollution of Europe. During the last five decades, our number has tripled. With the birth of 48,000 children per day, 18 million are added every year to our population. This addition is more than the total population of Australia. With only 2.4 per cent of the total global land and 2 per cent of the total world’s income, we bear the burden of 16.7per cent of the total population of the world.
1. THE National Literacy Mission (NLM) :
THE National Literacy Mission (NLM) was established in 1988, with the objective of revising and strengthening the existing adult education programmes in the country and making them mass programmes. Several evaluations were conducted by the Mission, and projects like the Rural Functional Literacy Programme, the Mass Programme of Functional Literacy, the adult education programmes of voluntary agencies and state governments were revised. These efforts did not lead to a satisfactory strategy for the eradication of mass illiteracy. Defines literacy as the acquiring the
skills of reading, writing, and arithmetic and the ability to apply them to one’s day to day life. The achievement of functional literacy implies.
2. The Total Literacy Campaign (TLC)
The Total Literacy Campaign (TLC) is a dominant strategy for eradication of adult illiteracy in India. This approach is a potent and viable model which helps to achieve a significant breakthrough in the literacy scene in India. It constitutes the principal strategy of National Literacy Mission (NLM). This TLC is area-specific, time bound, volunteer-based, cost effective and outcome-oriented. The thrust is on attainment of functional literacy through prescribed norms of literacy and numeracy. The learner is the focal point in the entire process. The measurement of learning outcome is continuous, informal and participative.
3. EDUCATION FOR ALL:
Ever since 1951, India has been making an all-out effort to universalize primary education. In this direction and to fulfill this ambitious plan, steps have planned — Educational facilities within easy walking distance of the child, encouraging parents towards a compulsory enrolment of children in the schools, taking due note of the drop-outs among children and to avoid such a situation in the best possible way and improving the quality of education at the primary level and making it more attractive in order to allure the child to come to the school.
4. DISTRICT PRIMAY EDUCATION PROGRAMME
(DPEP).
Initiated in 1994, the District Primary Education Programme (DPEP) is under implementation in 271 districts in the country across 18 states. District Primary Education Programme is part of Social Safety Net Credit Adjustment Loan under the Structural Adjustment Programme of the World Bank to India in 1991.
5. SARVA SHIKSHA ABHIYAN:
Sarva Shiksha Abhiyan (SSA) is Government of India's flagship programme for achievement of Universalization of Elementary Education (UEE) in a time bound manner, as mandated by 86th amendment to the Constitution of India making free and compulsory Education to the Children of 6-14 years age group, a Fundamental Right.
6. NATIONAL ADULT EDUCATION PROGRAMME
(NAEP).
The National adult Education Programme was launched on 2nd October, 1978. The programme aims at eradicating illiteracy
among adults of the age group 15 – 35.
1.2 Literary review:
While studies concerning various aspects of adult education, both from the theoretical and empirical view point, are highly useful in coming to grips with the very process of educating the masses of varied background, it is an inevitable reality that the programmes themselves are critically assessed as to their efficacy and success or failure in terms of achieving the intended goal.
Manoharlal and Rajeswari Mishra (1982) conducted a study on Adult Education in Bihar. The objective of this study was
Functional Literacy Projects. It dealt with the administrative and pedagogical issues of NAEP. The findings of the study were with regard to the up gradation of functional skills and social awareness.
With the help of reputed social science institutions, the Government of India (1988) had conducted evaluation of literacy programmes under NAEP. The evaluation reports of the programme mentioned the strengths and weaknesses, which are given below.
The Strengths of NAEP were:
1. Women motivation and participation was high. 2. Coverage of SCIST was higher than the target. 3. The Project approach to management was feasible. 4. State Resource Centers have contributed significantly to
the programme.
5. The quality of teaching /learning material, which was brought out by them was good.
6. The programme worked well in those States where the adult education functionaries were recruited under special section procedures.
The weaknesses of NAEP were:
1. The quality of training of functionaries was poor. 2. The monitoring system lacked credibility and there was
considerable misreporting.
3. The learning environment in adult education centers was defect and lighting arrangements were poor.
4. Mass media did not provide appreciable support. 5. Voluntary agencies did not receive cooperation from the
State Governments and the procedures for their involvement discouraged them.
1.3 Plan and procedure: Statement of the Problem
The topic of research entitled, A study on total literacy campaign adopted by Andhra Pradesh particularly in Guntur Dist.
Scope of the Study
The main intention of the study is to analyse the approaches that are followed in Literacy programmes and to analyze the positive and negative aspects related to different strategies adopted in those programmes(NLM, TLC, EFA, DPEP, SSA, NAEP) in the Guntur, district of Andhra Pradesh, the study attempts to identify the type of relationship between different aspects (Administrative, Pedagogy, Motivational and Financial Aspects) of the selected respondents.
IV. OBJECTIVES OF THE STUDY
2. To know the different schemes(NLM, TLC, EPA, DPEP, SSA and NAEP) adopted by Andhra Pradesh to eradicate illiteracy through total literacy campaign.
3. To know the administrative difficulties(NLM, TLC, EPA, DPEP, SSA and NAEP) in implementing the total literacy campaign.
4. Steps to be taken to strengthen(NLM, TLC, EPA, DPEP, SSA and NAEP) efforts of the government and other agencies in utilizing programme of total literacy campaign.
5. To suggest ways and means to make the programmes (NLM, TLC, EPA, DPEP, SSA and NAEP) of total literacy campaign successful.
3.4 Hypotheses of the study Based on the above objectives, the following hypotheses are formulated:
1. The samples do not differ significantly in their perception on administrative aspects in NLM in terms of persolla1variables (gender, age and experience).
2. The sample does not differ significantly in their perception on pedagogical aspects in NLM in terms of personal variables (gender, age and experience).
3. The sample does not differ significantly in their perception on pedagogical aspects in TLC in terms of personal variables (gender, age and experience).
4. The sample do not differ significantly their perception on motivational aspects in TLC in terms of personal variables (gender, age and experience).
5. The sample does not differ significantly in their perception on administrative aspects in EFA in terms of personal variables (gender, age and experience).
6. The sample does not differ significantly in their perception on pedagogical aspects in EFA in terms of personal variables (gender, age and experience).
7. The sample does not differ significantly in their perception on financial aspects in DPEP in terms of personal variables (gender, age and experience).
8. The sample does not differ significantly in their perception on administrative aspects in SSA in terms of personal variables (gender, age and experience).
9. The sample does not differ significantly in their perception on pedagogical aspects in SSA in terms of personal variables (gender, age and experience).
Research Methodology: Normative Survey method Sample:
744 samples are taken to implementation of total literacy campaign
1. Teachers of SSA, EFA, DPEP, etc.,100 members 2. Executive officers at district and mandal level. 100
members
3. Supervisors at district and mandal level. 100 members 4. Mandal Educational Officers. 100 members
5. M. L. O. 100 members
Tools and Techniques are used
The fallowing tools and techniques are used 1. Questionnaire
Sample and sample techniques:
Random sampling among the SSA, EFA, DPEP, Executive officers at district and MEOs
V. NEED FOR THE STUDY
For accelerating the pace of economic development of the country and for transforming the society, education of the masses is absolutely essential. Literacy alone could help the citizens to participate in the development programmes intelligently and effectively. Sweden's remarkable progress can be traced to the fact that compulsory literacy was introduced. Realising this fact, the Constitution of India preambles Universalisation of Elementary Education by 1961, but even at the end of 1995 the country remained far from this target. On the contrary even after five decades of Independence, the number of illiterates in India has increased
Hence, the universalisation of elementary education through formal as well as non-formal channels is felt to be inevitable. For a long period significant per cent of the adult population has been kept isolated from the fruits of education. About fifty per cent of the illiterates in the country belong to the most productive age group of 15-35 years. This is in fact distressing and largely responsible for the low level of the country's socio-economic development.
In a major study on the factors of success in literacy, All Hamadache and Daniel Martin (UNESCO 1086), identified three major factors for the success of the adult literacy programmes In the world. They are:
1. Political factors a) National commitment
b) The political and socio-economic framework
2. Technical Factors a) Public awareness b) Mobilization c) Planning
3. The four basic principles a) Functionality
VI. STATISTICAL ANALYSIS
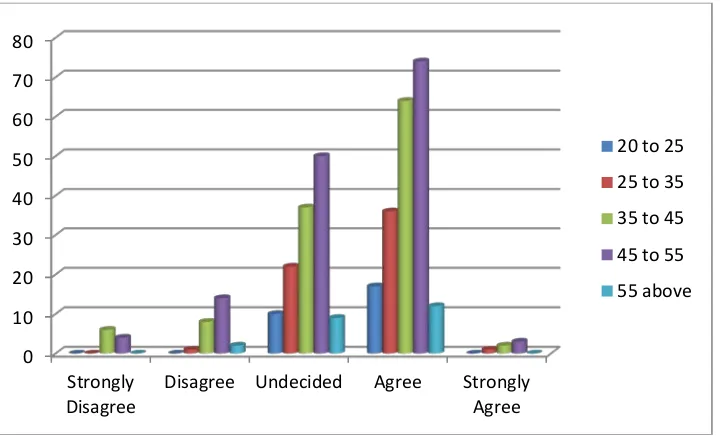
Table 1: Anova test between variables ‘Experience’ and ‘Whether total literacy campaign centers are aiming at 3R ie reading, writing and arithmetic’.
Disagree Undecided Agree
Strongly Agree
20 to 25 0 5 11 11 27
0.00% 18.50% 40.70% 40.70% 100.00%
25 to 35 1 0 8 51 60
1.70% 0.00% 13.30% 85.00% 100.00%
35 to 45 5 6 32 74 117
4.30% 5.10% 27.40% 63.20% 100.00%
45 to 55 2 11 45 87 145
1.40% 7.60% 31.00% 60.00% 100.00%
55 above
1 1 5 16 23
4.30% 4.30% 21.70% 69.60% 100.00%
9 23 101 239 372
2.40% 6.20% 27.20% 64.20% 100.00%
From the table it can be observed that respondents with age between 20 to 25 years 18.5% are undecided, 40.7% agree and 40.7% strongly agree with the argument. Respondents of age between 25 to 35 years 1.7% disagree, 13.3% agree and 85% strongly agree with the argument. Respondents of age between 35 to 45 years 4.3% disagree, 5.1% are undecided, 27.4% agree and
63.2% strongly agree with the argument. Respondents of age between 45 to 55 years 1.4% disagree, 7.6% are undecided, 31% agree and 60% strongly agree with the argument. Respondents of age with 55 above 4.3% disagree, 4.3% are undecided, 21.7% agree and 69.6% strongly agree with the argument.
ANOVA test has been conducted between the variables ‘Age’ and ‘Whether total literacy campaign centers are aiming at 3R ie reading, writing and arithmetic’ and the results are tabulated below
0 10 20 30 40 50 60 70 80 90
20 to 25
years 25 to 35Years 35 to 45 45 to 55Years 55 Yearsabove
Disagree Undecided Agree
[image:4.612.124.490.429.626.2]Sum of Squares df
Mean
Square F Sig.
B1 Between Groups
7.815 4 1.954 3.88 0.004
Within Groups
184.798 367 0.504
Total 192.613 371
[image:5.612.138.477.57.153.2]
From the table it can be observed that the calculated p value is 0.004 at 5% level of significance. Since the p value is less than 0.05 null hypotheses can be rejected. So there is a significant difference between the views of the respondents according to their age.
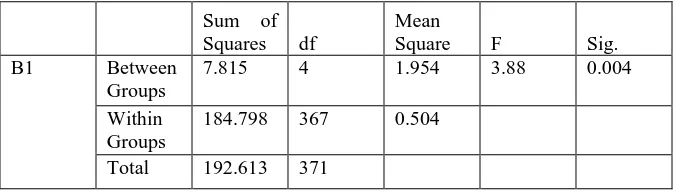
Table 2: Anova test between variables ‘Age’ and ‘Under article 45 of the constitution facilitated free and compulsory education, Universalization of primary education’.
Strongly
Disagree Disagree Undecided Agree
Strongly Agree
20 to 25 1 6 6 13 1 27
3.70% 22.20% 22.20% 48.10% 3.70% 100.00%
25 to 35 4 22 12 21 1 60
6.70% 36.70% 20.00% 35.00% 1.70% 100.00%
35 to 45 11 29 39 35 3 117
9.40% 24.80% 33.30% 29.90% 2.60% 100.00%
45 to 55 11 37 30 59 8 145
7.60% 25.50% 20.70% 40.70% 5.50% 100.00%
55 above
0 2 7 13 1 23
0.00% 8.70% 30.40% 56.50% 4.30% 100.00%
27 96 94 141 14 372
7.30% 25.80% 25.30% 37.90% 3.80% 100.00%
From the table it can be observed that respondents with age between 20 to 25 years 3.7% strongly disagree, 22.2% disagree, 22.2% undecided, 48.1% agree and 3.7% strongly agree with the argument. Respondents of age between 25 to 35 years 6.7% strongly disagree, 36.7% disagree, 20% undecided, 35% agree and 1.7% strongly agrees with the argument. Respondents of age between 35 to 45 years 9.4% strongly disagree, 24.8% disagree,
ANOVA test has been conducted between the variables ‘Age’ and ‘Under article 45 of the constitution facilitated free and compulsory education, Universalization of primary education’ and the results are tabulated below
Sum of
Squares df
Mean
Square F Sig.
Between Groups
11.629 4 2.907 2.747 0.028
Within Groups
388.4 367 1.058
Total 400.03 371
[image:6.612.129.487.58.273.2]From the table it can be observed that the calculated p value is 0.028 at 5% level of significance. Since the p value is less than 0.05 null hypotheses can be rejected. So there is a significant difference between the views of the respondents according to their age.
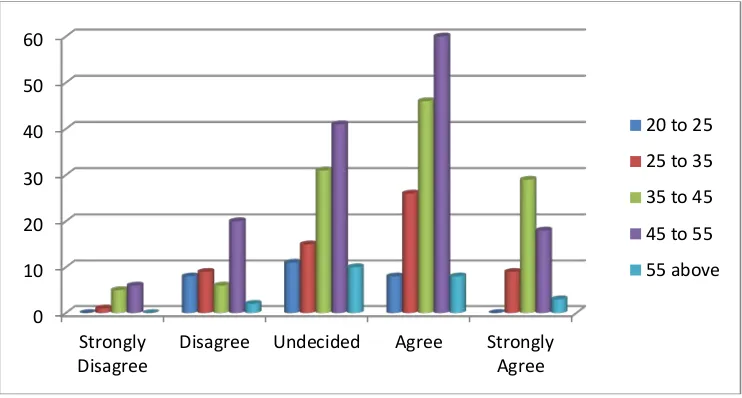
Table 3: Anova test between variables ‘Age’ and ‘Skills for the lively hood in total literacy campaign centers should also be properly planed’.
Strongly
Disagree Disagree Undecided Agree
Strongly Agree
20 to 25 0 8 11 8 0 27
0.00% 29.60% 40.70% 29.60% 0.00% 100.00%
25 to 35 1 9 15 26 9 60
1.70% 15.00% 25.00% 43.30% 15.00% 100.00%
35 to 45 5 6 31 46 29 117
4.30% 5.10% 26.50% 39.30% 24.80% 100.00%
45 to 55 6 20 41 60 18 145
4.10% 13.80% 28.30% 41.40% 12.40% 100.00%
55 above
0 2 10 8 3 23
0.00% 8.70% 43.50% 34.80% 13.00% 100.00%
12 45 108 148 59 372
3.20% 12.10% 29.00% 39.80% 15.90% 100.00%
0 10 20 30 40 50 60
Strongly
Disagree Disagree Undecided Agree StronglyAgree
From the table it can be observed that respondents with age between 20 to 25 years 29.6% disagree, 40.7% undecided and 29.6% agree with the argument. Respondents of age between 25 to 35 years 1.7% strongly disagree, 15% disagree, 25% undecided, 43.3% agree and 15% strongly agrees with the argument. Respondents of age between 35 to 45 years 4.3% strongly disagree, 5.1% disagree, 26.5% undecided, 39.3% agree and
24.8% strongly agree with the argument. Respondents of age between 45 to 55 years 4.1% strongly disagree, 13.8% disagree, 28.3% undecided, 41.4% agree and 12.4% strongly agree with the argument. Respondents of age with 55 above 8.7% disagree, 43.5% undecided, 34.8% agree and 13% strongly agree with the argument.
ANOVA test has been conducted between the variables ‘Age’ and ‘Skills for the lively hood in total literacy campaign centers should also be properly planed’ and the results are tabulated below
Sum of
Squares df
Mean
Square F Sig.
Between Groups
14.522 4 3.63 3.72 0.006
Within Groups
358.153 367 0.976
Total 372.675 371
[image:7.612.121.492.149.348.2]
From the table it can be observed that the calculated p value is 0.006 at 5% level of significance. Since the p value is less than 0.05 null hypotheses can be rejected. So there is a significant difference between the views of the respondents according to their age.
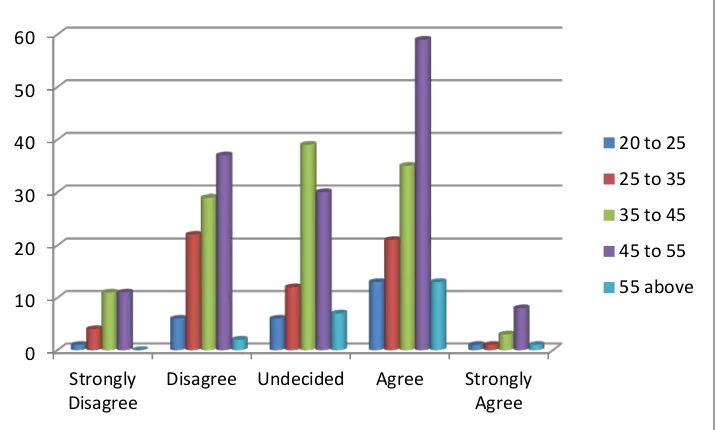
Table 4: Anova test between variables ‘Age’ and ‘To improve total literacy campaign Sarva Siksha Abiyan (SSA) was launched by the Government of India’.
Strongly
Disagree Disagree Undecided Agree
Strongly Agree
20 to 25 0 0 10 17 0 27
0.00% 0.00% 37.00% 63.00% 0.00% 100.00%
25 to 35 0 1 22 36 1 60
0.00% 1.70% 36.70% 60.00% 1.70% 100.00%
35 to 45 6 8 37 64 2 117
5.10% 6.80% 31.60% 54.70% 1.70% 100.00%
45 to 55 4 14 50 74 3 145
2.80% 9.70% 34.50% 51.00% 2.10% 100.00%
0 2 9 12 0 23
0 10 20 30 40 50 60
Strongly
Disagree Disagree Undecided Agree StronglyAgree
55 above
0.00% 8.70% 39.10% 52.20% 0.00% 100.00%
10 25 128 203 6 372
2.70% 6.70% 34.40% 54.60% 1.60% 100.00%
From the table it can be observed that respondents with age between 20 to 25 years 37% undecided and 63% agree with the argument. Respondents of age between 25 to 35 years 1.7% disagree, 36.7% undecided, and 60% agree and 1.7% strongly agrees with the argument. Respondents of age between 35 to 45 years 5.1% strongly disagree, 6.8% disagree, 31.6% undecided,
54.7% agree and 1.7% strongly agrees with the argument. Respondents of age between 45 to 55 years 2.8% strongly disagree, 9.7% disagree, 34.5% undecided, 51% agree and 2.1% strongly agree with the argument. Respondents of age with 55 above 8.7% disagree, 39.1% undecided and 52.2% agree with the argument.
ANOVA test has been conducted between the variables ‘Age’ and ‘Skills for the lively hood in total literacy campaign centers should also be properly planed’ and the results are tabulated below
Sum of
Squares df
Mean
Square F Sig.
Between Groups
3.072 4 0.768 1.334 0.257
Within Groups
211.239 367 0.576
Total 214.312 371
[image:8.612.130.490.204.422.2]
From the table it can be observed that the calculated p value is 0.257 at 5% level of significance. Since the p value is greater than 0.05 null hypotheses can be accepted. So there is no significant difference between the views of the respondents according to their age.
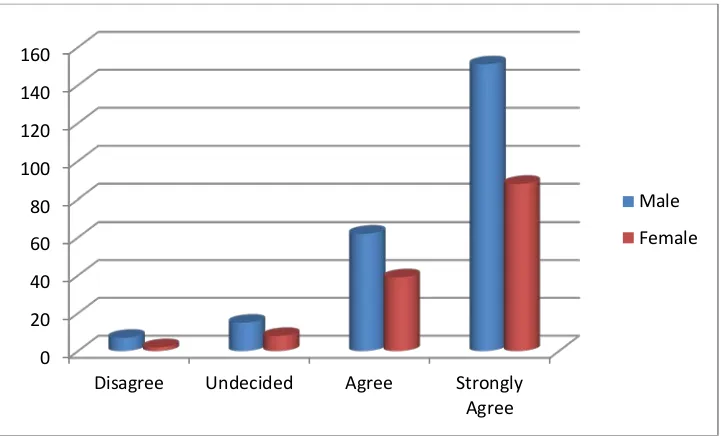
Table 5: Chi square test between variables ‘Gender’ and ‘Whether total literacy campaign centers are aiming at 3R ie reading, writing and arithmetic’.
Disagree Undecided Agree
Strongly Agree
Male 7 15 62 151 235
3.00% 6.40% 26.40% 64.30% 100.00%
Female 2 8 39 88 137
0 10 20 30 40 50 60 70 80
Strongly
Disagree Disagree Undecided Agree StronglyAgree
9 23 101 239 372 2.40% 6.20% 27.20% 64.20% 100.00%
From the table it can be observed that among males 3% disagree, 6.4% undecided, 26.4% agrees and 64.3% strongly agree with the argument. Among females 1.5% disagree, 5.8% undecided, 28.5% agree and 64.2% strongly agree with the argument.
Chi square test has been conducted between the variables ‘Gender’ and ‘Whether total literacy campaign centers are aiming at 3R ie reading, writing and arithmetic’ and the results are tabulated below
Value df
Asymp. Sig. (2-sided) Pearson
Chi-Square
1.005a 3 0.8
[image:9.612.127.488.134.352.2]The calculated chi square value is 1.005 with 3 degrees of freedom and at 5% level of significance. Since the calculated value is less the table value (7.81) null hypothesis is accepted. So there is no significant difference between the views of the respondents according to the gender.
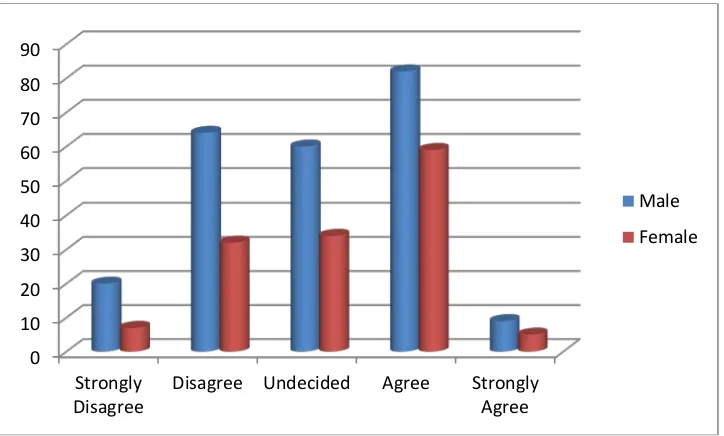
Table 6: Chi square test between variables ‘Gender’ and ‘Under article 45 of the constitution facilitated free and compulsory education, Universalization of primary education’.
Strongly
Disagree Disagree Undecided Agree
Strongly Agree
Male 20 64 60 82 9 235
8.50% 27.20% 25.50% 34.90% 3.80% 100.00%
Female 7 32 34 59 5 137
5.10% 23.40% 24.80% 43.10% 3.60% 100.00%
27 96 94 141 14 372
7.30% 25.80% 25.30% 37.90% 3.80% 100.00%
From the table it can be observed that among males 8.5% strongly disagree, 27.2% disagree, 25.5% undecided, 34.9% agree and 3.8% strongly disagree with the argument. Among females 5.1% strongly disagree, 23.4% disagree, 24.8% undecided, 43.1% agree and 3.6% strongly agree with the argument.
0 20 40 60 80 100 120 140 160
Disagree Undecided Agree Strongly Agree
Chi square test has been conducted between the variables ‘Gender’ and ‘Under article 45 of the constitution facilitated free and compulsory education, Universalization of primary education’ and the results are tabulated below
Value df
Asymp. Sig. (2-sided) Pearson
Chi-Square
3.433a 4 0.488
[image:10.612.127.489.56.274.2]The calculated chi square value is 3.433 with 4 degrees of freedom and at 5% level of significance. Since the calculated value is less the table value (9.49) null hypothesis is accepted. So there is no significant difference between the views of the respondents according to the gender.
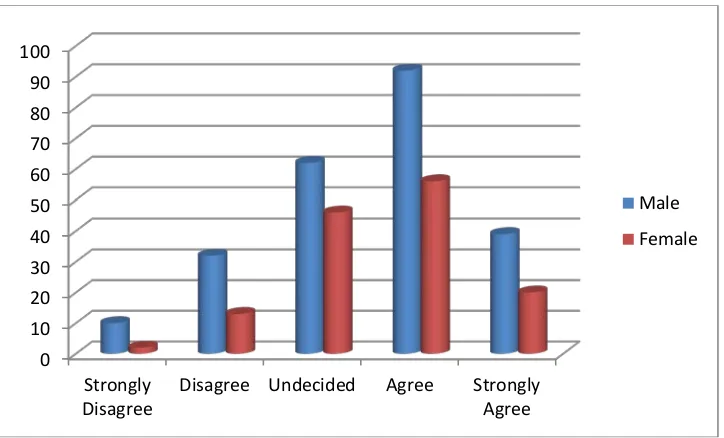
Table 7: Chi square test between variables ‘Gender’ and ‘Skills for the lively hood in total literacy campaign centers should also be properly planed’.
Strongly
Disagree Disagree Undecided Agree
Strongly Agree
Male 10 32 62 92 39 235
4.30% 13.60% 26.40% 39.10% 16.60% 100.00%
Female 2 13 46 56 20 137
1.50% 9.50% 33.60% 40.90% 14.60% 100.00%
12 45 108 148 59 372
3.20% 12.10% 29.00% 39.80% 15.90% 100.00%
From the table it can be observed that among males 4.3% strongly disagree, 13.6% disagree, 26.4% undecided, 39.1% agree and 16.6% strongly disagree with the argument. Among females 1.5% strongly disagrees, 9.5% disagree, 33.6% undecided, 40.9% agree and 14.6% strongly agree with the argument.
0 10 20 30 40 50 60 70 80 90
Strongly
Disagree Disagree Undecided Agree StronglyAgree
Chi square test has been conducted between the variables ‘Gender’ and ‘Skills for the lively hood in total literacy campaign centers should also be properly planed’ and the results are tabulated below
Value df
Asymp. Sig. (2-sided) Pearson
Chi-Square
5.141a 4 0.273
[image:11.612.127.489.55.274.2]The calculated chi square value is 5.141 with 4 degrees of freedom and at 5% level of significance. Since the calculated value is less the table value (9.49) null hypothesis is accepted. So there is no significant difference between the views of the respondents according to the gender.
Table 8: Chi square test between variables ‘Gender’ and ‘To improve total literacy campaign Sarva Siksha Abiyan (SSA) was launched by the Government of India’.
Strongly
Disagree Disagree Undecided Agree
Strongly Agree
Male 7 15 87 122 4 235
3.00% 6.40% 37.00% 51.90% 1.70% 100.00%
Female 3 10 41 81 2 137
2.20% 7.30% 29.90% 59.10% 1.50% 100.00%
10 25 128 203 6 372
2.70% 6.70% 34.40% 54.60% 1.60% 100.00%
From the table it can be observed that among males 3% strongly disagree, 6.4% disagree, 37% undecided, 51.9% agree and 1.7% strongly disagrees with the argument. Among females 2.2% strongly disagrees, 7.3% disagree, 29.9% undecided, 59.1% agree and 1.5% strongly agrees with the argument.
0 10 20 30 40 50 60 70 80 90 100
Strongly
Disagree Disagree Undecided Agree StronglyAgree
Chi square test has been conducted between the variables ‘Gender’ and ‘To improve total literacy campaign Sarva Siksha Abiyan (SSA) was launched by the Government of India’ and the results are tabulated below
Value df
Asymp. Sig. (2-sided) Pearson
Chi-Square
2.430a 4 0.657
The calculated chi square value is 2.43 with 4 degrees of freedom and at 5% level of significance. Since the calculated value is less the table value (9.49) null hypothesis is accepted. So there is no significant difference between the views of the respondents according to the gender.
VII. FINDINGS AND SUGGESTIONS
1.
Factors hindering total literacy campaign can be nullified provided the actual implementation by teacher’s executive officers, supervisors all concern the implementation of the programme with genuine and committed.2.
All scheme implemented should be clearly under stood by the concerned persons.3.
Administrative difficulties of finance, supervision time check should be done.4.
With total commitment and realize the objectives of total literacy campaign should be taken up very seriously.5.
Total literacy campaign adopted by the A.P will beprovided successful systematic planning and administration should be done.
REFERENCES
[1] ABDAR. R (1966) : An inquiry into the problems of motivation in Adult literacy ; Delhi Jamia Milla Islamia University, Delhi.
[2] AGARWAL ARUNA (1988) : “A study of relationship between motivation and personality needs of adult learners attending NAEP centres of Agra”, Ph. D (Psy) Agra University.
[3] Agnihotri, S.K. (1974) Evaluation of the programme of Adult Education in operation under pilot plan in wardha District.
[4] Desai Rama Patel, V.B. and Shah S.G. (1982) an appraisal of the implementation of the National Adult Education programme in the State of Gujarat – Centre for training and research in Adult Education Gujarat Vidyapeeth, Ahmadabad.
[5] Devadas, R. (1979) Whither the National Adult Education Programme, Indian journal of Adult Education, October, November, 1979.
[6] Hargopal, G. & Ravindar. A. (1980) Perceptions of the key functionaries about N.A.E.P. a critical appraisal. Indian Journal of Adult Education, Vol-41, and No.5 May 1980.
[7] Harvey, J.R. (1978) Personal and motivational characteristics of Adult learners as related to Houle’s Typology, Ph.D. Dissertation, Ohio State University U.S.A. (Dissertation Abstracts International), 39, 4, 1992-3-A October 1978).
AUTHORS
First Author – Dr. Smt. M. Esther Suneela, Research Director, Principal, A L College Of Education, Guntur
Second Author – Mr. G. Yenoku, Researcher, Principal, Repalle Chrisitan College Of Education, Repalle, Guntur, Dist
0 20 40 60 80 100 120 140