M E T H O D O L O G Y
Open Access
Preference-adaptive randomization in
comparative effectiveness studies
Benjamin French
1*†, Dylan S Small
2†, Julie Novak
2, Kathryn A Saulsgiver
1, Michael O Harhay
1,
David A Asch
3,4,5,6, Kevin G Volpp
3,4,5,6and Scott D Halpern
1,3,5Abstract
Background: Determination of comparative effectiveness in a randomized controlled trial requires consideration of an intervention’s comparative uptake (or acceptance) among randomized participants and the intervention’s comparative efficacy among participants who use their assigned intervention. If acceptance differs across
interventions, then simple randomization of participants can result in post-randomization losses that introduce bias and limit statistical power.
Methods: We develop a novel preference-adaptive randomization procedure in which the allocation probabilities are updated based on the inverse of the relative acceptance rates among randomized participants in each arm. In simulation studies, we determine the optimal frequency with which to update the allocation probabilities based on the number of participants randomized. We illustrate the development and application of preference-adaptive randomization using a randomized controlled trial comparing the effectiveness of different financial incentive structures on prolonged smoking cessation.
Results: Simulation studies indicated that preference-adaptive randomization performed best with frequent updating, accommodated differences in acceptance across arms, and performed well even if the initial values for the allocation probabilities were not equal to their true values. Updating the allocation probabilities after randomizing each participant minimized imbalances in the number of accepting participants across arms over time. In the smoking cessation trial, unexpectedly large differences in acceptance among arms required us to limit the allocation of participants to less acceptable interventions. Nonetheless, the procedure achieved equal numbers of accepting participants in the more acceptable arms, and balanced the characteristics of participants across assigned interventions.
Conclusions: Preference-adaptive randomization, coupled with analysis methods based on instrumental variables, can enhance the validity and generalizability of comparative effectiveness studies. In particular, preference-adaptive randomization augments statistical power by maintaining balanced sample sizes in efficacy analyses, while retaining the ability of randomization to balance covariates across arms in effectiveness analyses.
Trial registration: ClinicalTrials.gov, NCT01526265; 31 January 2012
Keywords: Adaptive design, Adherence, Comparative effectiveness research, Efficacy, Instrumental variables
*Correspondence: [email protected]
†Equal contributors
1Department of Biostatistics and Epidemiology, University of Pennsylvania, 423 Guardian Drive, Philadelphia, PA 19104, USA
Full list of author information is available at the end of the article
Background
Health-care providers, employers and insurers want to promote healthy behaviors, including medication adher-ence, tobacco cessation, weight loss and exercise [1-5]. The comparative effectiveness of any behavioral interven-tion depends on both its comparative acceptance (i.e., the probability that people assigned to an intervention will use it) and its comparative efficacy (i.e., how well the intervention works among people who use it) [6,7]:
Effectiveness :=Efficacy|Acceptance×Acceptance. (1)
Therefore, it is essential to disentangle acceptance and efficacy to determine whether an intervention’s effec-tiveness is limited by low acceptance or low efficacy [8]. Unfortunately, disentangling acceptance and efficacy within randomized controlled trials is challenging. Simple randomization (or complete randomization) of partici-pants to different interventions ensures that measures of effectiveness are not confounded by differences in the characteristics of individuals to whom the interventions are offered [9]. However, random assignment to interven-tions that yield different levels of acceptance can induce post-randomization losses that introduce bias and limit statistical power in standard analyses of the interventions’ comparative efficacy [10].
We recently designed a randomized controlled trial to compare the effectiveness of different financial incentive structures on prolonged smoking cessation (clinicaltri-als.gov identifier: NCT01526265). Some of the financial incentive structures required participants to put some of their own money at risk, which might naturally be less attractive to participants than incentives with only upside potential. To promote the goals of achieving equal num-bers of accepting participants in each arm and balancing the characteristics of participants across assigned inter-ventions, we adapted the allocation probabilities through-out the enrollment period based on the inverse of the relative acceptance rates among randomized participants in each arm. Thus, our approach increased the likelihood that a participant was randomized to an intervention that had been rejected by previously randomized participants. Our preference-adaptive randomization procedure was intended to augment the statistical power of an instru-mental variable analysis of efficacy [11], while reducing the potential for participant characteristics to bias an intention-to-treat analysis of effectiveness.
A large body of statistical literature has focused on adaptive designs for randomized trials. Brown and col-leagues [12] conceptualized three types of adaptation: adaptive sequencing, which refers to the design of a new trial; adaptive designs, which refers to the conduct of an ongoing trial; and adaptive interventions, which refer
to intervention experience of a study participant. Adap-tive designs include covariate-adapAdap-tive randomization, in which allocation probabilities vary to minimize covariate imbalances across arms, and response-adaptive random-ization, which uses the success or failure results on previ-ously randomized participants in each arm to modify the allocation probabilities [13-15]. For example, in a random-ized play-the-winner design, a participant is more likely to be randomized to an intervention deemed more suc-cessful based on the outcomes observed for previously randomized participants [16,17].
Our preference-adaptive randomization procedure shares elements of covariate- and response-adaptive randomization [18], but is distinct from each. On one hand, our randomization procedure could be viewed as response-adaptive. The acceptance analysis compares the relative proportions of participants who accept their assigned intervention. Acceptance among previously randomized participants is the response upon which the allocation probabilities are updated. On the other hand, our procedure could be viewed as a unique case of covariate-adaptive randomization. The efficacy analysis compares the relative rates of sustained smoking cessa-tion among those who accept their assigned intervencessa-tion. In the efficacy analysis, acceptance is conditioned as a special type of covariate. The special role of acceptance as both an effect and a cause in a comparative effectiveness study is similar to the role of the amount of treatment taken in a randomized encouragement design [19,20].
In this paper, we introduce a novel adaptive random-ization procedure in which the allocation probabilities are updated based on the relative acceptance rates among randomized participants. Our goal is to elucidate the sta-tistical and practical properties of adaptive randomization procedures, using comparative effectiveness studies as a motivating framework. In simulation studies, we deter-mine the optimal frequency with which to update the allo-cation probabilities based on the number of participants randomized. We illustrate the development and applica-tion of our preference-adaptive randomizaapplica-tion procedure, and demonstrate the benefits and challenges of an adap-tive design, using the smoking cessation trial introduced above. We discuss instrumental variable methods that can be used to analyze the resultant efficacy data.
Methods
each stratum, with the constraint that the sum of the probabilities within each stratum is 1.
Let πijk denote the allocation probability for arm (or intervention) j = 1,. . .,J within stratum i = 1,. . .,I at update k = 1,. . .,Ki. The total number of updates Ki could vary across strata due to differences in sample sizes. Letnijk denote the number of participants in
stra-tumi who have accepted interventionj up to updatek,
withni·k = jnijk. The allocation probability for arm j
within stratumiat updatek can be calculated based on
the accrued relative acceptance rates:
πijk =πijk−1×
ni·k nijk ×
1 si·k
, (2)
for whichsi·k = ni·k ×jπijk−1/nijk denotes a scaling factor to ensure thatjπijk = 1. Note that Equation (2) reduces to:
πijk =πijk−1×
1 nijk ×
1
jπijk−1/nijk
. (3)
Anticipated acceptance rates can be used to select the initial allocation probabilitiesπij0, allowing for anticipated
differences in acceptance within and across strata. In our smoking cessation trial, we assumed that the initial proba-bilities were constant across strata, but varied across arms within a stratum:π1j0=π2j0= · · · =πIj0∀j.
To implement our procedure, one must choose the fre-quency with which to update the allocation probabilities. Less frequent updating might not be responsive to dif-ferential acceptance rates across the interventions. More frequent updating might overcompensate for chance imbalances. Furthermore, it could require real-time data collection and analysis, which might not be feasible. In the following section, we use simulated data to determine the optimal frequency with which to update the allocation probabilities.
Simulation studies
We performed simulation studies to determine the optimal frequency with which to update the allocation probabilities based on the number of participants ran-domized. The goal was to identify the updating interval that minimized imbalances in the numbers of accept-ing participants across arms over time. We hypothesized that insufficiently frequent updating would enable cer-tain arms to grow disproportionately before change was enforced. Conversely, we hypothesized that overly fre-quent updating would be inefficient because, particularly early in the study, the procedure would overreact to variable acceptance rates, for which the denominators represented small samples of participants.
Parameters
We designed the simulation studies to emulate our smok-ing cessation trial: a five-arm trial with a target sample size of 2,185 accepting participants. For simplicity, we did not assume stratified randomization. We considered updating intervals of 1, 3, 5, 10 and 20 participants. For example, with an updating interval of 3 participants, the allocation probabilities were updated after 3 participants were ran-domized since the last update. We defined the efficiency of an updating interval based on the sum of the squared deviations from an allocation probability of 0.2:
e(l)= ⎡ ⎣N
n=n0
5
j=1
p(l)jn −0.2 2 ⎤ ⎦
−1
, (4)
for whichp(l)jn denotes the proportion of participants who
have accepted interventionjamong all participants who
have accepted their assigned intervention at the time at which a total ofn=n0,. . .,Nparticipants have accepted
their assigned intervention, under a randomization
pro-cedure with an updating interval of l participants. We
selected n0 = 100 as a burn-in time, so that the
effi-ciency was not influenced by early time periods during which the proportions in each arm were unstable. We selectedN= 2,185 as the total number of participants who accept their assigned intervention. The efficiency mea-sure in Equation (4) quantified the average imbalance in acceptance across arms over time, and is analogous to the efficiency measure proposed by Chen [21] for assessing sequential randomization schemes designed to balance the number of participants across arms. We defined the relative efficiency as the efficiency of an updating inter-val oflparticipants relative to that of an updating interval of 20 participants, i.e.,e(l)/e(20),l=1, 3, 5, 10. A relative efficiency>1 indicated increased efficiency.
We compared the efficiency of different updating inter-vals across a range of scenarios, in which we varied three primary factors:
1. Acceptance probability for the most accepted intervention: The true acceptance probability for the arm with the largest acceptance probability was 0.2, 0.4, 0.5, 0.6 or 0.8.
2. Acceptance probabilities for less accepted
3. Initial values for acceptance probabilities: The initial values for the acceptance probabilities:
(a) Correct: Were equal to the true acceptance probabilities.
(b) More extreme: Were unequal to the true acceptance probabilities, with the initial value for the arm with the largest acceptance probability set to 1.2 times its true value and the remaining initial values set to 0.8 times their true values.
(c) Less extreme: Were unequal to the true acceptance probabilities, with the initial value for the arm with the largest acceptance probability set to 0.8 times its true value and the remaining initial values set to 1.2 times their true values.
The initial allocation probabilities were proportional to the inverse of the initial acceptance probabilities.
We performed 500 iterations for each of the 30 scenar-ios in the full 5×2×3 factorial design. Both overall and for each of the three primary factors, we summarized the results by calculating an average relative efficiency (ARE); for each scenario, we calculated the ARE for that scenario and then averaged the AREs across scenarios. Simulations were performed using R 3.1.0 (R Development Core Team, Vienna, Austria), including the e1071 extension package.
Results
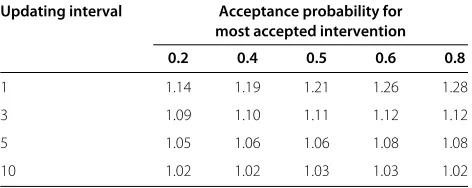
[image:4.595.304.536.611.705.2]Across all 30 scenarios in the full 5×2×3 factorial design, the average ARE for an updating interval of 1, 3, 5 and 10 participants (compared to an updating interval of 20 par-ticipants) was 1.21, 1.11, 1.08 and 1.03, respectively, which indicated that, on average, more frequent updating led to increased efficiency. On average, an updating interval of 1 participant was 21% more efficient than an updating interval of 20 participants. Table 1 provides the average ARE according to the acceptance probability for the most accepted intervention. Note that a lower acceptance prob-ability for the most accepted intervention corresponded
Table 1 Average efficiency relative to an updating interval of 20 participants according to the acceptance probability for the most accepted intervention
Updating interval Acceptance probability for most accepted intervention 0.2 0.4 0.5 0.6 0.8
1 1.14 1.19 1.21 1.26 1.28
3 1.09 1.10 1.11 1.12 1.12
5 1.05 1.06 1.06 1.08 1.08
10 1.02 1.02 1.03 1.03 1.02
to lower acceptance probabilities among all interventions. The efficiency gain of more frequent updating was lower for lower values of the acceptance probabilities. If accep-tance was lower, then more frequent updating was more sensitive to individual responses and therefore led to larger imbalances in the number of accepting participants across arms over time.
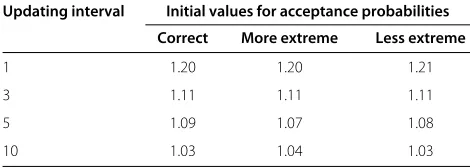
Table 2 provides the average ARE according to the distribution of the acceptance probabilities for the less accepted interventions. The efficiency gain of more fre-quent updating was higher for an uneven distribution, which indicated that more frequent updating was more efficient when there were more substantial differences among acceptance probabilities. Table 3 provides the aver-age ARE according to the initial values for the acceptance probabilities. There were no substantial differences in the average ARE when the initial values were correct or incor-rect, which indicated that the randomization procedure recovered from incorrect initial values.
Results were similar (within 1% to 2%) when no burn-in time was used to calculate the efficiencies.
Summary
Our preference-adaptive randomization procedure – based on the inverse of the relative acceptance rates among randomized participants in each arm – performed best with frequent updating, accommodated differences in acceptance across interventions, and was robust to incorrect initial values. An updating interval of 1 partici-pant performed well across all scenarios considered.
Illustration Background
[image:4.595.56.292.638.732.2]We designed a randomized controlled trial of smoking cessation interventions among CVS/Caremark employees and their friends and family members. The goal of the study was to compare usual care (e.g., access to online information on smoking cessation, access to phone-based
Table 2 Average efficiency relative to an updating interval of 20 participants according to the distribution of the acceptance probabilities for the less accepted interventions
Updating interval Acceptance probabilities for less accepted interventions
Even Uneven
1 1.16 1.26
3 1.08 1.15
5 1.05 1.11
10 1.02 1.05
Table 3 Average efficiency relative to an updating interval of 20 participants according to the initial values for the acceptance probabilities
Updating interval Initial values for acceptance probabilities Correct More extreme Less extreme
1 1.20 1.20 1.21
3 1.11 1.11 1.11
5 1.09 1.07 1.08
10 1.03 1.04 1.03
Correct: Equal to the true acceptance probabilities. More extreme: Unequal to the true acceptance probabilities, with the initial value for the arm with the largest acceptance probability set to 1.2 times its true value and the remaining initial values set to 0.8 times their true values. Less extreme: Unequal to the true acceptance probabilities, with the initial value for the arm with the largest acceptance probability set to 0.8 times its true value and the remaining initial values set to 1.2 times their true values.
cessation assistance and nicotine replacement therapy) with usual care plus one of four financial incentive struc-tures likely to vary in their appeal to participants. Partic-ipants in the individual reward arm received a financial reward if they achieved sustained abstinence. In the col-laborative reward arm, a participant was assigned to a group of six participants; a participant’s financial reward for sustained abstinence was increased as the abstinence rate among group members increased. Participants in the individual deposit arm deposited money at the beginning of the study; if they achieved sustained abstinence, then they received their deposit plus a financial reward. In the competitive deposit arm, a participant was assigned to a group of six participants; deposits were redistributed among only those group members who achieved sustained abstinence.
Methods
The target sample size was 2,185 smokers (437 per arm) who would accept their assigned intervention. Over a 9-month enrollment period, potential participants were recruited via a web-based research portal [22]. Partici-pants were told that the smoking cessation interventions involved the use of financial incentives, but specific details of the interventions were not provided. Once random-ized, participants received a detailed description of their assigned intervention. We defined the acceptance rate as the proportion of participants randomized to each of the four incentive arms who, after learning the details of the incentive structure to which they were assigned, agreed to the contract. In the usual care arm, acceptance was assumed for everyone because no new intervention was offered. Participants who accepted the collaborative reward or competitive deposit intervention were subse-quently assigned to a group of six participants. Because group assignment occurred after acceptance, it was not necessary to adjust for group effects when calculating
acceptance rates. All participants provided informed con-sent. The University of Pennsylvania Institutional Review Board approved the study protocol.
We stratified the randomization by two dichotomous variables: whether or not participants had full health-care benefits through CVS/Caremark; and annual house-hold income above or below $60,000. Initial allocation probabilities across strata were: usual care, 0.20; individ-ual reward, 0.15; collaborative reward, 0.15; individindivid-ual deposit, 0.25; and competitive deposit, 0.25. This unbal-anced randomization was intended to account for hypoth-esized differences in acceptance rates across arms; in particular, we predicted that participants would be less likely to accept deposit contracts because those require participants to put up some of their own money at the start, and risk not getting it back if they do not succeed in quitting. To further promote the goals of achieving equal numbers of accepting participants in each arm and bal-ancing the characteristics of participants across assigned interventions, we also adapted the allocation probabil-ities within strata throughout the enrollment period. Although our simulation studies indicated that an updat-ing interval of 1 participant performed well, we used an updating interval of 3 participants to reduce the com-plexity of the required programming in the web-based portal.
Results
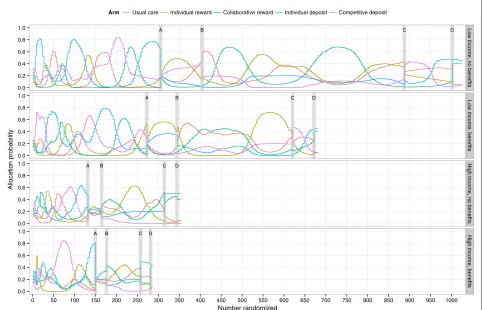
The preference-adaptive randomization procedure we implemented resulted in marked variations in the propor-tions of participants allocated to the different study arms over time (Figure 1). For example, in the most populous of the four strata (i.e., participants with annual household incomes less than $60,000 who also lacked CVS/Caremark benefits, or low income, no benefits), the percentage of participants allocated to the individual deposit arm varied from<5% to>80% during the initial enrollment period. During this same time, allocation probabilities for each of the arms exceeded 50% at one or more points in time, and each dropped to<15% at other times.
A B C D
A B C D
A B C D
A B C D
0.0 0.2 0.4 0.6 0.8 1.0
0.0 0.2 0.4 0.6 0.8 1.0
0.0 0.2 0.4 0.6 0.8 1.0
0.0 0.2 0.4 0.6 0.8 1.0
Low income, no benefits
Low income, benefits
High income, no benefits
High income, benefits
0 50 100 150 200 250 300 350 400 450 500 550 600 650 700 750 800 850 900 950 1000 Number randomized
Allocation probability
[image:6.595.57.540.92.402.2]Arm Usual care Individual reward Collaborative reward Individual deposit Competitive deposit
Figure 1Probability of being allocated to each incentive structure in each of the four strata over the enrollment period.A, B, C, and D indicate protocol changes in the randomization procedure. These changes were made to address observed disparities in acceptance rates. On 11 April 2012, we implemented a 60%/40% split between [usual care + individual reward + collaborative reward arms] and [individual deposit + competitive deposit arms] (A). On 25 April 2012, we changed to an 80%/20% split between the same two groups (B). On 14 September 2012, we changed to a 50%/50% split between the same two groups (C). On 26 September 2012, we retained this 50%/50% split, continued the adaptive randomization for the deposit arms, but among the 50% of participants randomized to the group containing the other three arms, we fixed the allocation probabilities for the usual care (15%), individual reward (15%) and collaborative reward (70%) arms to bolster assignment to the latter (D).
29 and 31 weeks into the study (denoted by B, C and D, respectively, in Figure 1).
Our preference-adaptive randomization procedure pro-duced balance in the numbers of accepting participants in the three arms that were reasonably well accepted by par-ticipants (i.e., usual care, individual reward and collabo-rative reward). Specifically, we achieved the target sample size of at least 437 participants in each of those arms, with negligible differences in the numbers of accepting partic-ipants among those arms. The procedure also success-fully balanced the characteristics of participants across assigned interventions. Indeed, of the more than 30 par-ticipant characteristics that we measured, none revealed an important imbalance across arms. Only one variable, ethnicity, was statistically unbalanced (P=0.042).
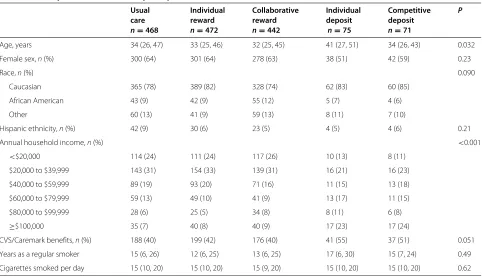
Balance across arms was not uniformly achieved when evaluating only participants who accepted their assigned intervention (Table 4). In particular, annual household income was highly imbalanced, with an
over-representation of high-income individuals in the individual deposit and competitive deposit arms (P<0.001). These results provide support for the concern that anal-yses based on participants who accepted their assigned intervention would be susceptible to selection effects. In the following section, we discuss instrumental variable methods that can address such selection effects.
Summary
Table 4 Participant characteristics by accepted intervention
Usual Individual Collaborative Individual Competitive P
care reward reward deposit deposit
n=468 n=472 n=442 n=75 n=71
Age, years 34 (26, 47) 33 (25, 46) 32 (25, 45) 41 (27, 51) 34 (26, 43) 0.032
Female sex,n(%) 300 (64) 301 (64) 278 (63) 38 (51) 42 (59) 0.23
Race,n(%) 0.090
Caucasian 365 (78) 389 (82) 328 (74) 62 (83) 60 (85)
African American 43 (9) 42 (9) 55 (12) 5 (7) 4 (6)
Other 60 (13) 41 (9) 59 (13) 8 (11) 7 (10)
Hispanic ethnicity,n(%) 42 (9) 30 (6) 23 (5) 4 (5) 4 (6) 0.21
Annual household income,n(%) <0.001
<$20,000 114 (24) 111 (24) 117 (26) 10 (13) 8 (11)
$20,000 to $39,999 143 (31) 154 (33) 139 (31) 16 (21) 16 (23)
$40,000 to $59,999 89 (19) 93 (20) 71 (16) 11 (15) 13 (18)
$60,000 to $79,999 59 (13) 49 (10) 41 (9) 13 (17) 11 (15)
$80,000 to $99,999 28 (6) 25 (5) 34 (8) 8 (11) 6 (8)
≥$100,000 35 (7) 40 (8) 40 (9) 17 (23) 17 (24)
CVS/Caremark benefits,n(%) 188 (40) 199 (42) 176 (40) 41 (55) 37 (51) 0.051
Years as a regular smoker 15 (6, 26) 12 (6, 25) 13 (6, 25) 17 (6, 30) 15 (7, 24) 0.49
Cigarettes smoked per day 15 (10, 20) 15 (10, 20) 15 (9, 20) 15 (10, 20) 15 (10, 20) 0.62
Summary statistics are median (25th, 75th percentile) unless otherwise noted asn(%).
achieved equal numbers of accepting participants in each arm, which will enhance the power of the efficacy anal-yses. Second, we achieved balance in the characteristics of participants across assigned interventions, which will reduce the potential for bias in the effectiveness analysis.
Estimation of treatment effects
In previous sections, we described the development and implementation of a preference-adaptive randomization procedure in comparative effectiveness studies, using a smoking cessation trial as an illustrative example. In this section, we outline an analysis plan to estimate accep-tance, efficacy and effectiveness; see Equation (1).
A standard intention-to-treat analysis is used to com-pare the treatments’ acceptance and effectiveness. For evaluating efficacy, a standard per-protocol analysis would compare the cessation rate among participants who accept
interventionjto those who receive the control (with or
without inclusion of those who were assigned interven-tionjbut declined it). However, the standard per-protocol analysis could be subject to selection bias if smokers who do not accept an incentive differ from those who do in ways that relate to their probabilities of quitting [23]. To address such selection effects, we model the ran-domization arm as an instrumental variable [11]. In the instrumental variable approach, the cessation rate of each intervention is adjusted for the percentage of participants
who accept their assigned intervention, thereby estimat-ing complier-averaged causal effects and attenuatestimat-ing the selection effects [24,25].
A key advantage of the instrumental variable approach over a standard per-protocol analysis is that the instru-mental variable approach uses the data on all random-ized participants, rather than merely those who accept their assigned intervention. Therefore, the instrumental variable approach adheres to the randomized trial prin-ciple that participants should be analyzed according to their randomization status, rather than according to their self-selected acceptance status. For the instrumental vari-able analysis, we will use a two-stage least squares linear probability model [26]. By using the preference-adaptive randomization procedure, which balances the number of accepting participants in each arm (or, in our application, the arms targeted for complete enrollment), we increase the power for the instrumental variable analysis.
Discussion
initial values. We applied our procedure to a randomized controlled trial to compare the effectiveness of different financial incentive structures on prolonged smoking ces-sation. The randomization procedure strengthened the trial in at least three ways. First, the procedure high-lighted the very low acceptance rates in certain arms because it resulted in correspondingly high allocation probabilities to those less acceptable arms. This enabled us to modify the randomization procedure during enroll-ment to preserve the possibility of fully enrolling more acceptable arms. Second, despite producing large vari-ations in the allocation probabilities within and across arms over time, the procedure yielded comparable num-bers of accepting participants across the three arms that we allowed to enroll appreciable numbers of participants, as well as across the two arms in which allocation was restricted when they were found to be less acceptable. This across-arm balance will maximize statistical power. Third, the procedure achieved balance in the observed characteristics of participants across assigned interven-tions, which increases confidence that unmeasured char-acteristics (e.g., motivation to quit) would also be balanced in the effectiveness analysis. Balance across arms was not uniformly achieved when evaluating only participants who accepted their assigned intervention, which provides support for the concern that such analyses would be sus-ceptible to selection effects. We discussed instrumental variable methods that can address such selection effects.
Although our preference-adaptive randomization pro-cedure performed well in simulation studies and in our application, there are limitations to the procedure’s appli-cation. First, our simulation studies indicated that an updating interval of 1 participant was optimal. In prac-tice, however, such frequent updating could require a sophisticated data-transmission and storage infrastruc-ture to perform rapid data collection and analysis. In our smoking cessation trial, we programmed the pro-cedure into a web-based portal that was used for data collection and randomization. Second, in our applica-tion the procedure required manual modificaapplica-tion due to lower-than-anticipated acceptance of less appealing arms, and correspondingly higher-than-anticipated auto-matic adjustments to the allocation probabilities for those arms. Left unchecked, those automatic adjustments would have hampered our ability to adequately enroll any of the arms. Future investigators might wish to program auto-matic modifications in their preference-adaptive random-ization procedure, similar to the modifications that we made manually (e.g., ceilings for the allocation probabil-ities). Third, our procedure could introduce confounding because allocation probabilities might depend on a com-plicated function of time (within strata). If the response also varies over time, then differences in the average response between arms could be confounded by temporal
trends. Therefore, when using this approach in practice, it might be prudent to adjust for temporal trends (within strata) using a flexible specification for calendar time, such as regression splines. Fourth, like many adaptive designs or interim analyses, preference-adaptive randomization might require that a member of the study team, such as a statistician, be unblinded during the trial. Unblinding requires careful consideration of the statistician’s role in the study’s conduct and reporting.
Our adaptive design, coupled with appropriate statisti-cal analysis methods, could be used to enhance the valid-ity and generalizabilvalid-ity of any comparative effectiveness study, blinded or unblinded, in which study participants choose to adhere to their assigned intervention [9,27]. Examples include large simple trials of vaccines or virtu-ally any pharmaceutical for which adherence might not be 100%, and, of course, trials of almost any behavioral inter-vention. However, application of our procedure requires consideration of two key features of adherence: the time lag between randomization and measurement of adher-ence; and whether adherence is assessed as a dichotomous variable, or as an adherence proportion or rate. In our smoking cessation trial, acceptance was measured imme-diately after randomization as being present or absent. By contrast, in drug trials, adherence might not be measured until several weeks or months after randomization, and might be measured as a proportion of pills taken among those prescribed.
Future research is needed to determine how a time lag in the assessment of adherence influences the efficiency of preference-adaptive randomization and the optimal updating interval. Conceivably, with more distant mea-surements of adherence, more frequent updating would be even more advantageous so that allocation probabili-ties can be modified as soon as adherence data become available. Research is also needed to determine how best to handle situations in which adherence is measured as a proportion. The easiest, but perhaps least precise, approach would be to set an adherence threshold, thereby converting adherence to a dichotomous variable. How-ever, more complex approaches, in which progressively large differences in observed adherence rates result in progressively large feedback influences on the allocation probabilities, could also be developed. The potential appli-cability of such strategies is quite broad, but requires fur-ther testing to ensure that balance would still be achieved across randomized arms.
Conclusions
ability of randomization to balance covariates across arms in effectiveness analyses. Preference-adaptive randomiza-tion, coupled with statistical analysis methods based on instrumental variables, could be used to enhance the validity and generalizability of any comparative effective-ness study in which study participants choose to adhere to their assigned intervention.
Abbreviation
ARE: Average relative efficiency.
Competing interests
The authors declare that they have no competing interests.
Authors’ contributions
SDH, BF, DSS, DAA and KGV conceived the study and participated in its design and coordination. JN performed the simulation studies under the direction of BF, DSS and SDH. KAS and MOH performed acquisition of data and data analysis. BF, DSS and SDH drafted the manuscript. All authors read and approved the final manuscript.
Acknowledgements
This work was supported by the National Institutes of Health (grant numbers R01-CA159932 and RC2-AG036592), which had no role in design; in the collection, analysis or interpretation of data; in the writing of the manuscript; or in the decision to submit the manuscript for publication.
Author details
1Department of Biostatistics and Epidemiology, University of Pennsylvania,
423 Guardian Drive, Philadelphia, PA 19104, USA.2Department of Statistics,
University of Pennsylvania, 3730 Walnut Street, Philadelphia, PA 19104, USA.
3Department of Medicine, University of Pennsylvania, 3400 Spruce Street,
Philadelphia, PA 19104, USA.4Department of Health Care Management,
University of Pennsylvania, 3641 Locust Walk, Philadelphia, PA 19104, USA.
5Department of Medical Ethics and Health Policy, University of Pennsylvania,
3401 Market Street, Philadelphia, PA 19104, USA.6Center for Health Equity
Research and Promotion, Philadelphia Veterans Affairs Medical Center, 3900 Woodland Avenue, Philadelphia, PA 19104, USA.
Received: 22 October 2014 Accepted: 6 February 2015
References
1. Marcus AC, Kaplan CP, Crane LA, Berek JS, Bernstein G, Gunning JE, et al. Reducing loss-to-follow-up among women with abnormal pap smears: results from a randomized trial testing an intensive follow-up protocol and economic incentives. Med Care. 1998;36:397–410. 2. Volpp KG, Loewenstein G, Troxel AB, Doshi J, Price M, Laskin M, et al. A
test of financial incentives to improve warfarin adherence. BMC Health Serv Res. 2008;8:272.
3. Volpp KG, John LK, Troxel AB, Norton L, Fassbender J, Loewenstein G, et al. Financial incentive-based approaches for weight loss: a randomized trial. JAMA. 2008;300:2631–7.
4. Volpp KG, Troxel AB, Pauly MV, Glick HA, Puig A, Asch DA, et al. A randomized, controlled trial of financial incentives for smoking cessation. N Engl J Med. 2009;360:699–709.
5. Charness G, Gneezy U. Incentives to exercise. Econometrica. 2009;77: 909–31.
6. Jeffery RW, Gerber WM, Rosenthal BS, Lindquist RA. Monetary contracts in weight control: effectiveness of group and individual contracts of varying size. J Consult Clin Psychol. 1983;51:242–8.
7. Halpern SD, Asch DA, Volpp KG. Commitment contracts as a way to health. BMJ. 2012;344:522.
8. Lachin JM. Properties of simple randomization in clinical trials. Control Clin Trials. 1988;9:312–26.
9. Luce BR, Kramer JM, Goodman SN, Connor JT, Tunis S, Whicher D, et al. Rethinking randomized clinical trials for comparative effectiveness research: the need for transformational change. Ann Intern Med. 2009;151:206–9.
10. Halpern SD. Prospective preference assessment: a method to enhance the ethics and efficiency of randomized controlled trials. Control Clin Trials. 2002;23:274–88.
11. Baiocchi M, Cheng J, Small DS. Instrumental variable methods for causal inference. Stat Med. 2014;33:2297–340.
12. Brown CH, Ten Have TR, Jo B. Adaptive designs for randomized trials in public health. Annu Rev Public Health. 2009;30:1–25.
13. Pocock SJ, Simon R. Sequential treatment assignment with balancing for prognostic factors in the controlled clinical trial. Biometrics. 1975;31: 103–15.
14. Wei LJ. An application of an urn model to the design of sequential controlled clinical trials. J Am Stat Assoc. 1978;73:559–63.
15. Birkett NJ. Adaptive allocation in randomized controlled trials. Control Clin Trials. 1985;6:146–55.
16. Zelen M. Play the winner rule and the controlled clinical trial. J Am Stat Assoc. 1969;64:131–46.
17. Wei LJ, Durham S. The randomized play-the-winner rule in medical trials. J Am Stat Assoc. 1978;73:840–3.
18. Hu F, Zhang Y. Asymptotic properties of doubly adaptive biased coin designs for multitreatment clinical trials. Ann Statist. 2004;32:268–301. 19. Holland PW. Causal inference, path analysis, and recursive structural
equations models. Sociol Methodol. 1988;18:449–84.
20. West SG, Duan N, Pequegnat W, Gaist P, Des Jarlais DC, Holtgrave D, et al. Alternatives to the randomized controlled trial. Am J Public Health. 2008;98:1359–66.
21. Chen YP. Biased coin design with imbalance tolerance. Comm Statist Stochastic Models. 1999;15:953–75.
22. Asch DA, Volpp KG. On the way to health. LDI Issue Brief. 2012;17:1–4. 23. Sommer A, Zeger SL. On estimating efficacy from clinical trials. Stat Med.
1991;10:45–52.
24. Angrist AD, Imbens GW, Rubin DB. Identification of causal effects using instrumental variables. J Am Stat Assoc. 1996;91:444–55.
25. Newhouse JP, McClellan M. Econometrics in outcomes research: the use of instrumental variables. Annu Rev Public Health. 1998;19:17–34. 26. Angrist JD. Estimation of limited dependent variable models with dummy
endogenous regressors: Simple strategies for empirical practice. J Bus Econ Stat. 2001;19:2–16.
27. Hernán MA, Hernández-Díaz S. Beyond the intention-to-treat in comparative effectiveness research. Clin Trials. 2012;9:48–55.
Submit your next manuscript to BioMed Central and take full advantage of:
• Convenient online submission
• Thorough peer review
• No space constraints or color figure charges
• Immediate publication on acceptance
• Inclusion in PubMed, CAS, Scopus and Google Scholar
• Research which is freely available for redistribution