Doing Organized Garment Retailing Business in India: A
Critical Analysis
Rajwinder Singh
School of Management Studies, Punjabi University, Patiala, India. Email: rajwindergheer@gmail.com
Received June 6th,2013; revised July 6th, 2013; accepted August 6th, 2013
Copyright © 2013 Rajwinder Singh. This is an open access article distributed under the Creative Commons Attribution License, which permits unrestricted use, distribution, and reproduction in any medium, provided the original work is properly cited.
ABSTRACT
Garment retailing is a sunrise industry in India. However, the industrial competitiveness has posed many challenges for the organized garment retailers in this sector. In this paper an attempt has been made to identify the challenges based on strong literature support in consultation of practitioners and consultants in this industry. This study has classified the retail challenges for organizing garment retailing into four factors 1) sourcing challenges; 2) locational challenges; 3) environmental challenges and 4) customer challenges. Also we have identified items for organizational performance as well as for competitive advantage. A confirmatory model has been used to test the hypotheses; (H1): Retailers under-stand the match between competitive advantage and organizational performance; (H2): They underunder-stand the match be-tween retail challenges and organizational performance; and (H3): They understand the match bebe-tween retail challenges and competitive advantage using structural equation modeling. This study shall help the organized garment retailer to know more about the business.
Keywords: Retail Challenges; Organized Retailers; Sourcing Challenges; Environmental Challenges; Locational Challenges; Customer Challenges; Competitive Advantage; Organizational Performance
1. Introduction
Retailing is the set of activities that markets products or services reach to the final consumers for their personal or household use. The concept of organized retailing gained momentum in 1980 and got full boom after liberalization in 1991. According to CMIE report the retail growth doubled from 1990 to 1999. In India there are more than 15 million retailers, operating in the form of “mom pop” outlets and spreading over more than 31 million square meters area, generating sales of USD 11 billion in 2007- 2008 [1]. Nowadays the major retail players in this in-dustry are; Reliance Retail, RPG Retail, The Tata Group, K Raheja Corporation, Piramyd Retail, Nilgiris’, Sub-hiksha Trading Limited, Trinethra, Vishal Group, and BPCL etc. These players have collaborated with many national and international players like Wal-Mart, Tesco, and Metro etc. to harvest the profits.
Supply chain management (SCM) enhances organiza- tional competitiveness by integrating the internal func- tions within a company and linking them with the exter- nal operations of suppliers, customers and other channel members [2]. The organizations need to master the chal-
lenges of speed, convenience and reliability. It may help to reduce costs, increase productivity, and reduce risk to gain competitive advantage [3].
The main focus of SCM is on operational cost, time and response, customer services, or profitability or mar- gins [4] and improvement in service levels and reduction in costs to improve organizational performance. It incor- porates logistics as a key supply chain focused on func- tion and effective supply chain management and pur- chasing practices are associated with competitive capa- bilities of the firm and it has more significant effects on firm performance [5].
The intense market competition and changing customer preferences have made the retailers’ job difficult and challenging. The intense competition has shut down many organized stores. This scenario has attracted the attention of many researchers to find a solution for the same. During discussion the practitioners in the field of OGR revealed the need to study retail challenges for bet-ter organizational performance.
ance (OP). The first section focuses on literature survey on RC, CA and OP. The second section focuses on re- search methodology and data analysis. In the last section the paper ends with discussion, limitation and scope for future research. The technique of factor analysis has been applied to classify RC and technique of structural equa- tion modeling has been applied to test the hypotheses.
2. Retail Challenges
Organised retail in India is little decade old industry, facing many challenges. The major RC in consultation of practitioners and consultants and with literature support is shown in Table 1.
The customers’ expectation for a wide product variety has complicated the task to manage the products. Despite the big garment production houses owned by the retailers, still there is a gap for the supply of wide garment variety. It is due the fact that different products have different meaning to the different customers. The product color, size, composition and brand shall quote different mean- ing to different customers. Efficient Product sourcing helps to arrange and manage inventory for customer satisfac- tion.
Transparency is also one of the major challenges for the OGR because the class of customers visiting these stores is qualified enough to compare products offered by different retailers. They expect detailed information re- garding products displayed with full authentication oth- erwise they shall churn. Also, the vast variety expecta- tions by the customers need specialized skilled staff to convince and satisfy them. It is due to the fact that same/ different products have different meanings to different customers. The staff should be trained to convince the customers. Otherwise, the sale shall be lost. The organ- ized garment retailers also revealed that highly qualified people are not much interested to join this sector. They leave the job after some experience. Hence, manpower management is also one of the major challenges for this
sector.
The unorganized stores are operated by traditional re- tailers and most of them are either owned or hired at very low rental charges as compared to organized retailers. Also, they are located at very prominent locations near residential areas in large numbers. Acquiring such loca- tions is a big challenge for the organized retailers. Also, the organized retailers have to pay multiple taxes posing more record keeping problems as compared to the unor- ganized retailers.
Inadequate Infrastructure is also one of the major challenges for the organized fashion retailing. It is due to the fact that the facilities like parking, internet access, and deliveries are not at par with the developed countries like USA, UK etc. Hence, it adversely affects the OGR performance. Also, the real estate cost is very high. It has adversely affected the OGR performance. The traditional retailers have already set the retail stores at the prominent locations in the heart of the cities. Such locations are distant dream for the organized retailers. Hence, to meet both the ends i.e. offering products at lower cost and pay- ing high operational cost is the major threat for the or- ganized fashion retailing.
The vast variety expectations and dynamic market pric- ing has posed major challenges for quick response to the market. Nowadays, the traditional retailers also offer wide variety at competitive prices. Also, the many producers directly sell their garments in the market at the competi- tive prices in large volume. It has posed a challenge to the marginal retailers. Also, the customer segments vis- iting the organized stores are the qualified people from middle and high income groups. They expect a better match for price and quality otherwise churn rate shall be more. The organization can easily duplicate the market- ing policies but, customer loyalty can’t be duplicated.
[image:2.595.57.540.577.738.2]High Connectivity is required to understand the cus- tomers’ expectations and means to meet them. The dy- namic nature of garment retailing business needs high
Table 1. Retail challenges.
SN Authors Retail challenges
1 [6] Retail is not recognized as an industry, High cost of real estate, High stamp duty, Inadequate infrastructure, Multiple and complex taxation system, Competitive forces
2 [7] Arson, Criminal damage, Sabotage, Robbery
3 [8] Unorganized stores, High operational costs, Requirement of specialization, Correct marketing mix, Strong IT support, Unclear industry status
4 [9] Effectiveness of marketing and Advertisement, Product sourcing, Technological changes, Higher service levels, Transparency, Management skills and capabilities
5 [10]
FDI in retail, Lack of recognition as an Industry, Difficulty in procurement and movement of goods, Mismatch in demand and supply, Numerous intermediates, Inefficient supply chains, Poor infrastructure, Availability and cost of real estate, Urban land ceiling, Availability of parking
connectivity among customers, markets, and organiza- tions. The failure of which shall result into lost sale and goodwill. Also, the operational cost of organized stores is very high as compared to the traditional retailers. It is due to the fact that the traditional retailers own shops and manage the operations by their own. For traditional re- tailers the rental charges, manpower cost, and tax burden are very less as compared to organized stores. On the other side all the services need to be paid for the OGR business.
The perfect competition nowadays has resulted into SC vs. SC. Many organizations have collaborated with national and international players to maximized SC per- formance. This intense competition has made the job of marginal organized retailers challenging. The price fluc- tuations, seasonal fluctuations, and changing customer preference has complicated the task of demand forecast- ing. The Government support is also one of the major challenges for the OGR business. Here, the permission of government to allow foreign direct investment (FDI) in organized retailing shall attract more customers by of- fering wide variety. Also, the presence of multiple nodal points complicates operations management. The OGR or- ganizations need to focus on inefficient operations to im- prove profits. This shall also, help to improve service levels.
3. Supply Chain Practices and Competitive
Advantage
The focus on competitive advantage (CA) plays very im- portant role for the success of business. Vivek and Rav- indran [12] in their study on SCM and retailer perform- ance stated that in modern retail the retailers have to deal with intense competition both domestically and globally due to changes in customer expectations. They further added that retail managers focus on three major supply chain trends; global sourcing practices, multi-channel route to market, and relationship based innovation for CA. The major CA items selected in consultations of practitioners and consultants in this field are discussed as follows:
Inventory Management: Inventory shares more than 75% of the operating budget. Hence, organizations search for the ways to minimize inventory levels for CA. Walker etal. [3] highlighted the need to master the challenges of speed, convenience and reliability for better competitive- ness.
Customer Satisfaction: The organizations maintain their own production and procurement facilities to satisfy customers for CA. Many researchers [13-15] revealed customer satisfaction as a tool for CA.
Profitability: In this competitive world, industrial houses take CA of bulk production or procurement. The
cost reduction process forced the organizations to inte- grate the SC through cooperation, information sharing and developing effective business processes [16]. Many researchers addressed the benefits of improving profit- ability and strengthening organizational competitiveness [15,17]. Selldin and Olhager [18] advocated profitability as an important construct for CA.
Identification of Customer Base: The identification of customer base is also one of the CA for organizations. Ramdas and Speakman [19] in their study advocated it as a tool for CA. The accurate identification of customers’ base shall help them to forecast their requirements and accordingly retail facilities shall be developed and filled. Nair [20] revealed that in order to gain CA, companies need to know their customers’ base and financial shape.
However, India lacks significant study on CA for or- ganized garment supply chain. Also, the visibility of these practices is limited [21]. Saad and Patel [22] in their em- pirical study on the automotive sector, quoted that Indian organization are striving hard to adopt new standards such as TQM, JIT, BPR and, SCM to enhance their per- formance for CA. Hence, more is needed to be done for CA.
4. Supply Chain Practices and
Organizational Performance
The better organizational performance (OP) is one of the major requirements to survive in this competitive world. Crook et al., (2008) focused to reduce unnecessary SC activities. Vivek and Ravinandran, [12] identified; return on investments, market share, growth of ROI, sales, profit margin on sales, and overall competitive position for better OP of small scale industry in India. They further added that supplier performance significantly influences OP. Ka- tou and Budhwar [23] in their empirical study on Greek manufacturing sector found out that OP consists of six variables as; effectiveness, efficiency, development, sat- isfaction, innovation, and quality. The major items se- lected in consultation of practitioners and consultants in this industry for CA are explained as follows:
Market Performance: Market performance is one of the most important indicators for OP [12]. The organiza- tions having a good market share shall lead in competi- tion.
Supply Chain Competencies: Nowadays there is SC vs. SC competition. A competent SC can save resources resulting into better OP [24,25].
Stakeholder Satisfaction: Stakeholders are the main actors to develop the financial base of the organization. Satisfied members shall remain attached otherwise they shall depart. Neely etal. [26] considered them as the focal point of the OP measurement process.
dicator for the measurement of OP [23]. The history has witnessed many organizations out of the business due to their failure to innovate and learn.
Satisfied Customers: It is also one of the important indicators for OP as satisfied customers shall become loyal to the organization and repurchase shall be assured [23].
Financial Performance: The ultimate objective of all the organizations is to have better financial performance. Many researchers also revealed that financial perform- ance is an important construct for the OP [12,27,28].
5. Theoretical Research Framework
[image:4.595.56.287.656.718.2]The theoretical framework used in this study is shown in
Figure 1. This framework is used to understand the rela- tionship among RC, CA, and OP. This research intends to prove the research framework by developing and test- ing hypotheses.
H1: Retailers understand the match between com- petitive advantage and organizational performance
It is observed that organized garment retailers have opened a large number of retail outlets to harvest profits for better organizational performance. These outlets are equipped with modern facilities as expected by the cus- tomers and offer products at competitive price and qual- ity. They have been taking competitive advantage of bulk purchase to offer products of better quality at competitive prices. This scenario shows that they understand the CA strategies for better OP. This needs large investments as cost of real estate and taxes are high. Despite this they are taking the challenge to expand business. Hence, it leads to:
H2: They understand the match between retail chal- lenges and organizational performance
The practices they have adopted are based on the strate- gies for better OP. Hence, it is felt that they understand RC and develop strategies for betterment of the business. It is also observed that they are highly skilled to harvest business profit by selecting prominent locations for CA. Hence, it leads to:
H3: They understand the match between retail chal- lenges and competitive advantage
The dynamic business environment and low operating cost of traditional retailers as compared for organized retailers has posed a major challenge. Despite this they have been opening store outlets in large numbers in the prominent locations. These locations are either in the heart
Figure 1. A conceptual framework for the research.
of the city or mall, where large numbers of customers are visiting. Hence, it shows that despite major challenges they are successful in running the business by developing CA strategies to cope with the challenges.
6. Database and Methodology
This research is based on primary data. The primary data was collected from the OGR organisations with the help of a questionnaire for RC, CA and OP. The questionnaire was developed based on strong literature support in con- sultation of practitioners and consultants in the field of OGR. The respondents were selected based on: India Re- tail Report 2007 & 2009, Retail Telephone Directory, PROWESS, and Organization websites etc. The unit of analysis is the OGR organizations operating in the prin- cipal cities of Punjab, Chandigarh, and Gurgaon. The rea- son for selecting this north India belt is due to, good in sale/production and establishment of OGR in large num- bers. The pre-pilot and pilot survey was done to improve the questionnaire. Later, large scale survey was done at the top, middle and lower level of OGR organizations by randomly selecting respondents based on telephone ad- dresses. The questionnaires were mailed after telephonic discussion and later, were followed for response. A total of 600 questionnaires were sent with receipt of 384 re- sponses (Top = 50, middle = 100, lower = 134) yielding a response rate of 64%. The technique of factor analysis using principal component analysis with varimax rotation has been applied to classify the factors for retail chal- lenges. The technique of confirmatory factor analysis has been used to test and validate the hypotheses.
Here, it is pertinent to mention that communality ≥ 0.5, Cronbach’s alpha ≥ 0.7, item-to-total correlation ≥ 0.5 and inter-item correlation ≥ 0.3, and KMO > 0.7 is good enough for conducting research in social sciences [29]. In this phase all the requirements were met for conducting factor analysis. Hence, factor analysis is done as shown in Table 2.
ResultsofFactorAnalysisforRetailChallenges: The item mean for seventeen retail challenges is 70.82. If all the seventeen items were loaded at five the total comes out to be 85. Hence, the challenges covered under the questionnaire explain 83.33% of the constructs. The Bart- lett’s Test of Sphericity is also significant (Approx. Chi- Square = 1211.586, df = 136, Sig. = 0.000). The results for factor analysis are shown in Table 2.
The factor analysis has classified the seventeen RC into four groups. These are explained as follows:
Sourcing challenges (f1): This is the first loading factor accounting for 7.134 of the Eigen value and covers 41.96% of the variance. The five items covered here are Forecasting, Product Sourcing, Govt. Support, Service Levels and Operations management. The factor loading varies from 0.911 to 0.687. The scale reliability here is 0.979 and inter-item correlation (Table 2) varies from 0.978 to 0.455.
Table 2. Factor analysis results for retail challenges.
Factors Retail Challenges
f1 f2 f3 f4
Forecasting 0.911
Product Sourcing 0.906 Govt. Support 0.876 Service Levels 0.752 Operations Management 0.687
Specialized Skills 0.964 Unorganized Stores 0.963
Transparency 0.940
Manpower Management 0.932
Multiple Taxes 0.948
Quick Response 0.945
Inadequate Infrastructure 0.941
Real Estate Cost 0.920
SC Performance 0.895
Customer Loyalty 0.884
Operational Cost 0.884
High Connectivity 0.870
Eigen Value 7.134 4.253 1.909 1.717 % Variance 41.96 25.01 11.22 10.10 Cumulative Variance 41.96 66.97 78.19 88.29 Cronbach Alpha 0.979 0.984 0.902 0.905
Locationalchallenges (f2): This is the second leading factor accounting for 4.253 of the Eigen valued covers 25.01% of variance. The four items covered here are Spe- cialized Skills, Unorganized Stores, Transparency, and Manpower Management. The factor loading varies from 0.964 to 0.932. The scale reliability here is 0.984 and inter-item correlation (Table 2) varies from 0.978 to 0.942.
Environmentalchallenges (f3): This is the third load- ing factor accounting for 1.909 of the Eigen value and covers 11.22% of the variance. The four items covered here are Multiple Taxes, Quick Response, Inadequate Infrastructure, and Real Estate Cost. The factor loading varies from 0.948 to 0.920. The scale reliability here is 0.902 and inter-item correlation (Table 2) varies from 0.976 to 0.931.
Customer challenges (f4): This is the fourth loading factor accounting for 1.717 of the Eigen value and covers 10.10% of the variance. The four items covered here are SC Performance, Customer Loyalty, Operational Cost, and High Connectivity. The factor loading varies from 0.895 to 0.870. The scale reliability here is 0.905 and inter-item correlation (Table 2) varies from 0.810 to 0.742.
DiscussionofRelultsforModifiedConfirmatoryModel
The proposed model is shown in Figure 2.
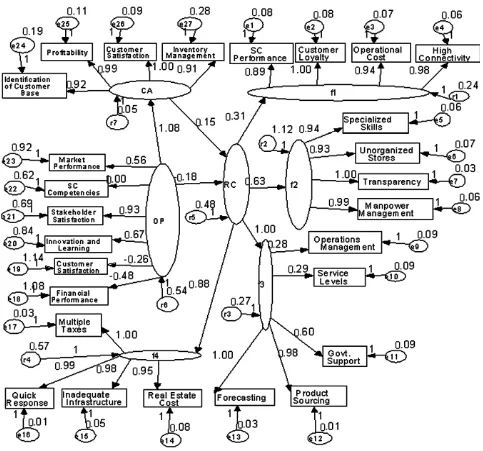
This model is not significant as the fit indices are not within the range. It has been modified based on the Modi- fication Index and Co-Variance Matrix. Here, the error e5 & e6, e11 & e10, and e9 & f11 have been correlated to improve the model. The modified model is shown in
Figure 3.
The modified model has Chi-square = 196.863, Df = 313, p = 0.00, RMR = 0.052, RMSEA = 0.518, GFI = 0.872, NFI = 0.880, RFI = 0.853, IFI = 0.890, TLI = 0.882, and CFI = 0.879. All these fit measures are sig- nificant [29]. The total effects are shown in the Table 3.
All the factors of RC have significant loading. The loading pattern on RC is; Sourcing Challenges (f1) = 0.32, Locational Challenges (f2) = 0.74, Environmental Challenges (f3) = 1.00 and Customer Challenges (f4) = 0.84. All these loading are more than 0.05 hence are sig-nificant [29]. All the loadings of items on f1 are different and significant in the range of 1.0 to 0.89. The loadings of items on f2 differently load from 1.0 to 0.98. The loadings on f3 load in the range of 1.0 to 0.28. Also, the loadings on f4 load differently in the range of 1.0 to 0.98.
Figure 2. Proposed model for the study.
ers understand the match between competitive advantage and organizational performance. Hence, H1 is proved to be true. Also the total effect of RC on CA (0.128) is sig- nificant. It shows that organized garment retailers under- stand the match between RC and CA. Hence, H3 is proved to be true. The loading of RC on OP (0.062) is also significant. It shows that the organized garment re- tailers understand the match between retail challenges and organizational performance. Hence, H2 is proved to be true.
7. Limitations and Scope for Future
Research
In this study we fail to contact more respondents from
the top as well as middle level. It was due to their highly busy schedule. Also, many respondents hesitate to fill in the questionnaire. It was due to the highly complicated procedure to get sanction for the same. Despite these difficulties we were able to get responses for pre-pilot, pilot and large scale survey. During discussion with the OGR practitioners we felt the need to study RC, CA and OP for organized and unorganized retailers for more gap analysis.
8. Acknowledgements
Figure 3. Modified model for the study.
Table 3. The effect estimates.
Effects OP CA RC
CA 1.078 0.000 0.0
Total effect
RC −0.062 0.128 0.0
CA 1.078 0.000 0.0 Direct effect
RC −0.106 0.128 0.0
CA 0.000 0.000 0.0 Indirect effect
RC 0.168 0.000 0.0
Chi-square = 196.863, Df = 313, p = 0.00, RMR = 0.052, RMSEA = 0.518, GFI = 0.872, NFI = 0.880, RFI = 0.853, IFI = 0.890, TLI = 0.882, and CFI = 0.879. The model is significant.
reviewers for providing highly valuable insights to see the tunnel end. In the last we are thankful to God al-mighty for support all the ways.
REFERENCES
[1] R. Rajmohan, “India Retail Report, 2009,” IMAGES, F&R Research, 2009.
[2] H. Jiqin, S. W. F. Omta and J. H. Trienekens, “The Joint Impact of Supply Chain Integration and Quality Man- agement on the Performance of Pork Processing Firms in China,” International Food and Agribusiness Manage- mentReview, Vol. 10, No. 2, 2007, pp. 67-98.
[3] B. Walker, D. Bovet and J. Martha, “Unlocking the Sup- ply Chain to Build Competitive Advantage,” Interna- tionalJournalofLogisticsManagement, Vol. 11, No. 2, 2000, pp. 1-8. doi:10.1108/09574090010806119
[4] L. Nuthall, “Supply Chain Performance Measures and Systems,” In: J. L. Gattorna, R. Ogulin and M. W. Rey-nolds, Ed., Handbook of Supply Chain Management, Grower Publishing, Burlington, 2003, pp. 248-266. [5] J. R. Carter and R. Narasimhan, “Purchasing and Supply
[image:7.595.57.288.534.658.2]ternational Journal of Purchasing and Materials Man- agement, Vol. 32, No. 2, 1996, p. 2.
[6] S. Pradhan, “Retailing Management Text and Cases,” 5th Edition, Tata McGraw-Hill Publishing Company Limited, New Delhi, 2007, pp. 21-211.
[7] A. J. Newman and P. Cullen, “Retailing Environment & Operations,” 2nd Edition, Cengage Learning India Private Limited, New Delhi, 2002.
[8] P. K. Sinha and D. P. Uniyal, “Managing Retailing,” Oxford University Press, New Delhi, 2007.
[9] S. Jack, “Challenges of the Future: The Rebirth of Small Independent Retail in America,” IRMA, 2004, pp. 10-22. http//www.retail-revival.com
[10] G. Kapoor, “Revolutionizing the Retail Industry in In- dia,” 51thWorldBusinessSummit, CIES, The Food Busi- ness Forum, Shanghai, 20-22 June 2007, pp. 211-235. [11] P. Bhatia and A. Sharma, “India’s Organised Retail
Play-ers Rethinking Strategy,” The EconomicTimes, 27 Sep-tember 2008. http//www.theeconomicstimes.com
[12] N. Vivek and S. Ravindran, “An Empirical Study on the Impact of Supplier Performance on Organizational Per-formance: A Supply Chain Perspective,” South Asian JournalofManagement, Vol. 61, No. 3, 2009, pp. 61-70. [13] D. F. Ross, “Competing through Supply Chain Manage-
ment: Creating Market-Winner Strategies through Sup- ply Chain Partnerships,” International Thomson Publish- ing, New York, 1997.
[14] P. K. Bagchi, “Role of Benchmarking as a Competitive Strategy: The Logistics Experience,” InternationalJour- nal of Physical Distribution Logistics, Vol. 26, No. 2, 1996, pp. 4-22. doi:10.1108/09600039610113173
[15] M. L. Fisher, “What Is the Right Supply Chain for Your Product?” HarvardBusinessReview, Vol. 75, No. 2, 1997, pp. 105-116.
[16] R. B. Handfield and C. Bechtel, “The Role of Trust and Relationship Structure in Improving Supply Chain Re- sponsiveness,” Industrial Marketing Management, Vol. 31, No. 4, 2002, pp. 367-382.
doi:10.1016/S0019-8501(01)00169-9
[17] M. Christopher, “Logistics and Supply Chain Manage-ment: Creating Value-Adding Networks,” 3rd Edition, Prentice-Hall, Harlow, 2005.
[18] E. Selldin and T. Olhager, “Linking Products with Supply Chains: Testing Fisher’s Model,” Supply Chain Man- agement: AnInternationalJournal, Vol. 12, No. 1, 2007,
pp. 42-51. doi:10.1108/13598540710724392
[19] K. Ramdas and R. E. Speakman, “Understanding What Driver-Supply Chain Performance,” Interfaces, Vol. 30, No. 4, 2000, pp. 3-21. doi:10.1287/inte.30.4.3.11644
[20] M. Nair, “Creating Global Competitive Advantage: Chal- lenges and Strategies,” ManagementTrends, Vol. 2, No. 2, 2005, pp. 72-79.
[21] S. K. Srivastava, “Logistics and Supply Chain Practices in India,” TheJournalofBusinessPerspective, Vol. 10, No. 3, 2006, pp. 69-79.
doi:10.1177/097226290601000307
[22] M. Saad and B. Patel, “An Investigation of Supply Chain Performance Measurement in the Indian Automotive Sec-tor,” Benchmarking: An International Journal, Vol. 13, No. 1-2, 2006, pp. 36-53.
[23] A. A. Katou and P. S. Budhwar, “Casual Relationship between HRM Policies and Organizational Performance: Evidence from Greek Manufacturing Sector,” European ManagementJournal, Vol. 28, No. 1, 2010, pp. 25-39.
doi:10.1016/j.emj.2009.06.001
[24] S. Chopra, and P. Meindle, “Supply Chain Management: Strategy, Planning, and Operations,” 2nd Edition, Pearson Prentice-Hall, Upper Saddle River, 2004.
[25] W. G. Kenneth, D. Whitten and R. A. Inman, “The Im- pact of Logistics Performance on Organizational Per- formance in the Supply Chain Context,” Supply Chain Management: AnInternational Journal, Vol. 13, No. 4, 2008, pp. 317-327.
[26] A. Neely, C. Adams and M. Kennerley, “The Perform-ance Prism: The Scorecard for Measuring and Managing Success,” Pearson Education Limited, London, 2002. [27] L. Fitzgerald, R. Johnston, S. Brignell, R. Silvestro and C.
Voss, “Performance Measurement in Service Business,” CIMA, London, 1991.
[28] K. W. Green Jr. and R. A. Inman, “Using a Just-in-Time Selling Strategy to Strengthen Supply Chain Linkages,” International Journal of Production Research, Vol. 43, No. 16, 2005, pp. 3437-3453.
doi:10.1080/00207540500118035