http://dx.doi.org/10.4236/nr.2015.63014
Lead Adsorption onto Various Solid Surfaces
Handojo Djati Utomo
1,21School of Architecture and The Built Environment, Division of Civil Engineering, Singapore Polytechnic,
Singapore
2Department of Chemistry, Marine and Freshwater Chemistry Laboratory, University of Otago, Dunedin,
New Zealand
Email: [email protected], [email protected]
Received 12 February 2015; accepted 2 March 2015; published 9 March 2015
Copyright © 2015 by author and Scientific Research Publishing Inc.
This work is licensed under the Creative Commons Attribution International License (CC BY).
http://creativecommons.org/licenses/by/4.0/
Abstract
Adsorption is becoming an important method in water and wastewater treatment technology at low concentrations. Pb2+ adsorption at low concentration onto various solid surfaces using either nano metal oxide of MnO2, or granulated activated carbon (GAC) or agricultural by-products such as tea leaves and coffee residue are considered promising. In this adsorption study the measure- ments were conducted by equilibrating Lead solutions at different concentrations range 19 - 291 µmol·L–1 with various adsorbent suspensions in the concentration range 0.388 - 8.738 g·L–1.
Com-paring all the adsorption capacities calculated using Langmuir equation Pb2+ adsorption by MnO2 shows the highest adsorption capacity with the estimated Γm = 528.0 µmol·g–1 at a fixed
equili-brium constant K = 0.0119 L·µmol–1. In addition, the Pb2+ adsorption by coffee residue is subject to
a particle concentration effect in which the adsorption density decreases as the concentration of solid adsorbent Cs is increased. The Pb2+ adsorption by tea leaves, MnO2 and GAC shows less de-pendency to the concentration of solid adsorbent Cs, especially at lower metal ion concentrations.
In the particular case of Pb2+ adsorption on MnO2 there appears to be no dependence on Cs.
Keywords
Adsorption, Coffee Residue, GAC, Pb2+, Particle Concentration Effect, Tea Leaves, Nano Metal Oxide of MnO2
1. Introduction
of lead pollution.
Lead accumulates mainly in bones, brain, kidney and muscles and may cause many serious disorders like anaemia, kidney diseases, nervous disorders and sickness even death. In 2001, EPA published Identification of Dangerous Levels of Lead [2] and Identifying Lead Hazards in Residential Properties [3]. The World Health Or-ganization (WHO) stated a legal limit of 50 ppb level for lead in 1995, which is decreased to 10 ppb level in 2010. The stringent requirement for lead in aquatic environment has triggered some wastewater engineer to work harder in searching for inexpensive material and technology to uptake lead pollutants from water and wastewater.
At low concentration of heavy metal concentration adsorption process is becoming an important pollutant removal method in water and wastewater treatment technology. After the revelation that activated carbon can adsorb organic and inorganic contaminants the advent of new technology is shifting towards sustainable tech-nology that use more economic and environmentally friendly materials as a replacement of activated carbon.
The re-use of natural waste materials that arise through various industrial processes for additional purposes, rather than simple disposal, makes both environmental and commercial sense [4]. There also has been a recent focus on agricultural and food industry wastes such as tea, coffee grounds and rice hull as alternatives to mem- brane filtration, synthetic ion-exchange resins or activated carbon for treating heavy metal-containing waste wa-ters [5] [6]. Tannin-containing materials such as exhausted coffee contain metal-binding polyhydroxy poly- phenol functional groups and they are available in large quantities from the manufacture of instant coffee [4] [7]. While there have been several studies of metal ion adsorption by tea and coffee the detailed chemistry causing their affinity for different metal ions is not yet well-known [8] [9].
Adsorption of metal ions and other solutes on solid surfaces can be described by simple isotherms such as the Langmuir or Freundlich equations [9] [10]. In this approach, the extent of adsorption of lead ion (Pb2+) per unit mass of solid adsorbent is described by simple isotherm equations that are based on conceptual models similar to those used for homogeneous equilibria. For this study the experimental data was applied to Langmuir isotherm model only due to the consistency in explaining the existence of particle concentration effect in the previous study [11]. In the Langmuir model the adsorption of a solute M by a surface S– is considered to be a result of the equilibrium surface reaction
[
]
[ ] [ ]
M SM S M S
S
e
C
K −
+ − ↔ − =
× − (1)
where [M – S] is the concentration of adsorbed solute M, Ce is the concentration of unadsorbed M and [S–] is the concentration of free surface sites, all at equilibrium. This formalism gives rise to the Langmuir adsorption isotherm
(
1)
e m
e
KC KC
Γ = Γ
+ (2) where Γ = [M – S] is the adsorption density, i.e. the concentration of adsorbed M per unit mass of solid and Γm
is the maximum concentration of adsorbed M.
In Equation (2), the adsorption properties are inherently described by the equilibrium constant in Equation (1) which may be identified with the free energy of adsorption of M by the solid. Normally, K and Γm may be de-termined simultaneously from measurements of Γ and Ce under different conditions.
This batch adsorption study was meant to be a comparison study set up using different concentration of adsor- bents at various concentration of Pb2+. Granulated Activated Carbon (GAC) and nano metal oxide of MnO2 were
used as comparisons to agricultural by-product materials of tea leaves and coffee residues.
2. Materials and Methods
2.1. Chemicals
All chemicals including MnO2 and GAC used in this study were of analytical grade obtained from Merck,
Ger-many. Stock solution of Pb2+ was prepared using Lead nitrate (PbNO3) in deionised water. Purified water was
prepared using a Millipore Milli-Q (Bedford, MA, USA) water purification system. Standard solution of Pb2+ (1000 mg/L) for flame atomic absorption spectrometry analysis was obtained from Merck, Germany. Pb2+ solu-tions of different concentrasolu-tions were obtained by diluting the stock solution. Standard acid of 0.1 M HNO3 and
2.2. Preparation of Tea and Coffee Adsorbentss
Exhausted coffee ground used was obtained from a local coffee manufacturer using steam extraction (Cerebos Greggs Ltd.). This material resulted from various coffee sources. The solid was dried in a stainless steel pan at 105˚C for about 2 days to remove moisture, then ground and sieved through an ASTM 18 stainless steel sieve (1 mm mesh size). The solid was then repeated extracted with 0.1 M NaOH solution to remove soluble materials, neutralized with 0.1 M HNO3 and then rinsed extensively with deionized water base (Millipore Milli-Q) as
re-ported earlier [6]. The material was then dried again at 105˚C before ready to use for the batch experiment. A Sri Lankan black tea variety known commercially as English Breakfast was obtained from a local super-market. Tea leaves were removed from tea bags after Milli-Q pretreatment and drying at 105˚C before being used as reported earlier [6].
2.3. Batch Adsorption and Methods of Analysis
Adsorption measurements were conducted by equilibrating Pb2+ solutions at different concentrations range 19- 291 µmol∙L–1 with various adsorbent suspensions in the concentration range 0.388 - 8.738 g∙L–1. Due to strong adsorptive properties found in preliminary experiment lower concentration of manganese dioxide (MnO2) with
range 0.388 - 1.214 g∙L−1 was used rather than higher concentration range 2.913 - 8.738 g∙L−1, which used for other adsorbents. Equilibration took place at room temperature (21˚C) using a rotating turntable overnight at 30 rpm. The suspensions were then filtered through a Whatman 114 filter and the concentrations of metal ion re- maining in solution were determined by flame atomic absorption spectrometry using matrix-matched standards (Perkin Elmer AA 3100 series). From this the amount adsorbed was calculated by difference. For a given value of solid concentration Cs, the data were fitted to the Langmuir isotherm, Equation (2), using non linear least- squares regression. This method, which differs from the more classical linearized fitting in a previous study, was carried out using the software NLReg [6] [12]. It involves varying the values of K and Γm from initial guesses until the sum of squared deviations of the calculated Γ from the experimental value for each data point is mini- mized.
3. Results and Discussions
In most experiments each set of Pb2+ concentrations ranging from 19 to 291 µmol∙L–1 were equilibrated with 3 (three) different concentration of adsorbent Cs except for coffee residue which used a wider range of concen- tration as detailed inTable 1.
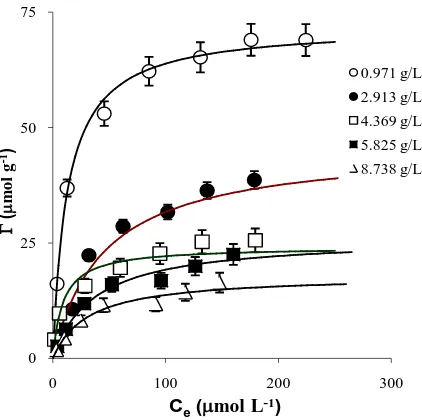
More variations of coffee grounds concentration were used to clearly discuss a particle concentration effect found in this particular adsorption study. In this case coffee ground concentration used was extended from the concentrations of 0.971, 2.913, 4.369, 5.825 and 8.738 g∙L–1. The result was expected in such cases that different concentrations of each adsorbent Cs equilibrated with Pb2+ ranging from 19 to 291 µmol∙L–1 fit into a single Langmuir model, i.e. single values of K and Γm for each type of adsorbent.
Figure 1 shows the adsorption result at different MnO2 solid concentration Cs. The calculated curves of Γ
versusCe that resulted from this fitting are also shown in the figure. The curve was calculated using a fixed val-ue of K = 0.0119 L∙µmol–1and a fixed value of Γm = 528.0 µmol g–1 for all Cs. The result shows that a single Langmuir equation adequately describes the data for the 3 different solid concentrations Cs. This implies that Pb2+ adsorption on MnO2 does obey the Langmuir Equation (2).
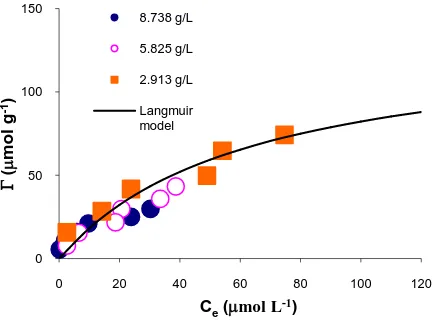
Adsorption of Pb2+ on GAC in aqueous solution was investigated using the procedure described above for MnO2 at the same concentration of solid Cs as used fortea leaves in the range 2.913 - 8.738 g∙L−1. The result is shown in Figure 2 with the curve was calculated using a fixed value of K = 0.0158 L∙μmol–1 and a fixed value of Γm = 134.0 μmol∙g–1 for all Cs. Again in this case, the results are reasonably well-described by a single Langmuir equation for different values of the solid concentrations Cs. This implies that Pb2+ adsorption on GAC does obey the Langmuir Equation (2).
Figure 1. Adsorption density Γ as a function of the measured equilibrium concentration Ce of metal ion Pb
2+
for 3 different concentrations of manganese dioxide Cs, i.e. 0.388, 0.583 and
1.214 g∙L–1.
Figure 2.Adsorption density Γ as a function of the measured equilibrium concentration Ce of metal ion Pb2+ for 3 different
[image:4.595.208.424.279.440.2]concentrations of GAC Cs, i.e. 2.913, 5.825 and 8.738 g∙L–1.
Table 1. Adsorbent concentration used to equilibrate Pb2+ solutions at concentrations range 19 - 291 µmol∙L–1.
Adsorbent GAC (g∙L–1) Tea leaves (g∙L–1) MnO
2 (g∙L–1) Coffee residue (g∙L–1)
Concentration (Cs) 2.913, 5.825, 8.738 2.913, 5.825, 8.738 0.388, 0.583, 1.214 0.971, 2.913, 4.369, 5.825, 8.738
Table 2.Adsorption results for Pb2+ at different solid concentrations Cs for which separate estimates of K and Γm were
ob-tained for each Cs value [11]. The values in parentheses are the standard errors for each parameter obtained from the non-linear
regression fitting.
Parameters
Cs (g∙L–1)
0.971 2.913 4.369 5.825 8.738
K (L∙μmol–1) 0.0748 (0.0069) 0.0218 (0.0040) 0.0701 (0.020) 0.0284 (0.0058) 0.0310 (0.0083)
Γ (μmol∙g–1) 72.4 (1.3) 48.3 (3.0) 26.5 (1.5) 25.8 (1.7) 18.5 (1.6)
The results shown inFigure 3 were very different from the previous two results, when using GAC and MnO2 as
adsorbents. The results revealed that while the Langmuir Equation (2) adequately describes the adsorption equi-librium for a given Cs value, the best-fit values of both K and Γm vary with Cs. This is not consistent with the simple Langmuir equation, which should give the same values of both parameters at different adsorbents con- centrations.
0 100 200 300 400 500
0 50 100 150 200 250
Γ
(
µ
mo
l g
-1)
Ce(µmol L−1)
0.388 g/L
0.583 g/L
1.214 g/L
Langmuir model
0 50 100 150
0 20 40 60 80 100 120
Γ
(
µ
mo
l g
-1)
Ce(µmol L-1)
8.738 g/L
5.825 g/L
2.913 g/L
[image:4.595.87.537.585.648.2]Figure 3. Adsorption density Γ as a function of the measured equilibrium concentration Ce of Pb
2+
using five different con-centrations of coffee solids Cs ranging from 0.971 to 8.738 g∙L–1.
The curves were calculated using the separately-fitted Langmuir equation parameters K and Γm for each value of Cs. Error bars in
this and subsequent figures represent the estimated uncertainties in Γ based on the FAAS measurements of [Pb2+] [11].
A number of authors had reported that the parameters K and/or Γm could vary when measurements were-made at different concentrations of solid. Examples included quinoline adsorption by calcium montmorillonite
[12], 2,2-bipyridine onto Na+-kaolinite [13], phosphate by hydrous aluminium oxides [14] and zinc by goethite
[15] [16]. This dependence on Cs violates the simple assumptions of the Langmuir theory.
Macchi [10] reported that the adsorption of Hg2+ by coffee grounds shows anomalous behaviour when the solids concentration Cs is varied. However, they did not attribute this to an effect of Cs on adsorption, but on the competitive effect of soluble organic substances leached out of the coffee. In fact the particle concentration ef- fect on coffee grounds, when adsorbing heavy metal ions, was affected by particle aggregation [11].
The adsorption results using tea leaves adsorbent show different behaviour from that showed with coffee re-sidue in Figure 3. There is very much less dependence of the adsorption curve on the concentration of solid. As shown in Figure 4, a single Langmuir model using fixed values of K = 0.0119 L∙μmol–1 and Γm= 5.0
Figure 4. Adsorption density Γ as a function of the measured equilibrium concentration Ce of Pb2+ for 3 different
concentra-tions of tea leaves Cs, i.e. 2.913, 5.825 and 8.738 g∙L
–1
.
0 25 50 75
0 100 200 300
Γ
(
µ
mo
l g
-1)
Ce(µmol L-1)
0.971 g/L
2.913 g/L
4.369 g/L
5.825 g/L
8.738 g/L
0 1 2 3 4 5 6
0 100 200 300 400
Γ
(
µ
mol
g
-1)
Ce(µmol L-1)
8.738 g/L
5.825 g/L
2.913 g/L
[image:5.595.208.420.527.681.2]μmol∙g–1 for all C
s values fitted the data reasonably well, given the scatter of the points at 2.913 g/L. This sug- gests that lead adsorption on tea leaves approximately follows the simple Langmuir equation.
4. Conclusions
Pb2+ adsorption at low concentration onto various solid surfaces using either nano metal oxide of MnO2, or
gra-nulated activated carbon (GAC) or agricultural by-products such as tea leaves and coffee residue is unarguably promising.
Comparing all the adsorption capacities calculated using single Langmuir equation the Pb2+ adsorption using nano metal oxide of MnO2 shows the highest adsorption capacity with the estimated Γm = 528.0 μmol∙g–1 at a fixed equilibrium constant K = 0.0119 L∙μmol–1. This could be due to the largest surface area per mass of MnO2.
The Pb2+ adsorption by coffee residue is subject to “particle concentration effect” in which the adsorption density decreases as the concentration of solid adsorbent Csis increased. The Pb2+ adsorption onto tea leaves, MnO2 and GAC shows less dependency to the concentration of solid adsorbent Cs, especially at lower metal ion concentrations. In the particular case of Pb2+ adsorption on MnO2 there appears to be no dependence on Cs and the single Langmuir equation is followed.
Acknowledgements
The laboratory experiment was conducted at Marine and Freshwater Chemistry Laboratory, University of Otago, New Zealand where the author was receiving the University of Otago, Division of Science Award. Preparation of manuscript writing and presentation was supported by Singapore Polytechnic (TIEFA) Vote Number: 11- 27801-36-R185. The author acknowledged Professor Keith A. Hunter for his assistance in developing the non- linear Langmuir isotherm model using NLReg special software.
References
[1] Alloway, B.J. and Ayres, D.C. (1993) Chemical Principles of Environmental Pollution. Blackie Academic and Profes-sional, London. http://dx.doi.org/10.1007/978-94-011-2148-4
[2] US Environmental Protection Agency (2001) Lead: Identification of Dangerous Levels of Lead: Final Rule. US Gov-ernment Printing Office, Washington DC.
[3] US Environmental Protection Agency (2001) Identifying Lead Hazards in Residential Properties. EPA 747/F-01/002, US Government Printing Office, Washington DC.
[4] Bailey, S.E., Olin, T.J., et al. (1999) A Review of Potentially Low-Cost Sorbents for Heavy Metals. Water Research, 33, 2469-2479. http://dx.doi.org/10.1016/S0043-1354(98)00475-8
[5] Low, K.S., Lee, C.K., et al. (2000) Metalsoprtion Enhancement of Rice Hull through Chemical Modification. Environ- mental Technology, 21, 1239-1243. http://dx.doi.org/10.1080/09593332108618152
[6] Djati Utomo, H. and Hunter, K.A. (2006) Adsorption of Divalent Copper, Zinc, Cadmium and Lead Ions from Aq- ueous Solution by Waste Tea and Coffee Adsorbents. Journal of Environmental Technology, 27, 25-32.
http://dx.doi.org/10.1080/09593332708618619
[7] Hawken, P. (2000) Reframing the Sustainability Debate. Specialty Coffee Association of America Conference, San Fran- cisco.
[8] Orhan, Y. and Buyukgungor, H. (1993) The Removal of Heavy-Metals by Using Agricultural Wastes. Water Science and Technology, 28, 247-255.
[9] Tan, W.T. (1985) Copper (II) Adsorption by Waste Tea Leaves and Coffee Powder. Pertanika, 8, 223-230.
[10] Macchi, G., Marani, D., et al. (1986) Uptake of Mercury by Exhausted Coffee Grounds. Environmental Technology Let- ters, 7, 431-444.
[11] Djati Utomo, H. and Hunter, K.A. (2010) Particle Concentration Effect: Adsorption of Divalent Metal Ions on Coffee Grounds. Bioresource Technology, 101, 1482-1486. http://dx.doi.org/10.1016/j.biortech.2009.06.094
[12] Sherrod, P.H. (1992) NONLIN Manual. Nashville.
[13] De Bussetti, S.G. and Ferreiro, E.A. (2005) Effect on 2,2-Bipyridine Adsorption of Poly(Vinyl Alcohol) Adsorbed on Na+-Kaolinite. Applied Clay Science, 29, 207-214.
[15] Pan, G. and Liss, P.S. (1998) Metastable-Equilibrium Adsorption Theory. I. Theoretical. Journal of Colloid and Inter-face Science, 201, 71-76. http://dx.doi.org/10.1006/jcis.1998.5396