www.impactjournals.com/oncotarget/ Oncotarget, Vol. 6, No. 31
Prognostic significance of
K-Ras
mutation rate in metastatic
colorectal cancer patients
Bruno Vincenzi1, Chiara Cremolini2, Andrea Sartore-Bianchi3, Antonio Russo4, Francesco Mannavola5, Giuseppe Perrone6, Francesco Pantano1, Fotios Loupakis2, Daniele Rossini2, Elena Ongaro7, Erica Bonazzina3, Emanuela Dell’Aquila1, Marco Imperatori1, Alice Zoccoli1, Giuseppe Bronte4, Giovanna De Maglio7, Gabriella Fontanini8, Clara Natoli9, Alfredo Falcone2, Daniele Santini1, Andrea Onetti-Muda6, Salvatore Siena3, Giuseppe Tonini1 and Giuseppe Aprile7
1 Department of Medical Oncology, Campus Bio-Medico University of Rome, Rome, Italy 2 Azienda Ospedaliero-Universitaria Pisana, Istituto Toscano Tumori, Pisa, Italy
3 Niguarda Cancer Center, Ospedale Niguarda Ca’ Granda, Milano, Italy
4 Department of Surgical, Oncological and Oral Sciences, Section of Medical Oncology, University of Palermo, Palermo, Italy 5 Università Cattolica del Sacro Cuore, Rome, Italy
6 Department of Anatomical Pathology, Campus Bio-Medico University of Rome, Rome, Italy 7 Department of Medical Oncology, Azienda Ospedaliero-Universitaria, Udine, Italy
8 Dipartimento di Patologia Chirurgica, Medica, Molecolare e dell’Area Critica, Università di Pisa, Pisa, Italy 9 Department of Medical, Oral and Biotechnological Sciences, University “G. D’Annunzio”, Chieti, Italy
Correspondence to: Antonio Russo, email: antonio.russo@usa.net
Correspondence to: Bruno Vincenzi, email: b.vincenzi@unicampus.it
Keywords: K-Ras, mutation rate, colorectal cancer, bevacizumab, prognosis
Received: July 20, 2015 Accepted: August 09, 2015 Published: August 19, 2015
This is an open-access article distributed under the terms of the Creative Commons Attribution License, which permits unrestricted use, distribution, and reproduction in any medium, provided the original author and source are credited.
AbstrAct
Introduction: Activating mutations of K-Ras gene have a well-established role as predictors of resistance to anti-EGFR monoclonal antibodies in metastatic colorectal
cancer (mCRC) patients. Their prognostic value is controversial, and no data regarding
the prognostic value of mutation rate, defined as the percentage of mutated alleles/ tumor sample, are available. We aimed to evaluate the prognostic value of K-Ras mutation rate in a homogenous cohort of mCRC patients receiving first-line doublet
plus bevacizumab.
Patients and Methods: This retrospective study enrolled 397 K-Ras mutant mCRC patients from 6 Italian centers, and 263 patients were fully evaluable for our analysis. K-Ras mutation rate was assessed by pyrosequencing. Patients with less than 60% of
cancer cells in tumor tissue were excluded. No patients received anti-EGFR containing
anticancer therapy, at any time. Median mutation rate was 40% and was adopted as cut-off. The primary and secondary endpoints were PFS and OS respectively.
Results: At univariate analysis, K-Ras mutation rate higher than 40% was significantly associated with lower PFS (7.3 vs 9.1 months; P < 0.0001) and OS
(21 vs 31 months; P = 0.004). A multivariate model adjusted for age at diagnosis, site of origin of tumor tissue (primary vs metastases), referral center, number of metastatic sites, and first-line chemotherapy backbone, showed that K-Ras mutation rate remained a significant predictor of PFS and OS in the whole population.
IntroductIon
The Kirsten Rat Sarcoma (K-Ras) oncogene encodes for a 189 amino acids protein, also called p21, a member of RAS superfamily proteins [1]. Mutations in K-Ras gene are found in approximately 30% of all human cancers [2] and in 35-45% of colorectal cancers (CRCs) [3-5]. The 95% of K-Ras mutations occurs in codons 12 and 13 while mutations in codons 61, 146 and other are less frequent in CRC, accounting for 5% of all mutations [6]. Activating mutations of the K-Ras oncogene is an established predictive biomarker for resistance to anti-epidermal growth factor receptor (anti-EGFR) therapies in metastatic CRC (mCRC). Even though selection of Ras wild type (i.e. K-Ras and N-Ras exons 2, 3 and 4) greatly improve efficacy of EGFR-targeted agents by excluding 50% to 60% of patients with tumors refractory to EGFR blockade [7-8], molecular alterations in additional nodes of the EGFR signalling network also seem to be clinically relevant. Among these, downstream mutations such as in B-Raf and PIK3CA genes have been investigated through several sequencing methods [9-11].
Despite of the well known importance of K-Ras mutations as predictive factor to anti-EGFR drugs administration, there is no consensus about the prognostic value of mutational status of K-Ras in CRC patients. Several reports have indicated that K-Ras mutations are negative prognostic markers and portend a poorer outcome in CRC [12] and a meta-analysis of 3439 patients reported that mutation on codon 12 glycine to valine has a statistically significant impact on failure-free survival (FFS) (P = 0.004, HR:1.3) and overall survival (OS) (P = 0.008, HR:1.29) and it is associated with a more aggressive biological behaviour of tumor [13]. A retrospective analysis of FOCUS trial showed that activating mutation in K-Ras and B-Raf oncogene are associated with shorter survival: patients harbouring K-Ras mutation have worse OS than patients with K-Ras wt tumors (HR:1.24; 95%CI:1,06-1.46; P = 0.008), but there is no evidence of an effect on progression free survival (PFS) (HR:1.14; 95%CI:0,98-1.33; P = 0.09) [14]. A recent post hoc analysis of the TRIBE study confirmed the negative prognostic role of K-Ras mutation in patients with mCRC treated with bevacizumab; more in details: the OS of all wt Ras patients was 34.4 months and 41.7 months when they received bevacizumab and FOLFIRI or bevacizumab and FOLFOXIRI respectively (HR: 0.84, 95%CI: 0.51-1.38), while the OS of mutant Ras patients was 23.1 months and 28.6 months when they received bevacizumab and FOLFIRI or bevacizumab and FOLFOXIRI [15] respectively (HR: 0.86, 95%CI: 0.61 to 1.23). The PFS of all Ras wt patients was 11.3 months vs 13.3 months in Ras mutant patients treated with bevacizumab and FOLFIRI or bevacizumab and FOLFOXIRI.
Up to now different methods for K-Ras mutation analysis have been used in experimental settings or in clinical trials in order to transfer useful predictive and prognostic information to clinical practice. Currently, the use of more sensitive methods has significantly improved the detection of K-Ras mutations. Interestingly while K-Ras mutation status has been always considered a dichotomic information, the recently use of technologies such as pyrosequincing, allow to identify an additional parameter i.e. the mutation rate, that is a measure of the rate of mutant alleles. The introduction and understanding of the biological significance and potential clinical impact of this new parameter could represent a high priority for patients evaluation. Indeed to our knowledge, there are no data about prognostic and\or predictive significance of rate of mutation of K-Ras in tumor specimens of mCRC patients treated with bevacizumab-containing chemotherapy in order to identify a specific subgroup of mutant K-Ras patients receiving a significant prognostic benefit from adding bevacizumab. We aimed to evaluate the correlation between rate of mutation of K-Ras and response to bevacizumab-containing treatment as well as its prognostic effect.
results
Patients’ population
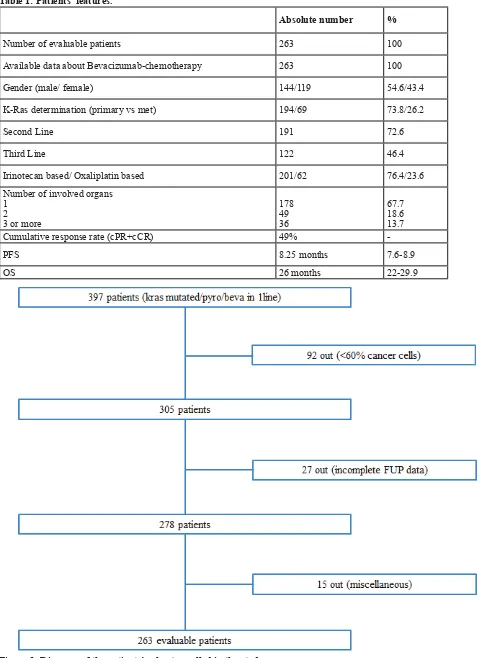
table 1: Patients’ features.
Absolute number %
Number of evaluable patients 263 100
Available data about Bevacizumab-chemotherapy 263 100
Gender (male/ female) 144/119 54.6/43.4
K-Ras determination (primary vs met) 194/69 73.8/26.2
Second Line 191 72.6
Third Line 122 46.4
Irinotecan based/ Oxaliplatin based 201/62 76.4/23.6 Number of involved organs
1 2 3 or more
178 49 36
67.7 18.6 13.7
Cumulative response rate (cPR+cCR) 49%
-PFS 8.25 months 7.6-8.9
[image:3.612.59.543.55.713.2]OS 26 months 22-29.9
as a confirmed PR or CR) was observed in 49% of the whole population. The median PFS and OS of mutant K-Ras patients were 8.25 months (95%CI: 7.6-8.9) and 26 months (95%CI: 22.03-29.97) respectively. Characteristics of evaluable patients were summarised in Table 1.
Prognostic value of mutant K-ras alleles: univariate analysis
In order to investigate the prognostic value of K-Ras mutation rate we firstly performed a survival analysis for the calculation of PFS and OS. We divided subjects into three groups: those mutated in codon 12, 13 and those with mutation on K-Ras rare codons. Each group was then dichotomized for the presence of a mutation rate higher or lower than 40%; the total number of the analyzed patients
[image:4.612.57.557.55.500.2]with a mutation rate > 40% was 109, while that of patients with a mutation rate < 40% was 154. The survival data were then used for the univariate analysis using the log rank test. We obtain that higher mutation rate resulted in a poor outcome in terms of PFS and OS. In particular the median PFS for mutant K-Ras patients was 8.25 months (95%CI: 7.48-9.01), but the PFS in mutant codon 12 patients with < 40% of mutation rate was 9.45 months (95%CI: 8.47-10.42) and that with ≥ 40% was 7.5 months (95%CI: 5.78-9.21). The median PFS in mutant codon 13 K-Ras patients was 8.9 months (95%CI: 7.69-10.10), the median PFS in mutant codon 13 K-Ras patients with < 40% and ≥ 40% was 10.25 months (95%CI: 8.15-12.34) and 7.25 months (95%CI: 14.40-43.59) respectively. The median PFS for other K-Ras mutations was 5.5 months (95%CI: 2.95-8.04), while the PFS for < 40% and ≥ 40% patients was 7.25 months (95%CI: 2.44-12.05) and 5.5 table 2: comparisons table and log-rank test for prognostic factor categories
.
PoPulAtIon
[K-ras mutated codons] PFs (95%cI)[mts] os (95%cI)[mts]
Codon 12,
all patients (pts) 8.25 (95%CI: 7.48-9.01) 28 (95%CI: 23.67-32.32)
Codon 12,
pts with >40% vs ≤40% mutant alleles 7.45 (95%CI: 5.78-9.21) vs 9.45 (95%CI: 8.47-10.4) 23 (95%CI: 19.79-26.20) vs 31 (95%CI: 27.00-34.99)
Codon 13,
all pts 8.90 (95%CI: 7.69-10.10) 21 (95%CI: 16.63-25.36)
Codon 13,
pts with >40% vs ≤40% mutant alleles 7.25 (95%CI: 3.6-10.89) vs 10.25 (95%CI: 8.15-12.32) 17 (95%CI: 11.61- 22.78) vs 24 (95%CI: 19.41- 28.58)
Rare codons,
all pts 5.50 (95%CI: 2.95- 8.04) 31 (95%CI: 27.03-34.03)
Rare codons,
pts with >40% vs ≤40% mutant alleles 5.5 (95%CI: 10.75-31.04) vs 7.25 (95%CI: 2.44-12.05)
-All K- Ras mutated codons,
pts with >40% vs ≤40% mutant alleles 7.25 (95%CI: 5.76 -8.73) vs 9 (95%CI: 7.96-10.03) 21 31 (95%CI: 26.66-35.33)(95%CI: 18.35-23.64) vs
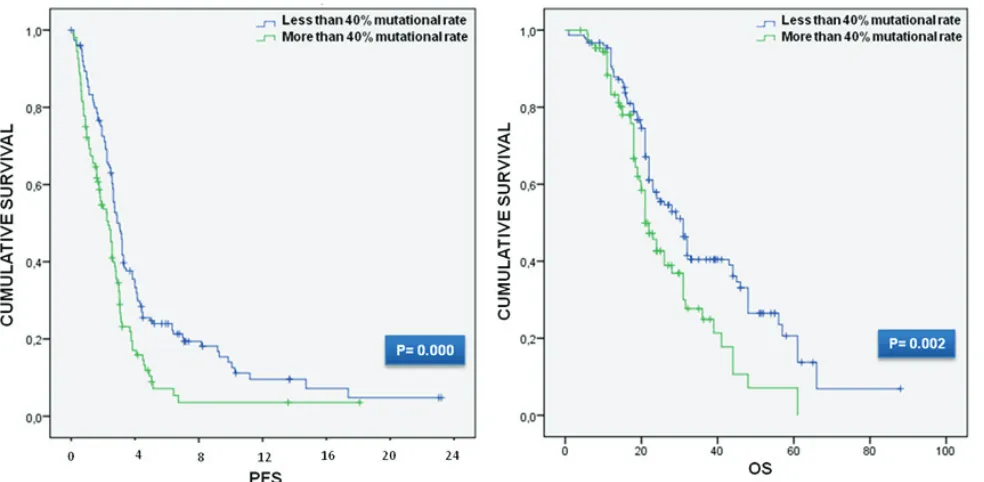
months (95%CI: 2.68-7.76) in that order. Regarding the median survival, OS of mutant K-Ras patients treated with a first line bevacizumab-containing treatment was 26 months (95%CI: 22.03-29.97). The median OS of mutant codon 12 patients was 28 months (95%CI: 23.67-32.32), but the OS in mutant codon 12 patients with < 40% was 31 months (95%CI: 27.00-34.99), while the OS in mCRC patients with codon 12 K-Ras mutation ≥ 40% was 23 months (95%CI: 19.79-26.20). The median OS in mutant codon 13 patients was 21 months (95%CI: 16.63-25.36); the OS in mutant codon 13 K-Ras patients with < 40% and ≥ 40% was 24 months (95%CI: 19.41-28.58) and 17 months (95%CI: 11.61-22.78) respectively. The OS of other rare mutant codons K-Ras patients was 31 months. In the univariate survival analysis, the patients with a mutation rate higher than 40% was significantly associated with both PFS (log-rank P = 0.000) and OS (log-rank P
= 0.002) with PFS and OS median value indicative of worse survival (median PFS: 7.25 months (95%CI: 5.76-8.73) vs 9 months (95%CI: 7.96-10.03) and median OS: 21 months (95%CI: 18.35-23.64) vs 31 months (95%CI: 26.66-35.33)) correspondingly. The different subgroups survival data and Kaplan Meier curves are shown in Table 2 and Figure 2.
A bioinformatic analysis was also conducted on a separate cohort consisting of 20 patients radically resected for liver metastasis and treated with chemotherapy. Taking advantage of the availability of primary and matched liver metastasis samples, we performed a correlation analysis finding a positive association (P = 0.030) between K-Ras mutation rate on the two sites. A subsequent Kaplan Meier survival analysis did not find any ability of K-Ras mutation allele frequency in predicting OS (P = 0.88), but we found that the cut-off (35%) generated through ROC method was very close to the one (40%) we used to dichotomize our cohort.
Prognostic value of mutant K-ras alleles: multivariate analysis
Since we have shown that the presence of more than 40% of mutation rate were associated with worse PFS
and OS, we also applied a Cox’s regression model with these factors included in order to estimate the independent effect of the mutation rate on the two outcomes. This unadjusted analysis provide the following results: for PFS an HR = 0.63 (95%CI: 0.46-0.80) with a P < 0.001, and for OS an HR = 0.66 (95%CI: 0.44-0.84) with a P
= 0.004. Moreover the multivariate Cox proportional hazards analysis, performed to compare prognostic factors of survival after adjustment for the impact of other factors (age at diagnosis, tumor tissue used for molecular analysis, reference center, number of metastatic sites, first-line chemotherapy) displayed a significative association between mutation rate and the two outcome’ predictors (for PFS: HR: 0.67, 95%CI: 0.53-0.82, P = 0.003; for OS: HR: 0.67, 95%CI: 0.53-0.82, P = 0.003). Finally, we investigate the independent effect of mutation rate (more or less than 40% mutant alleles) of codons 12, 13 and rare codons introducing them into the multivariate analysis; among these only codon’ 12 mutation rate present a significant association with PFS (HR: 0.71, 95%CI: 0.52-0.85, P = 0.003) and OS (HR: 0.71, 95%CI: 0.52-0.85, P
= 0.003).
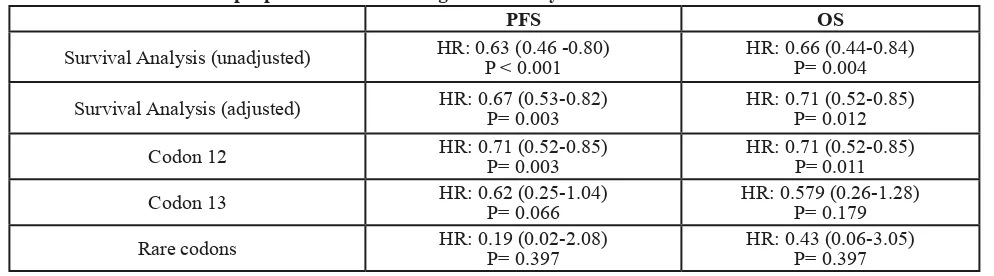
Overall, these results demonstrated that K-Ras alleles mutation rate remained a significant predictor of PFS and OS (codon 13 and rare codons did not reach statistical significance probably due to the low number of patients) (Table 3).
dIscussIon
[image:5.612.54.551.64.202.2]In the era of personalized medicine, the improved understanding of the EGFR pathway clarified that mutations of Ras genes are established negative predictive factors with regard to the use of anti-EGFR monoclonal antibodies. Not only the negative predictive value of K-Ras exon 2 mutations was validated in a number of studies [3, 5], but also the analysis of other mutations such as codon 61 in exon 3 and codon 146 in exon 4 may predict resistance to these drugs [16]. Moreover, since tumors harbouring any Ras mutation do not respond to cetuximab or panitumumab [17], an expanded Ras analysis, including N-Ras exon 2, 3 and 4, has been table 3: Multivariate cox proportional hazards regression analysis
.
PFs os
Survival Analysis (unadjusted) HR: 0.63 (0.46 -0.80)P < 0.001 HR: 0.66 (0.44-0.84)P= 0.004
Survival Analysis (adjusted) HR: 0.67 (0.53-0.82)P= 0.003 HR: 0.71 (0.52-0.85)P= 0.012
Codon 12 HR: 0.71 (0.52-0.85)P= 0.003 HR: 0.71 (0.52-0.85)P= 0.011
Codon 13 HR: 0.62 (0.25-1.04)P= 0.066 HR: 0.579 (0.26-1.28)P= 0.179
incorporated in the baseline evaluation of mCRC patients before treatment selection and the use of anti-EGFR monoclonal antibodies has been restricted to patients with Ras wild-type tumors.
Oppositely, the influence of K-Ras mutations on overall patients’ outcome is much less evident, indeed its prognostic value for patients with colorectal cancer is still debated. Even if K-Ras mutations seem not to correlate with the prognosis of patients with colorectal cancer the association remains to be confirmed with a more precise analysis of a large sample [18].
One of the reasons of these inconclusive results can be also attributed to cancer heterogeneity. Many tumors present heterogeneity within their cell population. This lack of cellular homogeneity may arise because of differential nutrient status due to an altered cancer induced microcirculations, normal cells’ infiltration into the tumor mass and to the hierarchical natures of the cell populations from which cancers arise. Recent findings demonstrated the complexity of settle and understand the heterogeneity of malignant disease, especially in an advanced setting. Some authors suggested that the molecular profile of the primary tumor might significantly differ from that of a corresponding metastatic site and might not reflect molecular aberrations accumulated as a consequence of selection pressure caused by applied cancer therapies. In addition, the molecular profile(s) of different metastatic sites might be disparate [19-21]. The molecular discordances between anatomic site locations of the same patient may hence reflect cancer heterogeneity [22]. Despite these data, other scientific reports established that, especially in patients never exposed to anti-EGFRs, the rate of concordance between primary tumor and
corresponding metastatic sites is very high [23-25], and our data are in accordance with those findings. Moreover in the cancers’ genetic heterogeneity scenario is important to take into account that the percentage of K-Ras mutated cells into the tumor mass can vary from one patient to another and this fact may substantially influence the ability to predict therapeutic response [26].
Our work includes a large, multi-institutional cohort, involving 263 real-world patients and aims to define the prognostic value of K-Ras mutation rate in a homogeneous population of patient treated with a first-line containing bevacizumab. We decided to consider PFS as the primary endpoint of the study because of its shorter available follow-up time and its independence from additional subsequent therapies, which preserved the homogeneity of our patients’ population. Furthermore, some correlation analysis showed associations between PFS and OS in some cancers such as mCRC [27].
We should also admit some limits; first of all the greatest bias of our work derives from the retrospective nature of the study itself. We decided to exclude from the analysis 92 patients because insufficient percentage of tumor cells contained in their samples and other 42 cases because of incomplete follow-up data: this caused a loss of 33% of the original cohort in the final analyses. In addition, the cut-off of 40% (median value) was arbitrarily chosen and not independently validated. Finally despite we used pyrosequencing to assess the mutational status of all patients, the analysis was performed in different laboratory. On the contrary the lack of detection of B-Raf and N-Ras mutations due to their mutually exclusive nature do not represent a limit.
[image:6.612.62.554.460.701.2]In the first prognostic analysis we confirm the
unfavorable K-Ras impact on both survival endpoints; interestingly these results were replicated when we investigated the effect of the mutation rate higher than 40% (chosen as cut-off value) on PFS and OS (PFS; P
= 0.000; OS; P = 0.002), independently of the type of mutation. This strong association emerged in each class of patients analyzed, grouped on the basis of the type of mutation (codon 12, 13 or rare codons), indeed PFS and OS was always higher (in terms of months) in those groups of patients with less than 40% of mutation rate, providing indication of a better survival.
These data encouraged us to apply a multivariate model for the evaluation of the independent effect of mutation rate of codons 12, 13 and rare codons. The analysis’ results showed that the prognostic value of exon 2/3 K-Ras mutations is retained after correction for other well-known prognostic factors (age at diagnosis, tumor tissue used for molecular analysis, reference center, number of metastatic sites and first-line chemotherapy) and confirm the robustness of the mutation rate as an effective predictor of PFS and OS.
In conclusion our results demonstrate for the first time a correlation between the K-Ras mutation rate (presence of more or less than 40% mutant alleles) in a homogenous advanced CRC population treated with bevacizumab containing first-line regimens. Certainly, our data need to be confirmed in a validation prospective set, but represent an important proof of concept for future translational analyses.
MAterIAls And Methods
In silico analysis
K-Ras mutation allele frequency was evaluated in Brannon et al cohort consisting of analyzed 69 patient trios of primary CRC, matched metastases and normal tissue retrieved from http://www.cbioportal.org/index.do using the following WEB API command http://www.cbioportal. org/webservice.do?cmd=getMutationData&case_set_ id=coadread_mskcc_all&genetic_profile_id=gbm_tcga_ mutations&gene_list=KRAS. 20 Kras mutated patients treated with chemotherapy were selected for further analysis. Cut-off estimation for Kaplan Meier analysis for OS was performed through Receiving Operator Curve methods using Cutoff Finder (http://molpath.charite.de/ cutoff/).
Patients and clinical endpoints
This multicentric retrospective study enrolled 397 consecutive patients from 6 Italian cancer centres with a histologically confirmed diagnosis of mutant K-Ras mCRC (evaluation performed homogeneously by
pyrosequencing) and treated with first-line anticancer regimens containing bevacizumab. Two clinical endpoints were used: PFS was the time from start of treatment to first evidence of tumor progression or death; OS was the time from start of treatment to death from any cause. The study has been conducted in accordance with the ethical principles that have their origin in the current Declaration of Helsinki and it has been approved by the ethical committee of Campus Bio-Medico of Rome. This study satisfy the REMARK criteria [28].
laboratory method
All tumor samples (belonging to primary tumor or metastatic lesions) used in this study were selected and dissected by an experienced pathologist, and were quality controlled by frozen section to ensure that tumor cells were present in at least 60% of the sample. FFPE sections were deparaffinised by submersion in xylene; the tissue was then incubated overnight at 56°C with Proteinase K (Qiagen, UK) to allow samples lysis and DNA was extracted using the Trizol reagent (Invitrogen, CA, USA) following the manufacturer’s instructions. To obtain RNA-free genomic DNA, an RNase A (Qiagen, UK) treatment was performed following the protocol instructions. The concentration and purity of the isolated DNA were measured using a NanoDrop ND-1000 Spectrophotometer (Thermo Fisher Scientific, DE, USA). Pyrosequencing analysis was performed by each local laboratory with the exception of cases provide by ASB that were analysed by the coordinating centre. Pyrosequencing analysis of K-Ras status was carried out on 0.15-0.5 pmol of each PCR product using the PyroMark MD System (Qiagen) following the manufacturer’s instructions, with sequencing primers and assay parameters specific to each mutation. Codons 12, 13, 61, 117 and 146 of K-Ras gene were analysed. For each assay, pyrosequencing analysis was taken to represent the identified percentage burden of the mutant allele. The cut-off value, discriminating between the mutant and wild-type sequence, was arbitrarily assigned as 10% mutant allele burden. A score for each mutant sequence was used for statistical analysis; in particular we assigned score 0 whether mutant K-Ras alleles were present in less than 40% while score 1 whether mutant K-Ras alleles were present in at least 40%. The determination of 40% as cut off value of allelic frequency was established because it represented the median value of the percentage’ distribution of mutant alleles.
statistical analysis
initiation of treatment (in apatient responding to therapy) until documentation of radiological or symptomatic diseaseprogression. The OS time was calculatedas the period from the date of starting treatment until death fromany cause or until the date of the last follow-up, at whichpoint data were censored. PFS and OS were both determined by Kaplan-Meier product-limit method. Finally, the Cox proportional hazards model was applied to the multivariate survival analysis. Survival analysis in multivariate model was corrected for the following variables: age at diagnosis, tumor tissue used for molecular analysis, reference center, number of metastatic sites and chemotherapy regimen in first line. The cut-off point for survival data was May 2014. SPSS software (version 17.00, SPSS, Chicago) was used for statistical analysis. A P value of less than 0.05 was considered to indicate statistical significance.
conFlIcts oF Interest
The authors declare no potential conflicts of interest
GrAnt suPPort
This work was supported by the Consorzio Interuniversitario Nazionale per la Bio-Oncologia (CINBO)
reFerences
1. Malumbres M, Barbacid M. RAS oncogenes: the first 30
years. Nat Rev Cancer. 2003; 3:459-465.
2. Adjei AA. Blocking oncogenic Ras signaling for cancer therapy. J Natl Cancer Inst. 2001; 93: 1062-1074.
3. Karapetis CS, Khambata-Ford S, Jonker DJ, O’Callaghan CJ, Tu D, Tebbutt NC, Simes RJ, Chalchal H, Shapiro JD, Robitaille S, Price TJ, Shepherd L, Au HJ et al.
K-ras mutations and benefit from cetuximab in advanced
colorectal cancer. N Engl J Med. 2008; 359: 1757-1765.
4. Amado RG, Wolf M, Peeters M, Van Cutsem E, Siena S,
Freeman DJ, Juan T, Sikorski R, Suggs S, Radinsky R,
Patterson SD, Chang DD. Wild-type KRAS is required for panitumumab efficacy in patients with metastatic colorectal
cancer. J Clin Oncol. 2008; 26: 1626-1634.
5. Van Cutsem E, Köhne CH, Hitre E, Zaluski J, Chang Chien
CR, Makhson A, D’Haens G, Pintér T, Lim R, Bodoky G, Roh JK, Folprecht G, Ruff P et al. Cetuximab and chemotherapy as initial treatment for metastatic colorectal cancer. N Engl J Med. 2009; 360: 1408-1417.
6. Forbes S, Clements J, Dawson E, Bamford S, Webb T, Dogan A, Flanagan A, Teague J, Wooster R, Futreal PA,
Stratton MR. COSMIC 2005. Br J Cancer. 2006; 94: 318- 322.
7. Ciardiello F, Normanno N. HER2 signaling and resistance to the anti-EGFR monoclonal antibody cetuximab: a
further step toward personalized medicine for patients with colorectal cancer. Cancer Discov. 2011; 1: 472-4.
8. Douillard JY, Oliner KS, Siena S, Tabernero J, Burkes R, Barugel M, Humblet Y, Bodoky G, Cunningham D, Jassem J, Rivera F, Kocákova I, Ruff P et al. Panitumumab- FOLFOX4 treatment and RAS mutations in colorectal cancer. N Engl J Med. 2013; 369: 1023-1034.
9. Di Nicolantonio F, Martini M, Molinari F, Sartore-Bianchi A, Arena S, Saletti P, De Dosso S, Mazzucchelli L, Frattini
M, Siena S, Bardelli A. Wild-type BRAF is required for
response to panitumumab or cetuximab in metastatic colorectal cancer. J Clin Oncol. 2008; 26: 5705-5712. 10. Seymour MT, Brown SR, Middleton G, Maughan T,
Richman S, Gwyther S, Lowe C, Seligmann JF, Wadsley
J, Maisey N, Chau I, Hill M, Dawson L et al. Panitumumab and irinotecan versus irinotecan alone for patients with
KRAS wild-type, fluorouracil-resistant advanced colorectal cancer (PICCOLO): a prospectively stratified randomised
trial. Lancet Oncol. 2013; 14: 749-759.
11. De Roock W, Claes B, Bernasconi D, De Schutter J, Biesmans B, Fountzilas G, Kalogeras KT, Kotoula V,
Papamichael D, Laurent-Puig P, Penault-Llorca F, Rougier
P, Vincenzi B et al. Effects of KRAS, BRAF, NRAS, and PIK3CA mutations on the efficacy of cetuximab plus
chemotherapy in chemotherapy-refractory metastatic colorectal cancer: a retrospective consortium analysis. Lancet Oncol. 2010; 11: 753-762.
12. Lièvre A, Bachet JB, Boige V, Cayre A, Le Corre D, Buc E,
Ychou M, Bouché O, Landi B, Louvet C, André T, Bibeau F, Diebold MD et al. KRAS mutations as an independent prognostic factor in patients with advanced colorectal cancer treated with cetuximab. J Clin Oncol. 2008; 26: 374-379.
13. Andreyev HJ, Norman AR, Cunningham D, Oates J, Dix
BR, Iacopetta BJ, Young J, Walsh T, Ward R, Hawkins N,
Beranek M, Jandik P, Benamouzig R et al. N Kirsten ras mutations in patients with colorectal cancer: the ‘RASCAL II’ study. Br J Cancer. 2001; 85: 692-696.
14. Richman SD, Seymour MT, Chambers P, Elliott F, Daly CL, Meade AM, Taylor G, Barrett JH, Quirke P. KRAS and BRAF mutations in advanced colorectal cancer are
associated with poor prognosis but do not preclude benefit
from oxaliplatin or irinotecan: results from the MRC FOCUS trial. J Clin Oncol. 2009; 27: 5931-5937.
15. Loupakis F, Cremolini C, Lonardi S, Tomasello G, Ronzoni
M, Zaniboni A, Tonini G, Valsuani C, Silvana C, Boni C,
Marcucci L, Negri F, Barone C et al. A Subgroup analyses in RAS mutant, BRAF mutant and all-wt mCRC pts treated with FOLFOXIRI plus bevacizumab (bev) or FOLFIRI plus bev in the TRIBE study. J Clin Oncol. 2014; 32: 5s, (suppl; abstr 3519).
16. Loupakis F, Ruzzo A, Cremolini C, Vincenzi B, Salvatore
irinotecan in KRAS codon 12 and 13 wild-type metastatic colorectal cancer. Br J Cancer. 2009; 101: 715-721.
17. Sorich MJ, Wiese MD, Rowland A, Kichenadasse G,
McKinnon RA, Karapetis CS. Extended RAS mutations
and anti-EGFR monoclonal antibody survival benefit in
metastatic colorectal cancer: a meta-analysis of randomized, controlled trials. Ann Oncol. 2015; 26: 13-21.
18. Ren J, Li G, Ge J, Li X, Zhao Y. Is K-ras gene mutation a
prognostic factor for colorectal cancer: a systematic review and meta-analysis. Dis Colon Rectum. 2012; 55: 913-923.
19. Dupont Jensen J, Laenkholm AV, Knoop A, Ewertz M, Bandaru R, Liu W, Hackl W, Barrett JC, Ciardiello F, Lenz H-J, Kohne C-H, Heinemann V, Tejpar S et al. Effect of KRAS and NRAS mutational status on first-line treatment
with FOLFIRI plus cetuximab in patients with metastatic colorectal cancer (mCRC): New results from the CRYSTAL trial. J Clin Oncol. 2014. 32: suppl 3; abstr LBA443. 20. Gonzalez-Angulo AM, Ferrer-Lozano J, Stemke-Hale
K, Sahin A, Liu S, Barrera JA, Burgues O, Lluch AM, Chen H, Hortobagyi GN, Mills GB, Meric-Bernstam F. PI3K pathway mutations and PTEN levels in primary and metastatic breast cancer. Mol Cancer Ther. 2011; 10: 1093- 1101.
21. Gerlinger M, Rowan AJ, Horswell S, Larkin J, Endesfelder D, Gronroos E, Martinez P, Matthews N, Stewart A,
Tarpey P, Varela I, Phillimore B, Begum S et al. Intratumor
heterogeneity and branched evolution revealed by multiregion sequencing. N Engl J Med. 2012; 366: 883- 892.
22. Watanabe T, Kobunai T, Yamamoto Y, Matsuda K, Ishihara
S, Nozawa K, Iinuma H, Ikeuchi H. Gene expression of vascular endothelial growth factor A, thymidylate synthase, and tissue inhibitor of metalloproteinase 3 in prediction of response to bevacizumab treatment in colorectal cancer patients. Dis Colon Rectum. 2011; 54: 1026-1035.
23. Santini D, Loupakis F, Vincenzi B, Floriani I, Stasi I,
Canestrari E, Rulli E, Maltese PE, Andreoni F, Masi G, Graziano F, Baldi GG, Salvatore L et al. A High concordance of KRAS status between primary colorectal tumors and related metastatic sites: implications for clinical practice. Oncologist. 2008; 13: 1270-1275.
24. Knijn N, Mekenkamp LJ, Klomp M, Vink-Börger ME, Tol J, Teerenstra S, Meijer JW, Tebar M, Riemersma S,
van Krieken JH, Punt CJ, Nagtegaal ID. KRAS mutation analysis: a comparison between primary tumours and matched liver metastases in 305 colorectal cancer patients. Br J Cancer. 2011; 104: 1020-1026.
25. Brannon AR, Vakiani E, Sylvester BE, Scott SN, McDermott G, Shah RH, Kania K, Viale A, Oschwald DM, Vacic V, Emde AK, Cercek A, Yaeger R et al. Comparative
sequencing analysis reveals high genomic concordance between matched primary and metastatic colorectal cancer lesions. Genome Biol. 2014; 15: 454.
26. Santini D, Galluzzo S, Gaeta L, Zoccoli A, Riva E, Ruzzo A, Vincenzi B, Graziano F, Loupakis F, Falcone A, Muda
AO, Tonini G. Should oncologists be aware in their clinical practice of KRAS molecular analysis? J Clin Oncol. 2011; 29: e206-7; author reply e208-209.
27. Özer-Stillman I, Strand L, Chang J, Mohamed AF, Tranbarger-Freier KE. Meta-analysis for the association between overall survival and progression-free survival in gastrointestinal stromal tumor. Clin Cancer Res. 2015; 21: 295-302.
28. McShane LM, Altman DG, Sauerbrei W, Taube SE,
Gion M, Clark GM. Statistics Subcommittee of the
NCI-EORTC Working Group on Cancer Diagnostics. Reporting