www.impactjournals.com/oncotarget/ Oncotarget, Vol. 6, No. 15
Differential gene expression in human abdominal aortic
aneurysm and aortic occlusive disease
Erik Biros1,*, Gabor Gäbel2,*, Corey S. Moran1, Charlotte Schreurs3, Jan H. N.
Lindeman3, Philip J. Walker4, Maria Nataatmadja5, Malcolm West5, Lesca M. Holdt6,
Irene Hinterseher7, Christian Pilarsky8 and Jonathan Golledge1,9
1 The Queensland Research Centre for Peripheral Vascular Disease, College of Medicine and Dentistry, James Cook University,
Townsville, Queensland, Australia
2 Department of Vascular and Endovascular Surgery, Ludwig-Maximillian University, Munich, Germany 3 Department of Vascular Surgery, Leiden University Medical Center, Leiden, The Netherlands
4 Royal Brisbane Clinical School, The University of Queensland, Queensland, Australia
5 The Cardiovascular Research Group, Department of Medicine, The University of Queensland, Queensland, Australia 6 Institute of Laboratory Medicine, Ludwig Maximilians University Munich, Munich, Germany
7 Department of General, Visceral, Vascular and Thoracic Surgery, Charité Universitätsmedizin Berlin, Charité Campus Mitte,
Berlin, Germany
8 Department of Vascular, Thoracic and Visceral Surgery, TU-Dresden, Dresden, Germany
9 Department of Vascular and Endovascular Surgery, The Townsville Hospital, Townsville, Queensland, Australia * These authors have contributed equally to this work
Correspondence to: Jonathan Golledge, email: [email protected] Keywords: aortic aneurysm, abdominal, arterial occlusive diseases, tissue array analysis
Received: March 02, 2015 Accepted: March 21, 2015 Published: April 15, 2015
This is an open-access article distributed under the terms of the Creative Commons Attribution License, which permits unrestricted use, distribution, and reproduction in any medium, provided the original author and source are credited.
AbstrAct
Abdominal aortic aneurysm (AAA) and aortic occlusive disease (AOD) represent common causes of morbidity and mortality in elderly populations which were previously believed to have common aetiologies. The aim of this study was to assess the gene expression in human AAA and AOD. We performed microarrays using aortic
specimen obtained from 20 patients with small AAAs (≤ 55mm), 29 patients with
large AAAs (> 55mm), 9 AOD patients, and 10 control aortic specimens obtained from organ donors. Some differentially expressed genes were validated by
quantitative-PCR (qRT-quantitative-PCR)/immunohistochemistry. We identified 840 and 1,014 differentially
expressed genes in small and large AAAs, respectively. Immune-related pathways including cytokine-cytokine receptor interaction and T-cell-receptor signalling were upregulated in both small and large AAAs. Examples of validated genes included CTLA4 (2.01-fold upregulated in small AAA, P = 0.002), NKTR (2.37-and 2.66-fold upregulated in small and large AAA with P = 0.041 and P = 0.015, respectively), and CD8A (2.57-fold upregulated in large AAA, P = 0.004). 1,765 differentially expressed
genes were identified in AOD. Pathways upregulated in AOD included metabolic and
IntroductIon
Peripheral arterial diseases include a collection of occlusive and aneurysmal diseases affecting arteries outside the heart estimated to affect approximately 5% of adults [1]. The mechanisms responsible for ischemic complications of peripheral artery atherosclerosis are believed to be similar to those implicated in coronary atherosclerosis [2]. In keeping with the perceived similar pathogenesis of coronary and peripheral artery disease most of the drug therapies used in patients with these conditions are the same [3]. The mechanisms involved in abdominal aortic aneurysm (AAA) development and their relationship with atherosclerosis are however controversial [4]. Examination of human AAA biopsies has consistently identified concurrent intimal atherosclerosis and most AAAs have been considered to result from atherosclerosis [5, 6]. Some of the risk factors for atherosclerosis and AAA are however distinct, for example diabetes an important positive risk factor for occlusive artery disease is a negative risk factor for AAA [4, 5]. Dyslipidemia is also believed to be a less important risk factor for AAA than atherosclerotic occlusive disease [7]. There are also a number of similarities between atherosclerosis and AAA, including common risk factors of smoking, hypertension, and male gender [5, 8, 9]. The role of atherosclerosis in AAA therefore is currently controversial [4].
Examination of mechanisms involved in AAA has mainly relied on use of animal, particularly rodent, models [10]. The availability of whole genome expression profiling has allowed insight into a range of human pathologies but has been relatively sparingly applied to AAA and aortic atherosclerosis [11-15]. Two previous studies have examined the whole genome expression profile of human AAA specimen although sample sizes for these studies were relatively small totaling 7 and 10 AAA patients, and no comparison was performed with atherosclerosis [11, 12]. In the current study we examined the whole genome expression profiles of a relatively large number of human aortic biopsies from subjects undergoing surgery to repair AAAs and to treat chronic lower limb ischemic due to aortic atherosclerosis (aortic occlusive disease, AOD). Aortic wall samples obtained from organ donors were used as controls. We aimed to compare the aortic gene expression profile of patients with AAA and AOD to those of older subjects with normal aortic histology.
results
Patient characteristics
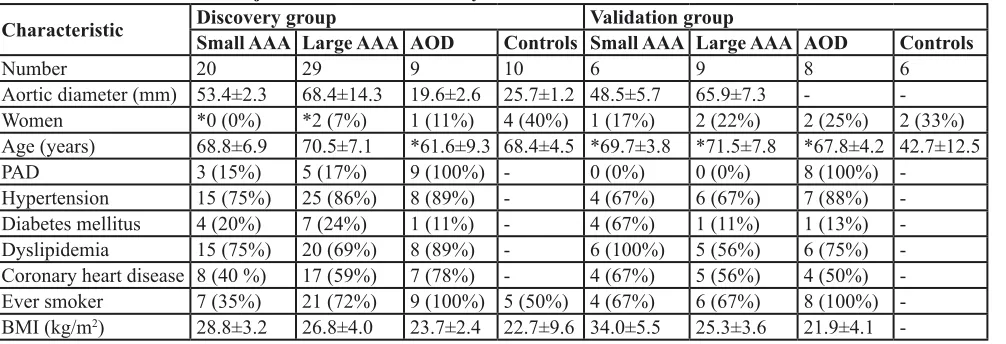
The gene expression was initially assessed in the aortic biopsies of 20 patients with small AAAs (mean
AAA diameter 53.4±2.3 mm), 29 patients with large AAAs (mean AAA diameter 68.4±14.3 mm), 9 patients with AOD (mean aortic diameter 19.6±2.6 mm), and 10 control organ donors using microarrays (Table 1). AAA patients were less likely to be female compared to controls (small AAA 0%, large AAA 7%, controls 40%; P < 0.05), while AOD patients were younger compared to controls (mean age 61.6±9.3 vs. 68.4±4.5 years, P < 0.05). The validity of microarray findings was further assessed in biopsies obtained from 6 patients with small AAAs, 9 patients with large AAAs, 8 AOD patients, and 6 controls (Table 1). AAA and AOD cases were older compared to controls (mean age small AAAs 69.7±3.8, large AAAs 71.5±7.8, AOD 67.8±4.2, controls 42.7±12.5 years; P < 0.05). Mean maximum AAA diameter was 48.5±5.7 and 65.9±7.3 mm in patients with small and large AAAs, respectively.
Numerical assessment of gene expression profiles in small AAAs, large AAAs, and Aod
A total of 39,157 transcripts in small AAAs, 39,389 transcripts in large AAAs, 37,904 transcripts in AOD, and 36,725 transcripts in control samples, representing > 80% of the Illumina HumanHT-12 v4 Expression BeadChip reference list, were expressed above background and subjected to differential gene expression analysis. A total of 840 individual genes were differentially expressed (≥ 2.0-fold, adjusted P < 0.05) in small AAAs compared to controls (122 upregulated and 718 downregulated genes; Figure 1a and 1b, respectively). A total of 1,014 individual genes were differentially expressed (≥ 2.0 fold, adjusted P < 0.05) in large AAAs compared to controls (215 upregulated and 799 downregulated genes; Figure 1a and 1b, respectively). 1,765 individual genes were differentially expressed (≥ 2.0-fold, adjusted P < 0.05) in AOD compare to controls (1,677 upregulated and 88 downregulated genes; Figure 1a and 1b, respectively). Full lists of differentially expressed genes are given in Supplemental Table I, Supplemental Table II, and Supplemental Table III for small AAA, large AAA, and AOD, respectively. A preponderance of genes upregulated in small AAAs (100/122; 82%) were also upregulated in large AAAs. Approximately 47% (100/215; Figure 1a) of the genes upregulated in large AAAs were also upregulated in small AAAs. In contrast only one gene (CXCL12) differentially expressed in AOD samples (1/1,765) was also differentially expressed in small (1/840) or large (1/1,014) AAAs (Figure 1a and 1b).
Pathways related to the differentially expressed genes in small and large AAA
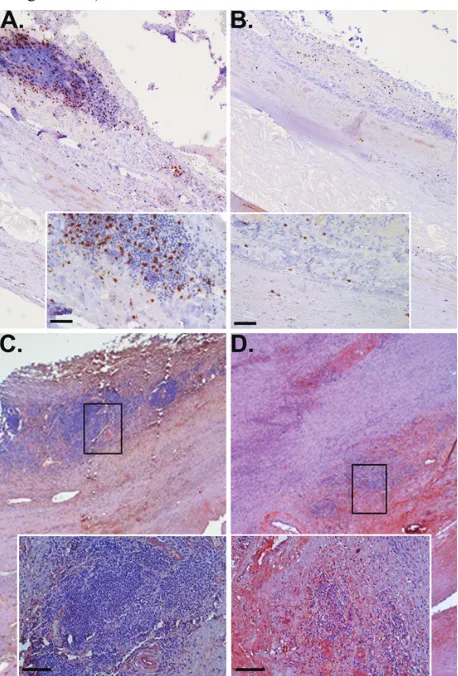
Figure 2: cd8+ lymphocytes and ctlA4 in large versus small AAA. Immunohistochemical staining identifying the increased presence of CD8+ T cells (brown stain) in tissue from large AAA (A) versus small AAA (b) associated with lower detection of CTLA4 (red stain) in large (c) compared to small AAA (d); scale bar = 50 μm (A&B) & 100 μm (c&d).
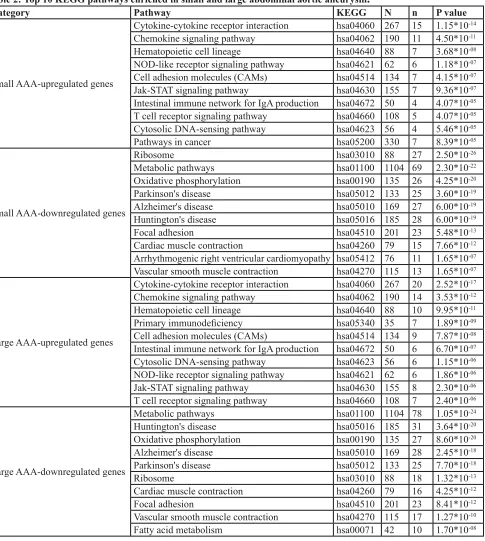
to Kyoto Encyclopedia of Genes and Genomes (KEGG) pathways to assess the biological contexts of these genes. KEGG annotations included 93% (114/122) of upregulated genes and 92% (661/718) of downregulated genes in small AAAs; and 91% (196/215) of upregulated genes and 95% (756/799) of downregulated genes in large AAA samples. The KEGG analysis revealed marked upregulation of genes related to immune responses in both small and large AAA. These pathways included cytokine-cytokine receptor interaction (hsa04060; P = 1.15*10 -14 for small AAA, and P = 2.52*10-17 for large AAA),
chemokine signaling pathway (hsa04062; P = 4.50*10-11
for small AAA, and P = 3.53*10-12 for large AAA), and
T-cell receptor signaling pathway (hsa04660; P = 4.07*10 -05 for small AAA, and P = 2.40*10-06 for large AAA) as
shown in Table 2. Metabolic pathways (hsa01100) and oxidative phosphorylation (hsa00190) were found among the top 10 most significant KEGG categories enriched by downregulated genes with P = 2.30*10-22 (metabolic
pathways) and P = 4.25*10-20 (oxidative phosphorylation)
for small AAA; and P = 1.05*10-24 (metabolic pathways)
and P = 8.60*10-20 (oxidative phosphorylation) for large
AAA (Table 2).
differentially expressed genes in small and large AAA
Considering the marked enrichment of immune response categories in small and large AAA, we further examined a number of genes related to the immune response (Table 3). A majority of genes upregulated in small AAA were also upregulated in large AAA. Examples include genes coding for: pro-inflammatory cytokines IL1B (5.08-fold, P = 0.002 for small AAA; 3.85-fold, P = 0.001 for large AAA), IL6 (6.28-fold, P = 0.004 for small
AAA; 6.48-fold, P = 0.002 for large AAA), and IL8 (4.49-fold, P = 0.005 for small AAA; 3.65-fold, P = 0.004 for large AAA); chemokines CXCL2 (3.35-fold, P = 0.004 for small AAA; 2.73-fold, P = 0.005 for large AAA), CXCL13 (2.21-fold, P = 0.013 for small AAA; 3.09-fold, P = 0.002 for large AAA), CCL3L3 (3.14-fold, P = 0.039 for small AAA; 2.59-fold, P = 0.041 for large AAA), and CCL4L2 (2.48-fold, P = 0.021 for small AAA; 2.12-fold, P = 0.023 for large AAA); early T-cell and B-cell activation cluster of differentiation (CD) antigens CD69 (2.67-fold, P = 0.039 for small AAA; 3.45-fold, P = 0.004 for large AAA) and CD19 (2.79-fold, P = 0.026 for small AAA; 4.45-fold, P = 0.002 for large AAA), respectively; and the natural killer (NK) cells associated protein NKTR (2.37-fold, P = 0.002 for small AAA; 2.66-fold, P = 0.001 for large AAA). An important negative regulator of T-cells responses, the CTLA4 gene, was exclusively upregulated in small AAA (2.01-fold, P = 0.018). On the other hand, there was increased expression of genes related to T-cell and B-cell responses exclusively in large AAA, including alpha chain of the T-cell co-receptor CD8A (2.24-fold, P = 0.012); the CD79A/CD79B membrane-bound dimer immunoglobulin in B-cells (2.76-fold, P = 0.005/3.43-fold, P = 0.004); the receptors for Fc fragment of IgG in B-cells FCRL2 (2.53-fold, P = 0.002), FCRL5 (2.01-fold, P = 0.001), and FCRLA (3.15-fold, P = 0.009). Three genes (CTLA4, NKTR, and CD8A) were selected for further validation with quantitative real-time PCR.
Pathways related to the differentially expressed genes in Aod
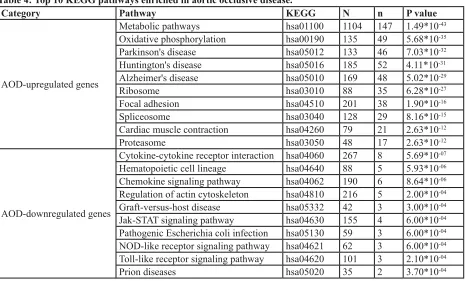
[image:4.612.61.564.60.232.2]92% (1,550/1,677) of upregulated genes and 90% (79/88) of downregulated genes in AOD samples were annotated in the KEGG pathways. The pathways enriched
table 1: characteristics of subjects included in this study.
characteristic discovery groupsmall AAA large AAA Aod controls small AAA large AAA AodValidation group controls
Number 20 29 9 10 6 9 8 6
Aortic diameter (mm) 53.4±2.3 68.4±14.3 19.6±2.6 25.7±1.2 48.5±5.7 65.9±7.3 - -Women *0 (0%) *2 (7%) 1 (11%) 4 (40%) 1 (17%) 2 (22%) 2 (25%) 2 (33%) Age (years) 68.8±6.9 70.5±7.1 *61.6±9.3 68.4±4.5 *69.7±3.8 *71.5±7.8 *67.8±4.2 42.7±12.5 PAD 3 (15%) 5 (17%) 9 (100%) - 0 (0%) 0 (0%) 8 (100%)
-Hypertension 15 (75%) 25 (86%) 8 (89%) - 4 (67%) 6 (67%) 7 (88%) -Diabetes mellitus 4 (20%) 7 (24%) 1 (11%) - 4 (67%) 1 (11%) 1 (13%) -Dyslipidemia 15 (75%) 20 (69%) 8 (89%) - 6 (100%) 5 (56%) 6 (75%) -Coronary heart disease 8 (40 %) 17 (59%) 7 (78%) - 4 (67%) 5 (56%) 4 (50%) -Ever smoker 7 (35%) 21 (72%) 9 (100%) 5 (50%) 4 (67%) 6 (67%) 8 (100%) -BMI (kg/m2) 28.8±3.2 26.8±4.0 23.7±2.4 22.7±9.6 34.0±5.5 25.3±3.6 21.9±4.1
table 2: top 10 KeGG pathways enriched in small and large abdominal aortic aneurysm
.
category Pathway KeGG n n P value
Small AAA-upregulated genes
Cytokine-cytokine receptor interaction hsa04060 267 15 1.15*10-14
Chemokine signaling pathway hsa04062 190 11 4.50*10-11
Hematopoietic cell lineage hsa04640 88 7 3.68*10-08
NOD-like receptor signaling pathway hsa04621 62 6 1.18*10-07
Cell adhesion molecules (CAMs) hsa04514 134 7 4.15*10-07
Jak-STAT signaling pathway hsa04630 155 7 9.36*10-07
Intestinal immune network for IgA production hsa04672 50 4 4.07*10-05
T cell receptor signaling pathway hsa04660 108 5 4.07*10-05
Cytosolic DNA-sensing pathway hsa04623 56 4 5.46*10-05
Pathways in cancer hsa05200 330 7 8.39*10-05
Small AAA-downregulated genes
Ribosome hsa03010 88 27 2.50*10-26
Metabolic pathways hsa01100 1104 69 2.30*10-22
Oxidative phosphorylation hsa00190 135 26 4.25*10-20
Parkinson's disease hsa05012 133 25 3.60*10-19
Alzheimer's disease hsa05010 169 27 6.00*10-19
Huntington's disease hsa05016 185 28 6.00*10-19
Focal adhesion hsa04510 201 23 5.48*10-13
Cardiac muscle contraction hsa04260 79 15 7.66*10-12
Arrhythmogenic right ventricular cardiomyopathy hsa05412 76 11 1.65*10-07
Vascular smooth muscle contraction hsa04270 115 13 1.65*10-07
Large AAA-upregulated genes
Cytokine-cytokine receptor interaction hsa04060 267 20 2.52*10-17
Chemokine signaling pathway hsa04062 190 14 3.53*10-12
Hematopoietic cell lineage hsa04640 88 10 9.95*10-11
Primary immunodeficiency hsa05340 35 7 1.89*10-09
Cell adhesion molecules (CAMs) hsa04514 134 9 7.87*10-08
Intestinal immune network for IgA production hsa04672 50 6 6.70*10-07
Cytosolic DNA-sensing pathway hsa04623 56 6 1.15*10-06
NOD-like receptor signaling pathway hsa04621 62 6 1.86*10-06
Jak-STAT signaling pathway hsa04630 155 8 2.30*10-06
T cell receptor signaling pathway hsa04660 108 7 2.40*10-06
Large AAA-downregulated genes
Metabolic pathways hsa01100 1104 78 1.05*10-24
Huntington's disease hsa05016 185 31 3.64*10-20
Oxidative phosphorylation hsa00190 135 27 8.60*10-20
Alzheimer's disease hsa05010 169 28 2.45*10-18
Parkinson's disease hsa05012 133 25 7.70*10-18
Ribosome hsa03010 88 18 1.32*10-13
Cardiac muscle contraction hsa04260 79 16 4.25*10-12
Focal adhesion hsa04510 201 23 8.41*10-12
Vascular smooth muscle contraction hsa04270 115 17 1.27*10-10
Fatty acid metabolism hsa00071 42 10 1.70*10-08
table 3: examples of differentially expressed genes in small and large AAA with some connection to immunity
.
symbol name small AAAFold change corrected large AAA
P value Fold change corrected P value
IL1B interleukin 1, beta 5.08 0.002 3.85 0.001
IL6 interleukin 6 6.28 0.004 6.48 0.002
IL8 interleukin 8 4.49 0.005 3.65 0.004
CXCL2 chemokine (C-X-C motif) ligand 2 3.35 0.004 2.73 0.005 CXCL13 chemokine (C-X-C motif) ligand 13 2.21 0.013 3.09 0.002 CCL3L3 chemokine (C-C motif) ligand 3-like 3 3.14 0.039 2.59 0.041 CCL4L2 chemokine (C-C motif) ligand 4-like 2 2.48 0.021 2.12 0.023
CD69 CD69 molecule 2.67 0.039 3.45 0.004
CD19 CD19 antigen 2.79 0.026 4.45 0.002
NKTR natural killer-tumor recognition sequence 2.37 0.002 2.66 0.001 CTLA4 cytotoxic T-lymphocyte-associated protein 4 2.01 0.018 -
-CD8A CD8 antigen, alpha chain - - 2.24 0.012
CD79A CD79A antigen, immunoglobulin-associated alpha - - 2.76 0.005 CD79B CD79b molecule, immunoglobulin-associated beta - - 3.43 0.004
FCRL2 Fc receptor-like 2 - - 2.53 0.002
FCRL5 Fc receptor-like 5 - - 2.01 0.001
FCRLA Fc receptor-like A - - 3.15 0.009
AAA, abdominal aortic aneurysm. Differentially expressed genes were determined by comparison of patients with small or large AAA with patients without AAA (Controls), (> 2-fold change, P value < 0.05 calculated with non-parametric Mann-Whitney test and corrected by Benjamini and Hochberg method).
table 4: top 10 KeGG pathways enriched in aortic occlusive disease.
category Pathway KeGG n n P value
AOD-upregulated genes
Metabolic pathways hsa01100 1104 147 1.49*10-43
Oxidative phosphorylation hsa00190 135 49 5.68*10-35
Parkinson's disease hsa05012 133 46 7.03*10-32
Huntington's disease hsa05016 185 52 4.11*10-31
Alzheimer's disease hsa05010 169 48 5.02*10-29
Ribosome hsa03010 88 35 6.28*10-27
Focal adhesion hsa04510 201 38 1.90*10-16
Spliceosome hsa03040 128 29 8.16*10-15
Cardiac muscle contraction hsa04260 79 21 2.63*10-12
Proteasome hsa03050 48 17 2.63*10-12
AOD-downregulated genes
Cytokine-cytokine receptor interaction hsa04060 267 8 5.69*10-07
Hematopoietic cell lineage hsa04640 88 5 5.93*10-06
Chemokine signaling pathway hsa04062 190 6 8.64*10-06
Regulation of actin cytoskeleton hsa04810 216 5 2.00*10-04
Graft-versus-host disease hsa05332 42 3 3.00*10-04
Jak-STAT signaling pathway hsa04630 155 4 6.00*10-04
Pathogenic Escherichia coli infection hsa05130 59 3 6.00*10-04
NOD-like receptor signaling pathway hsa04621 62 3 6.00*10-04
Toll-like receptor signaling pathway hsa04620 101 3 2.10*10-04
Prion diseases hsa05020 35 2 3.70*10-04
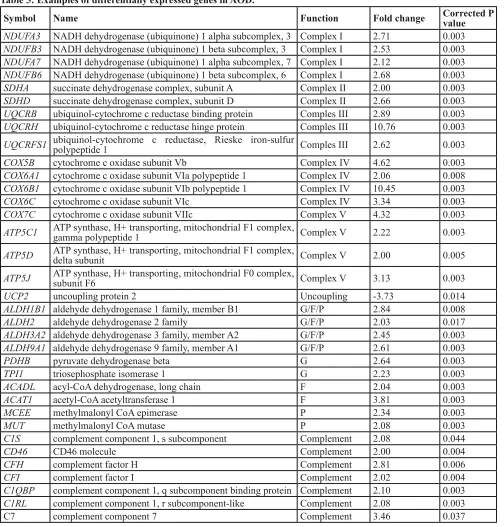
[image:6.612.72.537.371.652.2]table 5: examples of differentially expressed genes in Aod.
symbol name Function Fold change corrected P value
NDUFA3 NADH dehydrogenase (ubiquinone) 1 alpha subcomplex, 3 Complex I 2.71 0.003 NDUFB3 NADH dehydrogenase (ubiquinone) 1 beta subcomplex, 3 Complex I 2.53 0.003 NDUFA7 NADH dehydrogenase (ubiquinone) 1 alpha subcomplex, 7 Complex I 2.12 0.003 NDUFB6 NADH dehydrogenase (ubiquinone) 1 beta subcomplex, 6 Complex I 2.68 0.003 SDHA succinate dehydrogenase complex, subunit A Complex II 2.00 0.003 SDHD succinate dehydrogenase complex, subunit D Complex II 2.66 0.003 UQCRB ubiquinol-cytochrome c reductase binding protein Comples III 2.89 0.003 UQCRH ubiquinol-cytochrome c reductase hinge protein Comples III 10.76 0.003 UQCRFS1 ubiquinol-cytochrome c reductase, Rieske iron-sulfur polypeptide 1 Comples III 2.62 0.003 COX5B cytochrome c oxidase subunit Vb Complex IV 4.62 0.003 COX6A1 cytochrome c oxidase subunit VIa polypeptide 1 Complex IV 2.06 0.008 COX6B1 cytochrome c oxidase subunit VIb polypeptide 1 Complex IV 10.45 0.003 COX6C cytochrome c oxidase subunit VIc Complex IV 3.34 0.003 COX7C cytochrome c oxidase subunit VIIc Complex V 4.32 0.003 ATP5C1 ATP synthase, H+ transporting, mitochondrial F1 complex, gamma polypeptide 1 Complex V 2.22 0.003
ATP5D ATP synthase, H+ transporting, mitochondrial F1 complex, delta subunit Complex V 2.00 0.005
ATP5J ATP synthase, H+ transporting, mitochondrial F0 complex, subunit F6 Complex V 3.13 0.003
UCP2 uncoupling protein 2 Uncoupling -3.73 0.014
ALDH1B1 aldehyde dehydrogenase 1 family, member B1 G/F/P 2.84 0.008
ALDH2 aldehyde dehydrogenase 2 family G/F/P 2.03 0.017
ALDH3A2 aldehyde dehydrogenase 3 family, member A2 G/F/P 2.45 0.003 ALDH9A1 aldehyde dehydrogenase 9 family, member A1 G/F/P 2.61 0.003
PDHB pyruvate dehydrogenase beta G 2.64 0.003
TPI1 triosephosphate isomerase 1 G 2.23 0.003
ACADL acyl-CoA dehydrogenase, long chain F 2.04 0.003
ACAT1 acetyl-CoA acetyltransferase 1 F 3.81 0.003
MCEE methylmalonyl CoA epimerase P 2.34 0.003
MUT methylmalonyl CoA mutase P 2.08 0.003
C1S complement component 1, s subcomponent Complement 2.08 0.044
CD46 CD46 molecule Complement 2.00 0.004
CFH complement factor H Complement 2.81 0.006
CFI complement factor I Complement 2.02 0.004
C1QBP complement component 1, q subcomponent binding protein Complement 2.10 0.003 C1RL complement component 1, r subcomponent-like Complement 2.08 0.003
C7 complement component 7 Complement 3.46 0.037
in AOD samples were distinct to those identified in AAA samples. In AOD, the most significant KEGG categories representing upregulated genes were metabolic pathways (hsa01100; P = 1.49*10-43) and oxidative phosphorylation
(hsa00190; P = 5.68*10-35). Downregulated genes
primarily fell into the immune response categories such as cytokine-cytokine receptor interaction (hsa04060; P = 5.69-07) and chemokine signaling pathways (hsa04062; P
= 8.64*10-06) as seen in Table 4.
differentially expressed genes in Aod
Inspection of genes within KEGG metabolic categories revealed upregulation of genes related to mitochondrial biogenesis that included many members of all five mitochondrial respiratory and ATP production complexes (Table 5). We also demonstrated the upregulation of numerous genes involved in glycolysis/ gluconeogenesis, fatty acid metabolism, and propanoate metabolism (Table 5). Several complement system genes were overexpressed such as C1S (2.08-fold, P = 0.044), CD46 (2.00-fold, P = 0.004), CFH (2.81-fold, P = 0.006), CFI (2.02-fold, P = 0.004), C1QBP (2.10-fold, P = 0.003), C1RL (2.08-fold, P = 0.003), and C7 (3.46-fold, P = 0.037). One important mitochondrial regulatory gene called mitochondrial uncoupling protein 2 (UCP2) was downregulated in AOD samples (-3.73-fold, P =
0.014), (Table 5). The UCP2 gene was selected for further validation with quantitative real-time PCR.
real time Pcr
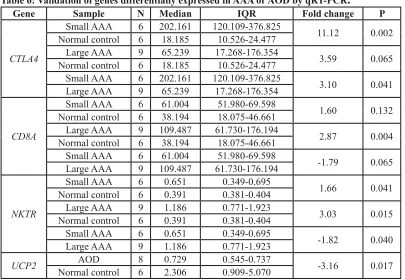
[image:8.612.99.504.55.335.2]Expression levels of a number of genes were validated in biopsies from the six patients with small AAAs, nine patients with large AAAs, eight patients with AOD and six controls (Table 1). The relative expression of CTLA4 was significantly increased in small AAA but not large AAA biopsies compared to normal controls (Table 6). Median relative expression of CTLA4 was also markedly increased in small AAA versus large AAA biopsies (202.161 vs. 65.239, P = 0.041). The relative expression of CD8A was significantly increased in large AAA but not small AAA biopsies compared to normal controls (Table 6), with the median relative expression of CD8A in large AAA ~2-fold higher and approaching significance compared to small AAA (109.489 vs 61.004; P = 0.065). Correspondingly, immunohistochemical examination of AAA tissue demonstrated marked presence of CD8-positive T lymphocytes within the adventitia and outer media of a large (82mm) AAA (Figure 2A) with limited immunostaining for CTLA4 (Figure 2C). In contrast there was relatively sparse presence of CD8-positive T cells within tissue from a small (55mm) AAA (Figure 2B) but marked CTLA4 staining around tertiary
table 6: Validation of genes differentially expressed in AAA or Aod by qrt-Pcr
.
Gene sample n Median IQr Fold change P
CTLA4
Small AAA 6 202.161 120.109-376.825 11.12 0.002 Normal control 6 18.185 10.526-24.477
Large AAA 9 65.239 17.268-176.354 3.59 0.065 Normal control 6 18.185 10.526-24.477
Small AAA 6 202.161 120.109-376.825 3.10 0.041 Large AAA 9 65.239 17.268-176.354
CD8A
Small AAA 6 61.004 51.980-69.598 1.60 0.132 Normal control 6 38.194 18.075-46.661
Large AAA 9 109.487 61.730-176.194 2.87 0.004 Normal control 6 38.194 18.075-46.661
Small AAA 6 61.004 51.980-69.598 -1.79 0.065 Large AAA 9 109.487 61.730-176.194
NKTR
Small AAA 6 0.651 0.349-0.695 1.66 0.041 Normal control 6 0.391 0.381-0.404
Large AAA 9 1.186 0.771-1.923 3.03 0.015 Normal control 6 0.391 0.381-0.404
Small AAA 6 0.651 0.349-0.695 -1.82 0.040 Large AAA 9 1.186 0.771-1.923
UCP2 Normal controlAOD 86 0.7292.306 0.545-0.7370.909-5.070 -3.16 0.017
lymphoid tissue at the media-adventia border (Figure 2D). Median relative expression of NKTR was significantly greater in AAA biopsies compared to normal controls with approximately 2- (P = 0.041) and 3- (P = 0.015) fold increase for small and large AAAs, respectively (Table 6). Median relative expression of NKTR was also markedly increased in large AAA compared to small AAA biopsies (1.186 vs. 0.651, P = 0.040).
The relative expression of UCP2 was markedly decreased in AOD samples compared to normal controls (Table 6). In subjects with AOD the UCP2 mRNA expression was more than 3-fold lower compared to the control aortic biopsies (0.739 vs. 2.306, P = 0.017).
dIscussIon
Human AAA biopsies have been consistently shown to have intimal atheroma and historically AAAs have been considered to result from atherosclerosis [5, 6]. However the mechanisms involved in AAA development and its relationship with atherosclerosis remain controversial [4]. We determined the global gene expression profiles within biopsies of AAA and AOD using microarrays. The main finding from this study was that the genes differentially expressed in AAA and AOD were almost completely distinct, supporting the concept of separate developmental mechanisms underlying the pathogenesis of each disease [4]. With this in mind, global gene expression profiles associated with AAA and AOD will be further discussed separately.
AAA
A number of human and animal studies previously suggested a major role of immune responses in AAA pathogenesis [11-15] and the array findings for cytokines/ chemokines are in line with previous quantitative data [18]. Our results substantiate those findings, and more importantly, suggest also that small AAAs (≤ 55 mm) and large AAAs (> 55 mm) may have some distinct immunological characteristics. The most notable finding related to immunity was that the key T-cell regulatory gene called cytotoxic T-lymphocyte-associated protein 4 (CTLA4 or CD152) was exclusively found to be upregulated in small AAAs. Moreover, our data suggests excessive infiltration of CD8+ T-cells in biopsies from
large AAAs evidenced by the exclusive overexpression of the gene coding for the CD8A molecule and increased number of CD8+ T-cells found in these specimens. The upregulation of CTLA4 and CD8A in small AAA and large AAA, respectively, was confirmed by qRT-PCR and led us to hypothesize that downregulation of CTLA4 may represent a key mechanism in AAA progression which promotes excessive T-cell-driven immune responses in
large AAAs. This hypothesis is supported by our finding of marked downregulation of the CTLA4 mRNA and the protein product in large AAAs compared to small AAAs as determined by qRT-PCR and immunohistochemistry, respectively. CTLA4 is a cell surface molecule that can down-modulate and terminate T-cell adaptive immunity [19]. The CD8A molecule is a constituent of the CD8 antigen found on most cytotoxic T lymphocytes and acts as a co-receptor with the T-cell receptor (TCR). Previous immunohistochemical studies of human AAA have provided evidence that CD8+ T-cells infiltrating the aortic
wall express cytotoxic mediators such as perforins, which generate membrane damage [20]. Other studies have shown that immunosuppressive agents directed exclusively at T-cells are capable of reducing the expansion of experimental AAA [21] and reduce vascular inflammation and aortic wall content of several inflammatory cell types including cytotoxic T lymphocytes in human AAA [22]. Taken together, the manipulation of CTLA4 levels may represent a novel therapeutic strategy for AAAs but this need examining in other contexts e.g. animal models. The use of CTLA4-based biologic agents such as Abatacept (Orencia), a novel fusion protein of the Fc region of the immunoglobulin IgG1 and CTLA4 designed to down-regulate T-cells activity, is already under investigation as a potential therapy for other immunopathologies such as active rheumatoid arthritis [23-27]. Findings from the present study additionally demonstrate the upregulation of genes expressed by NK cells within large AAAs, such as natural killer cell group 7 sequence (NKG7) and natural killer-tumor recognition sequence (NKTR) genes; both involved in the TCR-independent innate immune responses. The latter was assessed and validated to be upregulated in large AAAs by qRT-PCR. It is possible that similar mechanisms involving the upregulation of innate immunity occur at some point between the late and end-stage of AAA. Findings suggest marked upregulation of the NKTR gene in large AAA compared to small AAA biopsies which is in accord with this hypothesis.
Aod
of genes involved in glycolysis, gluconeogenesis, fatty acid metabolism, and propanoate metabolism. Since the number of overlapping genes in these metabolic pathways is considerable, it would be reasonable to suggest that overexpression of these genes may simply represent a metabolic maladaptation to the excessive mitochondrial biogenesis, as members of these bioenergetic pathways are tightly coordinated transcriptionally [29-31]. Upregulation of genes related to glucose and fatty acids metabolism is highly relevant to AOD. The role of an impaired glucose tolerance and fatty acids metabolism in atherosclerosis is long-documented [32, 33]. Current evidence suggests that the ataxia telangiectasia mutated (ATM)/mammalian target of rapamycin (mTOR) signaling axis may play an important role in suppression of macrophage transformation into foam cells, thus limiting the formation of atherosclerotic plaques [34]. Interestingly, the old malaria drug Chloroquine (Aralen), a lysosomotropic agent that activates ATM signaling, was found to be capable of decreasing atherosclerosis and improving metabolic phenotype in mice [35]. The hypothesis that Chloroquine may also reduce atherosclerosis in humans is currently under investigation [36]. The mechanisms responsible for upregulation of genes involved in mitochondrial biogenesis are not evident in the current study; however, we did identify downregulation of the UCP2 gene in AOD samples. The UCP2 protein belongs to a group of mitochondrial transporters that create proton leaks across the inner mitochondrial membrane, thus uncoupling respiration from ATP synthesis [37]. Previous studies provide evidence that uncoupling by UCP2 downregulates the production of reactive oxygen species (ROS) in endothelial and smooth muscle cells [38-42], whereas the UCP2 deficiency is associated with enhanced ROS production in the endothelium of the aorta [43]. Excessive ROS production is known to contribute to the oxidative damage of mitochondria that needs to be repaired to maintain intact cellular mitochondrial content [44]. This process is accomplished via mitophagy (autophagy), a selective elimination of malfunctioning mitochondria, which must be balanced by mitochondrial biogenesis to meet tissue energy requirements [45]. It is possible that UCP2 deficiency may, in fact, indirectly lead to increased mitochondrial biogenesis, explaining the upregulation of genes related to the metabolic and oxidative phosphorylation pathways in AOD. Pathways related to inflammation were less evident amongst differentially expressed genes in AOD samples. We did demonstrate the upregulation of a number of complement regulatory and effectors genes, such as complement regulatory protein CD46, complement factor H (CFH), and complement factor I (CFI) suggesting potential involvement of the classical complement activation pathway in AOD. The overexpression of the complement component 7 (C7) gene, a constituent of the membrane attack complex (MAC), may indicate the culmination of
the alternative complement activation pathway in AOD. Findings are in line with previous studies that have suggested an important role for the complement system in mediating tissue injury and atherosclerosis after oxidative stress [46, 47].
limitation of the study
The current study has a number of limitations. The available sample size was relatively small especially for AOD although larger than any previously published microarrays using human aortic biopsies. In view of this limitation we sought to validate important findings in further groups of AAA and AOD biopsies. The assessment of independent samples helps to minimize the possibility that selection biases adversely affect the generalizability of the findings. Furthermore, we were able to obtain the aortic biopsies from advanced stage disease including AAAs measuring at least 50mm and patients needing aortic bypass for peripheral ischemia. Our findings therefore are difficult to relate to early stage vascular disease. The majority of available AAA and AOD biopsies were obtained from men limiting the relevance of our findings to AAA and AOD in women. Finally, the AOD patients were either younger (discovery group) or older (validation group) than their respective controls. In both particular comparisons of cases with controls, however, an important gene regulating mitochondrial biogenesis was found to be downregulated in AOD, suggesting that our findings are descriptive of the disease rather than age differences between cases and controls.
In conclusion, the current results demonstrate distinct gene expression profiles of AAA and AOD. The AAA transcriptome highlights an important mechanism controlling immune responses as opposed to the mitochondrial biogenesis pathways being predominantly associated with AOD pathology.
MAterIAls And Methods
A detailed description of all methods is presented in the online data supplement.
Patients
ethics committees of the Townsville Hospital, James Cook University, Royal Brisbane and Women’s Hospital, Medical Faculty at the Technical University Dresden, and Leiden University Medical Center and the protocol conformed to ethical guidelines of Declaration of Helsinki. All patients gave written informed consent.
Microarrays
Microarrays were performed using the Illumina HumanHT-12v4 Expression BeadChip® platform as
previously described [16]. The microarray data can be obtained at the Gene Expression Omnibus (GEO) database repository (GSE57691; http://www.ncbi.nlm.nih.gov/geo/ info/linking.html).
Analysis of array data
The raw data matrix extracted from BeadStudio was uploaded into the GeneSpring GX version 11.5.1 (Agilent Technologies Pty Ltd) software for downstream analysis as previously described [16]. We sought to identify genes with a 2-fold differential expression within the aortas of patients with small AAA, large AAA or AOD compared to donor abdominal aortas based on corrected p value < 0.05 by the Benjamini Hochberg false discovery rate (FDR) method and determined by non-parametric Mann–Whitney U test. Genes showing ≥ 2-fold differences in expression between groups were considered to be significantly differentially expressed.
Quantitative real-time reverse transcription polymerase chain reaction (qrt-Pcr)
Using total RNA obtained from a further 29 patients with small AAAs (n = 6), large AAAs (n = 9) and AOD (n = 8), and another 6 organ donor biopsies (validation group, Table 1) we assessed the validity of microarrays findings using qRT-PCR as described previously [16, 17]. Three genes associated with AAA (CTLA4, cytotoxic T-lymphocyte-associated protein 4; NKTR, natural killer cell triggering receptor; CD8A, CD8A molecule), and the uncoupling protein 2gene (UCP2) associated with AOD were chosen for further assessment. Mann–Whitney U test was performed to identify differences in expression levels of selected genes between small AAA, or large AAA, or AOD and control biopsies. Data are reported as median and interquartile range. All computations were performed using the SPSS statistical package v.17.0.2. Statistical significance was defined at the conventional 5% level.
Immunohistochemistry
CD8 and CTLA4 proteins were immunohistochemically detected on 5-µm thick paraffin sections of AAA tissue taken from the maximally dilated aneurysm body as previously described [17].
AcKnowledGeMents
Funding from the Queensland Government, National Health and Medical Research Council (IDs 1020955, 1021416, 1063476 and 1000967) and Townsville Hospital Private Practice Trust supported this work. JG holds a Practitioner Fellowship from the National Health and Medical Research Council, Australia (ID 1019921) and a Senior Clinical Research Fellowship from the Queensland Government. EB was supported by the National Heart Foundation of Australia (G09B4339). IH is a recipient from the Technical University of Dresden (Frauenhabilitationsstipendium der Medizinischen Fakultät Dresden), Germany. GG received funding from W. L. Gore & Associates Deutschland GmbH and Vascutek Deutschland GmbH.
conFlIcts oF Interests
The author(s) declare that they have no conflict of interests.
reFerences
1. Hirsch AT, Haskal ZJ, Hertzer NR, Bakal CW, Creager MA, Halperin JL, Hiratzka LF, Murphy WR, Olin JW, Puschett JB, Rosenfield KA, Sacks D, Stanley JC et al. ACC/AHA
Guidelines for the Management of Patients with Peripheral Arterial Disease (lower extremity, renal, mesenteric, and abdominal aortic): a collaborative report from the American Associations for Vascular Surgery/Society for Vascular Surgery, Society for Cardiovascular Angiography and Interventions, Society for Vascular Medicine and Biology, Society of Interventional Radiology, and the ACC/AHA Task Force on Practice Guidelines (writing committee to develop guidelines for the management of patients with peripheral arterial disease) summary of recommendations. J Vasc Interv Radiol. 2006; 17: 1383-1397.
2. Golledge J, Mitchell A, Greenhalgh RM, Davies AH. Systematic comparison of the early outcome of angioplasty and endarterectomy for symptomatic carotid artery disease. Stroke. 2000; 31: 1439-1443.
3. Froehlich JB, Mukherjee D, Avezum A, Budaj A, Kline-Rogers EM, López-Sendón J, Allegrone J, Eagle KA, Mehta
1123-1128.
4. Golledge J, Norman PE. Atherosclerosis and abdominal aortic aneurysm: cause, response, or common risk factors? Arterioscler Thromb Vasc Biol. 2010; 30: 1075-1077. 5. Golledge J, Muller J, Daugherty A, Norman P. Abdominal
aortic aneurysm: pathogenesis and implications for management. Arterioscler Thromb Vasc Biol. 2006; 26: 2605-2613.
6. Cornuz J, Sidoti Pinto C, Tevaearai H, Egger M. Risk
factors for asymptomatic abdominal aortic aneurysm: systematic review and meta-analysis of population-based screening studies. Eur J Public Health. 2004; 14: 343-349. 7. Diehm N, Baumgartner I. Determinants of aneurysmal
aortic disease. Circulation. 2009; 119: 2134-2135.
8. Chan EL, Belem P, Ciocca RG, Madsen D, Cody RP,
Mackenzie JW, Boyd CD, Graham AM. Incidence of cancer
and abdominal aortic aneurysms. A logistic regression analysis. Ann N Y Acad Sci. 1996; 800: 68-73.
9. Shteinberg D, Halak M, Shapiro S, Kinarty A, Sobol E, Lahat N, Karmeli R. Abdominal aortic aneurysm and aortic occlusive disease: a comparison of risk factors and
inflammatory response. Eur J Vasc Endovasc Surg. 2000;
20: 462-465.
10. Daugherty A, Cassis LA. Mouse models of abdominal aortic aneurysms. Arterioscler Thromb Vasc Biol. 2004; 24: 429-434.
11. Lenk GM, Tromp G, Skunca M, Gatalica Z, Berguer R,
Kuivaniemi H. Global expression profiles in human normal
and aneurysmal abdominal aorta based on two distinct whole genome microarray platforms. Ann N Y Acad Sci. 2006; 1085: 360-362.
12. Lenk GM, Tromp G, Weinsheimer S, Gatalica Z, Berguer
R, Kuivaniemi H. Whole genome expression profiling reveals a significant role for immune function in human
abdominal aortic aneurysms. BMC Genomics. 2007; 8: 237. 13. Choke E, Cockerill GW, Laing K, Dawson J, Wilson WR,
Loftus IM, Thompson MM. Whole genome-expression
profiling reveals a role for immune and inflammatory
response in abdominal aortic aneurysm rupture. Eur J Vasc Endovasc Surg. 2009; 37: 305-310.
14. Rush C, Nyara M, Moxon JV, Trollope A, Cullen B, Golledge J. Whole genome expression analysis within the
angiotensin II-apolipoprotein E deficient mouse model of
abdominal aortic aneurysm. BMC Genomics. 2009; 10: 298.
15. Spin JM, Hsu M, Azuma J, Tedesco MM, Deng A, Dyer
JS, Maegdefessel L, Dalman RL, Tsao PS. Transcriptional
profiling and network analysis of the murine angiotensin
II-induced abdominal aortic aneurysm. Physiol Genomics. 2011; 43: 993-1003.
16. Biros E, Moran CS, Rush CM, Gäbel G, Schreurs C, Lindeman JH, Walker PJ, Nataatmadja M, West M, Holdt LM, Hinterseher I, Pilarsky C, Golledge J. Differential gene expression in the proximal neck of human abdominal aortic
aneurysm. Atherosclerosis. 2014; 233: 211-218.
17. Biros E, Moran CS, Wang Y, Walker PJ, Cardinal J,
Golledge J. microRNA profiling in patients with abdominal aortic aneurysms: the significance of miR-155. Clin Sci
(Lond). 2014; 126: 795-803.
18. Lindeman JH, Abdul-Hussien H, Schaapherder AF, Van Bockel JH, Von der Thüsen JH, Roelen DL, Kleemann R. Enhanced expression and activation of
pro-inflammatory transcription factors distinguish aneurysmal
from atherosclerotic aorta: IL-6- and IL-8-dominated
inflammatory responses prevail in the human aneurysm.
Clin Sci (Lond). 2008; 114: 687-697.
19. Bluestone JA. Is CTLA-4 a master switch for peripheral T cell tolerance? J Immunol. 1997; 158: 1989-1993.
20. Henderson EL, Geng YJ, Sukhova GK, Whittemore AD, Knox J, Libby P. Death of smooth muscle cells and expression of mediators of apoptosis by T lymphocytes in human abdominal aortic aneurysms. Circulation. 1999; 99: 96-104.
21. Dobrin PB, Baumgartner N, Anidjar S, Chejfec G, Mrkvicka
R. Inflammatory aspects of experimental aneurysms. Effect
of methylprednisolone and cyclosporine. Ann N Y Acad Sci. 1996; 800: 74-88.
22. Lindeman JH, Abdul-Hussien H, van Bockel JH, Wolterbeek R, Kleemann R. Clinical trial of doxycycline for matrix metalloproteinase-9 inhibition in patients with an abdominal aneurysm: doxycycline selectively depletes aortic wall neutrophils and cytotoxic T cells. Circulation. 2009; 119: 2209-2216.
23. Takahashi N, Kojima T, Terabe K, Kaneko A, Kida D, Hirano Y, Fujibayashi T, Yabe Y, Takagi H, Oguchi T,
Miyake H, Kato T, Fukaya N et al. Clinical efficacy of
abatacept in Japanese rheumatoid arthritis patients. Mod Rheumatol. 2013; 23: 904-912.
24. Conaghan PG, Durez P, Alten RE, Burmester GR, Tak PP, Klareskog L, Catrina AI, Dicarlo J, Gaillez C, Le Bars
M, Zhou X, Peterfy C. Impact of intravenous abatacept on synovitis, osteitis and structural damage in patients with rheumatoid arthritis and an inadequate response to methotrexate: the ASSET randomised controlled trial. Ann Rheum Dis. 2013; 72: 1287-1294.
25. Matsubara T, Yamana S, Tohma S, Takeuchi T, Kondo
H, Kohsaka H, Ozaki S, Hashimoto H, Miyasaka N, Yamamoto A, Hiraoka M, Abe T. Tolerability and efficacy
of abatacept in Japanese patients with rheumatoid arthritis: a phase I study. Mod Rheumatol. 2013; 23: 634-645. 26. Genovese MC, Schiff M, Luggen M, LE Bars M, Aranda
R, Elegbe A, Dougados M. Longterm safety and efficacy
of abatacept through 5 years of treatment in patients with rheumatoid arthritis and an inadequate response to tumor necrosis factor inhibitor therapy. J Rheumatol. 2012; 39: 1546-1554.
27. von Kempis J, Dudler J, Hasler P, Kyburz D, Tyndall A,
arthritis. Swiss Med Wkly. 2012; 142: w13581.
28. Schapira AH, Cooper JM, Dexter D, Clark JB, Jenner
P, Marsden CD. Mitochondrial complex I deficiency in
Parkinson’s disease. J Neurochem. 1990; 54: 823-827. 29. Finck BN, Kelly DP. PGC-1 coactivators: inducible
regulators of energy metabolism in health and disease. J Clin Invest. 2006; 116: 615-622.
30. Handschin C, Spiegelman BM. Peroxisome proliferator-activated receptor gamma coactivator 1 coactivators, energy homeostasis, and metabolism. Endocr Rev. 2006; 27: 728-735.
31. Carrer M, Liu N, Grueter CE, Williams AH, Frisard MI, Hulver MW, Bassel-Duby R, Olson EN. Control of mitochondrial metabolism and systemic energy homeostasis by microRNAs 378 and 378. Proc Natl Acad Sci USA. 2012; 109: 15330-15335.
32. Wahlberg F. The intravenous glucose tolerance test in atherosclerotic disease with special reference to obestity hypertension, diabetic heredity and cholesterol values. Acta Med Scand. 1962; 171: 1-7.
33. Clair RW, Lofland HB, Clarkson TB. Composition and
synthesis of fatty acids in atherosclerotic aortas of the pigeon. J Lipid Res. 1968; 9: 739-747.
34. Le Guezennec X, Brichkina A, Huang YF, Kostromina
E, Han W, Bulavin DV. Wip1-dependent regulation of autophagy, obesity, and atherosclerosis. Cell Metab. 2012; 16: 68-80.
35. Schneider JG, Finck BN, Ren J, Standley KN, Takagi M,
Maclean KH, Bernal-Mizrachi C, Muslin AJ, Kastan MB,
Semenkovich CF. ATM-dependent suppression of stress signaling reduces vascular disease in metabolic syndrome. Cell Metab. 2006; 4: 377-389.
36. Razani B, Feng C, Semenkovich CF. p53 is required for
chloroquine-induced atheroprotection but not insulin
sensitization. J Lipid Res. 2010; 51: 1738-1746.
37. Pecqueur C, Couplan E, Bouillaud F, Ricquier D. Genetic and physiological analysis of the role of uncoupling proteins in human energy homeostasis. J Mol Med. 2001; 79: 48-56.
38. Nègre-Salvayre A, Hirtz C, Carrera G, Cazenave R,
Troly M, Salvayre R, Penicaud L, Casteilla L. A role for uncoupling protein-2 as a regulator of mitochondrial hydrogen peroxide generation. FASEB J. 1997; 11: 809-815.
39. Arsenijevic D, Onuma H, Pecqueur C, Raimbault S, Manning BS, Miroux B, Couplan E, Alves-Guerra MC, Goubern M, Surwit R, Bouillaud F, Richard D, Collins S et al. Disruption of the uncoupling protein-2 gene in mice reveals a role in immunity and reactive oxygen species production. Nat Genet. 2000; 26: 435-439.
40. Blanc J, Alves-Guerra MC, Esposito B, Rousset S, Gourdy P, Ricquier D, Tedgui A, Miroux B, Mallat Z. Protective role of uncoupling protein 2 in atherosclerosis. Circulation. 2003; 107: 388-390.
41. Lee KU, Lee IK, Han J, Song DK, Kim YM, Song HS,
Kim HS, Lee WJ, Koh EH, Song KH, Han SM, Kim MS, Park IS et al. Effects of recombinant adenovirus-mediated uncoupling protein 2 overexpression on endothelial function and apoptosis. Circ Res. 2005; 96: 1200-1207.
42. Park JY, Park KG, Kim HJ, Kang HG, Ahn JD, Kim HS, Kim YM, Son SM, Kim IJ, Kim YK, Kim CD, Lee KU, Lee IK. The effects of the overexpression of recombinant uncoupling protein 2 on proliferation, migration and plasminogen activator inhibitor 1 expression in human vascular smooth muscle cells. Diabetologia. 2005; 48: 1022-1028.
43. Tian XY, Wong WT, Xu A, Lu Y, Zhang Y, Wang L, Cheang WS, Wang Y, Yao X, Huang Y. Uncoupling protein-2 protects endothelial function in diet-induced obese mice. Circ Res. 2012; 110: 1211-1216.
44. Rhoads DM, Umbach AL, Subbaiah CC, Siedow JN. Mitochondrial reactive oxygen species. Contribution to oxidative stress and interorganellar signaling. Plant Physiol. 2006; 141: 357-366.
45. Gottlieb RA, Carreira RS. Autophagy in health and disease. 5. Mitophagy as a way of life. Am J Physiol Cell Physiol. 2010; 299: C203-C210.
46. Collard CD, Väkevä A, Morrissey MA, Agah A, Rollins SA, Reenstra WR, Buras JA, Meri S, Stahl GL. Complement activation after oxidative stress: role of the lectin complement pathway. Am J Pathol. 2000; 156: 1549-1556.