Available online
www.jocpr.com
Journal of Chemical and Pharmaceutical Research, 2016, 8(2):428-442
Research Article
CODEN(USA) : JCPRC5
ISSN : 0975-7384
Fluid-Solid interaction modeling of cerebrospinal fluid absorption in
arachnoid villi
M. Y. Abdollahzadeh Jamalabadi
*1,2and A. J. Keikha
21Department of Mechanical, Robotics and Energy Engineering, Dongguk University, 30 Pildong-ro 1gil, Jung-gu,
Seoul, Republic of Korea
2Chabahar Maritime University, Chabahar, Iran
_____________________________________________________________________________________________
ABSTRACT
As stated by the customary hypothesis, the cerebrospinal fluid (CSF) is secreted inside the brain ventricles and flows unidirectional along subarachnoid spaces to be absorbed into venous sinuses across arachnoid villi and via para-neural sheaths of nerves into lymphatics. Diffusion across the arachnoid granulations one-way valves into the superior sagittal sinus returns CSF to the venous circulation. Absorption of CSF into venous sinuses across arachnoid villi under the physiological pressure is considered here by means of considering fluid motion and solid response of arachnoid villi to them. A Fluid-Solid Interaction (FSI) model is constructed to simulate CSF flow. A comparison of the results and the experimental data was done. The previous rigid models have ignored the CFS interaction with arachnoid villi. In this computational fluid dynamic (CFD) analysis, the CSF pressure and flow velocity in different areas were concordant with the experimental data.
Keywords: arachnoid villi; cerebrospinal fluid; Magnetic field; Fluid-Solid interaction
_____________________________________________________________________________________________
INTRODUCTION
M. Y. Abdollahzadeh Jamalabadiand A. J. Keikha J. Chem. Pharm. Res., 2016, 8(2):428-442
______________________________________________________________________________
Fig. 1.The cerebrospinal fluid (CSF) circulates in the subarachnoid space around the brain and spinal cord
M. Y. Abdollahzadeh Jamalabadiand A. J. Keikha J. Chem. Pharm. Res., 2016, 8(2):428-442
[image:3.595.78.536.66.376.2]______________________________________________________________________________
Fig. 2.Anatomy of cranial CSF spaces (Volume of brain= 1400 ml; Volume of CSF= 150ml; CSF in ventricles around 25 ml;Volume of blood= 150 ml; Total volume of cerebrospinal fluid (adult) = 125-150 ml (infant) = 50 ml; Turnover of entire volume of cerebrospinal fluid = 3 to 4 times per day; Rate of production of CSF = 0.35 ml/min (500 ml/day); pH of cerebrospinal fluid = 7.33) [from Kandel et al.,
2000, p. 1296]
The total volume of CSF is 150 mls. The daily production is 550 mls/day so the CSF turns over about 3 to 4 times per day. The CSF is formed by the choroid plexus (50%) and directly from the walls of the ventricules (50%). CSF flows through the foramens of Magendie & Luschka into the subarachnoid space of the brain and spinal cord. It is absorbed by the arachnoid villi (90%) and directly into cerebral venules (10%).The normal intracerebral pressure (ICP) is 5 to 15 mmHg. The rate of formation of CSF is constant and is not affected by ICP. Absorption of CSF
increases linearly as pressure rises above about 7 cmsH2O pressure. At a pressure of about 11cmsH2O, the rate of
secretion & absorption are equal. The CSF has a composition identical to that of the brain ECF but this is different from plasma. The major differences from plasma are:
• The pCO2 is higher (50 mmHg) resulting in a lower CSF pH (7.33)
• The protein content is normally very low (0.2g/l) resulting in a low buffering capacity
• The glucose concentration is lower
• The chloride concentration is higher
M. Y. Abdollahzadeh Jamalabadiand A. J. Keikha J. Chem. Pharm. Res., 2016, 8(2):428-442
[image:4.595.86.525.60.447.2]______________________________________________________________________________
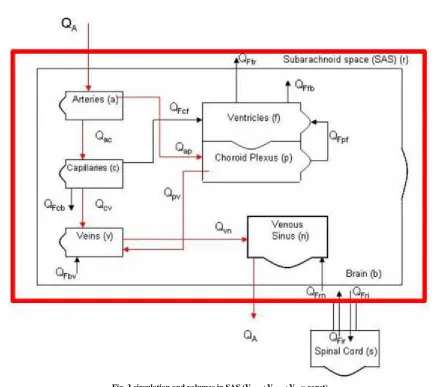
Fig. 3.circulation and volumes in SAS (Vbrain+Vblood+Vcsf= const)
There are no lymphatic channels in the brain and CSF fulfils the role of returning interstitial fluid and protein to the circulation. The CSF is separated from blood by the blood-brain barrier. Only lipid soluble substances can easily cross this barrier and this is important in maintaining the compositional differences.
[image:4.595.86.527.514.734.2]M. Y. Abdollahzadeh Jamalabadiand A. J. Keikha J. Chem. Pharm. Res., 2016, 8(2):428-442
______________________________________________________________________________
Fig. 5.pulsatile CSF flow (Aqueductal CSF Velocity= 10 cm/sec ; Cervical blood Velocity=80 cm/sec; Cervical CSF Velocity = 5 cm/sec)
EXPERIMENTAL SECTION
The cerebrospinal fluid (CSF) is produced from arterial blood by the choroid plexuses of the lateral and fourth ventricles by a combined process of diffusion, pinocytosis and active transfer. A small amount is also produced by ependymal cells. The choroid plexus consists of tufts of capillaries with thin fenestrated endothelial cells. These are covered by modified ependymal cells with bulbous microvilli. The total volume of CSF in the adult ranges from140 to 270 ml. The volume of the ventricles is about 25 ml. CSF is produced at a rate of 0.2 - 0.7 ml per minute or 600-700 ml per day. The circulation of CSF is aided by the pulsations of the choroid plexus and by the motion of the cilia of ependymal cells. CSF is absorbed across the arachnoid villi into the venous circulation and a significant amount probably also drains into lymphatic vessels around the cranial cavity and spinal canal. The arachnoid villi act as one-way valves between the subarachnoid space and the dural sinuses. The rate of absorption correlates with the CSF pressure. CSF acts as a cushion that protects the brain from shocks and supports the venous sinuses (primarily the superior sagittal sinus, opening when CSF pressure exceeds venous pressure). It also plays an important role in the homeostasis and metabolism of the central nervous system. CSF from the lumbar region contains 15 to 45 mg/dl protein (lower in children) and 50-80 mg/dl glucose (two-thirds of blood glucose). Protein concentration in cisternal and ventricular CSF is lower. Normal CSF contains 0-5 mononuclear cells. The CSF pressure, measured at lumbar puncture (LP), is 100-180 mm of H2O (8-15 mm Hg) with the patient lying on the side and 200-300 mm with the patient sitting up.
The brain produces roughly 500 mL of cerebrospinal fluid per day. This fluid is constantly reabsorbed, so that only 100-160 mL is present at any one time. Ependymal cells of the choroid plexus produce more than two thirds of CSF. The choroid plexus is a venous plexus contained within the four ventricles of the brain, hollow structures inside the brain filled with CSF. The remainder of the CSF is produced by the surfaces of the ventricles and by the lining surrounding the subarachnoid space[1].
M. Y. Abdollahzadeh Jamalabadiand A. J. Keikha J. Chem. Pharm. Res., 2016, 8(2):428-442
______________________________________________________________________________
Fig. 6.Vials containing human cerebrospinal fluid
It had been thought that CSF returns to the vascular system by entering the Dural venous sinuses via the arachnoid granulations (or villi). However, some [3] have suggested that CSF flow along the cranial nerves and spinal nerve roots allow it into the lymphatic channels; this flow may play a substantial role in CSF reabsorption, in particular in the neonate, in which arachnoid granulations are sparsely distributed. The flow of CSF to the nasal submucosal lymphatic channels through the cribriform plate seems to be especially important [4].The CSF is created from blood plasma and is largely similar to it, except that CSF is nearly protein-free compared with plasma and has some modified electrolyte levels. CSF contains approximately 0.3% plasma proteins, or approximately 15 to 40 mg/dL, depending on sampling site [5] and it is produced at a rate of 500 ml/day. Since the subarachnoid space around the brain and spinal cord can contain only 135 to 150 ml, large amounts are drained primarily into the blood through arachnoid granulations in the superior sagittal sinus. Thus the CSF turns over about 3.7 times a day. This continuous flow into the venous system dilutes the concentration of larger, lipid-insoluble molecules penetrating the brain and CSF[6]. Healthy cerebrospinal fluid is free of red blood cells, and at most contains only a few white blood cells. Any cell count higher than that constitutes pleocytosis, an excess of cells. CSF pressure, as measured by lumbar puncture
(LP), is 10-18 cmH2O (8-15 mmHg or 1.1-2 kPa) with the patient lying on the side and 20-30 cmH2O (16-24 mmHg
or 2.1-3.2 kPa) with the patient sitting up [8]. In newborns, CSF pressure ranges from 8 to 10 cmH2O (4.4–7.3
M. Y. Abdollahzadeh Jamalabadiand A. J. Keikha J. Chem. Pharm. Res., 2016, 8(2):428-442
[image:7.595.112.497.67.449.2]______________________________________________________________________________
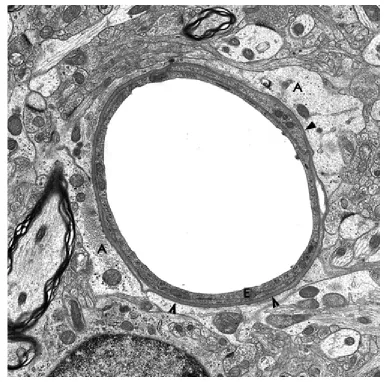
Fig. 7.Brain capillary. A:astrocytic processes; E:endothelium; Arrow heads: vasular basement membrane
M. Y. Abdollahzadeh Jamalabadiand A. J. Keikha J. Chem. Pharm. Res., 2016, 8(2):428-442
[image:8.595.107.503.66.353.2]______________________________________________________________________________
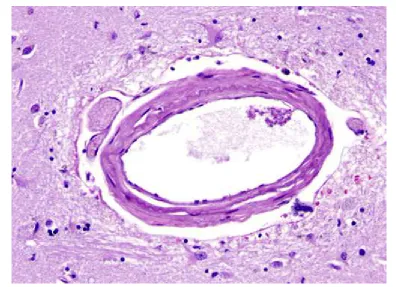
Fig. 8.Perivascular (Virchow-Robin) space around a small artery. The VRS is exaggerated in paraffin-processed specimens
The outer surface of this perivascular space (PVS) is formed by the glia limitans. The inner surface is the vascular basement membrane. Postcapillary venules are also surrounded by a PVS. The PVS that surrounds postcapillary venules is the portal of entry of leukocytes into the brain in the normal state and during inflammation. Circulating monocytes and lymphocytes normally traverse postcapillary venules and enter the PVS. In the course of inflammation, such as MS, this entry is increased because of leukocyte interactions with inflamed endothelial cells. Furthermore, leukocytes penetrate the glia limitans and enter into the CNS. The latter move is facilitated by matrix metalloproteinases (MMPs) produced by macrophages, which loosen the glia limitans.
Table 1. Characteristics of CSF
Substance Cerebrospinal Fluid
Water Content (%) 99
Protein (mg/dL) 35
Glucose (mg/dL) 60
Osmolarity (mOsm/L) 295
Sodium (mEq/L) 138
Potassium (mEq/L) 2.8
Calcium (mEq/L) 2.1
Magnesium (mEq/L) 0.3
Chloride (mEq/L) 119
pH 7.33
The main equations for CSF-flow are provided in vector type by equations (1) and (2) as shown below. The governing equations are:
= 0 (1)
̅ = (2)
where ̅ is the material derivative, is the velocity, ρ is the density,C is the specific heat, J is the current density,
"is the radiative heat, B is the total magnetic field (the induced magnetic field assumed negligible) , T is
temperature ,and is the Cauchy stress tensor. The constitutive equation for in a third order fluid is
[image:8.595.230.383.485.592.2]M. Y. Abdollahzadeh Jamalabadiand A. J. Keikha J. Chem. Pharm. Res., 2016, 8(2):428-442
______________________________________________________________________________
=µ + !+ " "+ # $+ #"( ! + !) + #%& ' "( (4)
In the FSI model, brain parenchyma is modeled like a linear elastic substance in contact with CSF fluid and for mathematical modeling the Arbitrary-Lagrangian Eulerian (abbreviated as ALE) formulation is applied to be like the prevailing rule.
RESULTS AND DISCUSSION
This section introduces the results of the computer predictions for the interactions of all cerebral compartments. The emphasis lies on comparing the differences between normal and hydrocephalic cases to highlight pathological changes and offer to mechanistic explanations. In both the rigid and the FSI models, the stream is implicit to be laminar, along with CSF is considered Newtonian, viscous and incompressible. The conservation balances result to a structure of biased differential equations referred to as continuity as well as the Navier-Stokes equations. The inflow is the CSF production from choroid plexus lateral ventricle and the third ventricles. The outflow is from the Luschka and Magendie foramina and considered to have zero pressure to obtain the pressure distribution. The immense production is as a result of CSF production in the choroid plexus which is a pulsatile generation due to the arterioles pulsation in choroid plexus synchronized with the heartbeat. The rate of recurrence of the pulsatile movement is put to 1 Hz (approximating kin to the usual cardiac cycle). For simplification, we considered a relative pressure (zero value) at the end of Magendie foramina.
[image:9.595.167.447.610.730.2]The outcomes of the CSF-analysis are the flow-rate, velocities, as well as ICP-gradients of CSF in the ventricular-system. In addition, obtaining the lateral ventricular displacement and stress distribution in solid part are the parameters which were calculated in the deformable model. Our study not only considered rigid boundary condition but also the surrounding flexible brain tissue interaction effect with pulsatile inflow. The previous simulation results were based on rigid boundary condition for the walls of ventricles. Linninger (Ursino, 1988) modeled the brain effects as a rigid porous media. His investigation showed the necessity of considering surrounding tissue interaction with CSF flow pattern. The brain tissue is a solid material and in some research works has been modeled as an elastic material (Balédent et al., 2004). Also, Fin compared the rigid and deformable models for aqueduct. However, his model considered a solid thickness for the aqueduct wall instead of whole parenchyma interaction without considering the pulsatile in flow. In later publications, Cheng et al. (Yoo et al., 2012) considered the effect of parenchyma as an elastic membrane with different elastic properties and different portions and applying the arbitrary load and reproducing the pulsatile nature of CSF flow. Though 2D models provide a quantitative simulation of CSF flow in the ventricles, the qualitative results provided through such models are more reliable. A more realistic 3D model of HVS geometry though seems to yield more accurate results, is a complex and cumbersome task which has not been seen in recent literature. We propose that CSF flow and interaction of the parenchyma to be modeled in a 3D pattern for future studies. Another shortcoming in our modeling is that the brain parenchyma is treated as an elastic material, causing the ventricular walls to return to their previous position after each pulsation. However, as the work of Miller and coworkers (Yoo et al., 2012) has shown, the mechanical behavior of the brain tissue is more appropriately explained with visco-elastic or non-linear hyper elastic models. Another probable pitfall in our 2D model is that the SAS chamber and diffusion of CSF into the venous sinuses has not been considered, which does not seem to be a major obstacle considering the recent advances in CFD software package. Efforts are underway to extend the model presented here in to a 3D model of brain ventricle, SAS and parenchyma, capable of describing the absolute pressure in HVS system. Also we have not considered brain arterial pulsations in our model. The effect of this can be considered for future study.
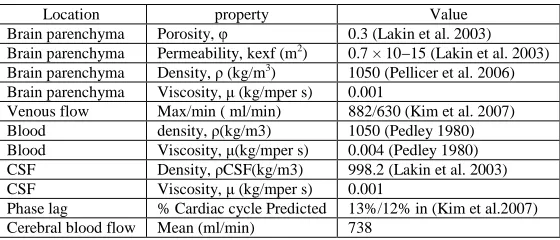
Table 2. Material properties for the bi-phasic model of intracranial dynamics
Location property Value
Brain parenchyma Porosity, φ 0.3 (Lakin et al. 2003)
Brain parenchyma Permeability, kexf (m2) 0.7 × 10⁻¹⁵ (Lakin et al. 2003)
M. Y. Abdollahzadeh Jamalabadiand A. J. Keikha J. Chem. Pharm. Res., 2016, 8(2):428-442
[image:10.595.107.496.66.542.2]______________________________________________________________________________
Fig. 9.Real schematic of problem
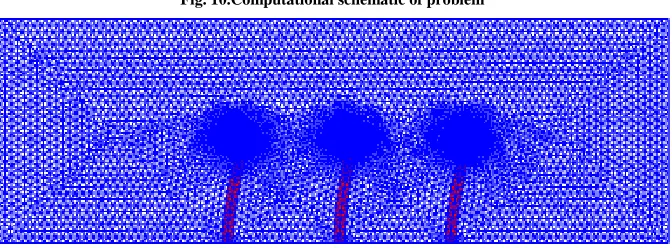
[image:10.595.153.457.74.342.2]Fig. 10.Computational schematic of problem
[image:10.595.140.476.531.655.2]M. Y. Abdollahzadeh Jamalabadiand A. J. Keikha J. Chem. Pharm. Res., 2016, 8(2):428-442
[image:11.595.91.479.63.572.2]______________________________________________________________________________
[image:11.595.141.470.75.188.2]Fig. 12.Velocity magnitude contour and streamline at t= 0.001 (s)
[image:11.595.135.472.215.332.2]Fig. 13.Velocity magnitude contour and streamline at t= 0.07 (s)
Fig. 14.Velocity magnitude contour and streamline at t= 0.17 (s)
[image:11.595.138.473.360.471.2] [image:11.595.132.474.497.740.2]M. Y. Abdollahzadeh Jamalabadiand A. J. Keikha J. Chem. Pharm. Res., 2016, 8(2):428-442
[image:12.595.142.470.89.198.2]______________________________________________________________________________
Fig. 17.Velocity magnitude contour and streamline at t= 4 (s)
Fig. 18.Pressure field at t= 0.001 (s)
Fig. 19.Pressure field at t= 0.005 (s)
[image:12.595.139.473.216.753.2]M. Y. Abdollahzadeh Jamalabadiand A. J. Keikha J. Chem. Pharm. Res., 2016, 8(2):428-442
[image:13.595.129.476.67.610.2]______________________________________________________________________________
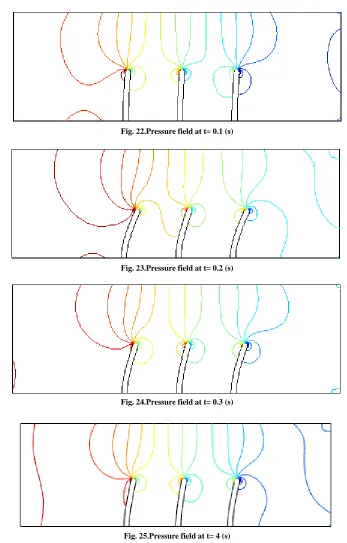
Fig. 22.Pressure field at t= 0.1 (s)
Fig. 23.Pressure field at t= 0.2 (s)
Fig. 24.Pressure field at t= 0.3 (s)
M. Y. Abdollahzadeh Jamalabadiand A. J. Keikha J. Chem. Pharm. Res., 2016, 8(2):428-442
[image:14.595.81.533.61.394.2]______________________________________________________________________________
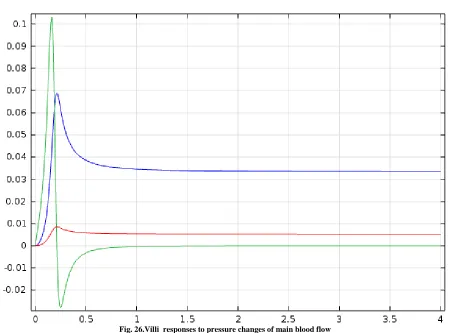
Fig. 26.Villi responses to pressure changes of main blood flow
We have developed a model for intracranial dynamics in which the interactions of all compartments are quantified by fundamental mass and force conservation balances. Under normal conditions, CSF motion is produced by the vascular expansion and pulsatile brain deformation. Since the parenchyma is incompressible, its deformation is passed on to the ventricles, forcing CSF displacement from the confined cranium into the spinal canal. The Monro-Kellie doctrine is fully satisfied in our model and we have predicted a CSF displacement into the spinal canal of about 0.9 ml in each cardiac cycle. For normal dynamics, the pulsations of the lateral ventricles as well as the amplitudes and pressure gradients of arteries, arterioles, capillaries, veinules and veins can be calculated. It is important to recognize that in simulating communicating hydrocephalus we have simplified the situation for analysis. Firstly, the model does not divide the cerebral subarachnoid space into compartments. Quite likely some forms of hydrocephalus are caused by adsorption blocks at the arachnoid granulations and others by more proximal blocks at the base of the brain. These two situations cannot be distinguished in the current state of the model so the volume changes and pressure in the single cerebral subarachnoid space may be different from what actually occurs. The model, as it stands, predicts that the cerebral subarachnoid space is slightly increased with hydrocephalus. Clinical MRI observations, on the other hand, show a decrease in subarachnoid space in communicating hydrocephalus. MRI measurements need to be quantified in cases of acute hydrocephalus, and our model needs further spatial development to account for changes of the parenchymal cell matrix.
CONCLUSION
M. Y. Abdollahzadeh Jamalabadiand A. J. Keikha J. Chem. Pharm. Res., 2016, 8(2):428-442
______________________________________________________________________________
REFERENCES
[1] MY AbdollahzadehJamalabadi, J Porous Media, 2015, 18( 9) ,843-860. [2] MY AbdollahzadehJamalabadi, Int J Opt Appl, 2015, 5 (5) , 161-167 [3] MY AbdollahzadehJamalabadi, ChemEng Res Des, 2015, 102 , 407-415
[4]MY AbdollahzadehJamalabadi; JH Park ; CY Lee, entropy, 2015, 17 (2), 866-881
[5] Martini, Timmons, Tallitsch, Frederick, Michael, Robert ,2015, Human Anatomy (Eighth ed.). Boston: Pearson. p. 453.
[6] L. F. Edwards ,1934, Anatomy for physical education, descriptive and applied. [7] H. Morris ,1921, Morris's human anatomy.
[8] Sampson, J.H., Brady, M.L., Petry, N.A., Croteau, D., Friedman, A.H., Friedman, H.S., Wong, T., Bigner, D.D., Pastan, I., Puri, R.K., and Pedain, C., 2007, Neurosurgery, 60(2),89-98.
[9] Roberts, T.P.L., 1997, J. Magn. Reson. Imaging, 7(1), 82-90.
[10] Strich, G., Hagan, P.L., Gerber, K.H., and Slutsky, R.A., 1985, Radiology,154(3), 723-726. [11] Stanisz, G.J. and Henkelman, R.M., 2000, Magn. Reson. Med., 44(5), 665-667.
[12] Gurbanova, A.A., Aker, R., Berkman, K., Onat, F.Y., van Rijn, C.M., and van Luijtelaar, G., 2006, Br. J.
Pharmacol., 148(8), 1076-1082.
[13] Sarntinoranont, M., Banerjee, R.K., Lonser, R.R., and Morrison, P.F., 2003, Ann. Biomed. Eng., 31(4), 448-461.
[14] McGuire, S., Zaharoff, D., and Yuan, F., 2006, Ann. Biomed. Eng., 34(7), 1173-1181.
[15] Sarntinoranont, M., Chen, X.M., Zhao, J.B., and Mareci, T.H., 2006, Ann. Biomed. Eng., 34(8), 1304-1321. [16] Chen, X.M., Dunn, A.C., Sawyer, W.G., and Sarntinoranont, M., 2007, J. Biomech. Eng.-Trans.ASME, 129(2), 156-163.
[17] Nicolson, P.C. and Vogt, J., 2001, Biomaterials, 22, 3273-3283.
[18] Yang, W.-H., Smolen, V.F., and Peppas, N.A., 1981, J. Membrane Sci., 9, 53-67. [19] Jones, L.W. and Jones, D.A., 2000, Butterworth-Heinemann.
[20] Holden, B.A., Stephenson, A., Stretton, S., Sankaridurg, P.R., O'Hare, N., Jalbert, I., and Sweeney, D.F., 2001,
Optometry and Vision Science, 78(1), 9-12.
[21] Kikkawa, Y., Soft Contact Lens Kinetics, in Contact Lens Practice, Ruben, M. and Guillon, M., Editors. 1994, Chapman & Hall. p. 113-121.
[22] Hinkley, J.A., Morgret, L.D., and Gehrke, S.H., 2004, Polymer, 45(26), 8837-8843. [23] Drury, J.L., Dennis, R.G., and Mooney, D.J., 2004, Biomaterials, 25(16), 3187-3199.
[24] Stammen, J.A., Williams, S., Ku, D.N., and Guldberg, R.E., 2001, Biomaterials, 22(8), 799-806. [25] Marra, S.P., Ramesh, K.T., and Douglas, A.S., 2001, Mat. Sci. Eng. C-Bio. S., 14(1-2), 25-34. [26] Anseth, K.S., Bowman, C.N., and BrannonPeppas, L., 1996, Biomaterials, 17(17), 1647-1657. [27] Yasuda, H., Lamaze, C.E., and Peterlin, A., 1971, J. Polym. Sci. A2, 9(6),pp. 1117-1131. [28] Refojo, M.F., 1965, J. Appl. Polym. Sci., 9(10), pp. 3417-3426.
[29] Chiarelli, P., Basser, P.J., Derossi, D., and Goldstein, S., 1992, Biorheology, 29, pp. 383-398. [30] LeRoux, M.A. and Setton, L.A., 2002, J. Biomech. Eng.-Trans. ASME, 124(3), pp. 315-321. [31] Hoffman, A.S., 2002, Adv. Drug Deliver. Rev.,54(1), pp. 3-12.