Journal of Chemical and Pharmaceutical Research, 2015, 7(9):982-992
Review Article
CODEN(USA) : JCPRC5
ISSN : 0975-7384
Qualitative and quantitative bioanalysis by liquid chromatography tandem
mass spectrometry (LC-MS/MS)
Sarfaraz Ahmad*, Md. Sajid Ali, Nawazish Alam, Md. Sarfaraz Alam, Md. Intakhab Alam
College of Pharmacy, Jazan University, Jazan, KSA
_____________________________________________________________________________________________
ABSTRACT
A Bioanalytical method utilizes for the quantitative determination of drugs and their metabolites in biological matrix (plasma, urine, saliva, serum etc.) play an important role in estimation and interpretation of bioavailability, bioequivalence and pharmacokinetic data. Development and validation of bioanalytical method is essential to understand the pharmacokinetics of any drug and/or its metabolites. Liquid Chromatography Tandem Mass Spectrometry (LC-MS/MS) is used in laboratories for the qualitative and quantitative estimation of drug substances, drug products and biological samples. This review focus on various extraction techniques like solid phase extraction (SPE), liquid–liquid extraction (LLE), and protein precipitation , which play important role in sample preparation and detection by LC-MS/MS. This article also comprises scanning and optimization of analyte as well as internal standard (IS) and optimization of mobile phase and its preparation. Bioanalytical method validation includes all the parameters like system suitability, sensitivity, selectivity , Matrix Effect, precision and accuracy, calibration curve, stability, Robustness , Ruggedness that demonstrate a particular method used for quantitative measurement of analytes in a given biological matrix, such as blood, plasma, serum, or urine is reliable and reproducible for the intended use.
Keywords: Method development, method validation, LC-MS/MS bioanalysis, Matrix effects, Sample preparation _____________________________________________________________________________________________
INTRODUCTION
Mass spectrometry (MS) is about one hundred years old. Its basic principles were first described by Sir Joseph John Thomson during a lecture he gave to the Cambridge Philosophical Society in 1897 [1] traced in 1913 by experimental validation, when he distributed a stream of ionised neon gas into two isotopic components by applying a magnetic and an electric field to it [2].
During subsequent decades, MS became a widely used analytical technique in the physical and chemical sciences. But, for biological specimens its application remained limited, mainly because the ionisation techniques available were only suitable for low molecular weight compounds (∼200 Da or less), and also there was noworthy methods for easy introduction of biospecimens into the high-vacuum of the mass spectrometer.
the pharmaceutical industry, followed by clinical laboratories. The advancement of MS practice for biospecimen analysis enhanced further during the mid and late 1990s, with a shift from gas-chromatography (GC) as a mass spectrometry front-end technology to liquid-chromatography (LC), a technique that permitted much simpler work flows and significantly faster analytical turnaround times.
Now, in 21st century, LC mass spectrometry (LC-MS) has become a widespread technology within clinical reference and referral laboratories world-wide, and has started to enter into large and medium sized hospitals and regional clinical laboratories. Its use within medical laboratories now covers hundreds of different tests, ranging from rare and highly esoteric analytes to high volume tests in drug/toxicology, newborn screening and endocrinology [4].
This review focuses primarily on bioanalysis and is therefore not comprehensive. However, it may cover several aspects that can be generalized to other areas of clinical LC-MS testing.
A Bioanalytical method utilizes for the quantitative determination of drugs and their metabolites in biological matrix (plasma, urine, saliva, serum etc.) play animportant role in estimation and interpretation of bioavailability, bioequivalence and pharmacokinetic data [5]. Both HPLC and LCMS-MS can be used for the bioanalysis of drugs in plasma. Each of the instruments has its own advantages. HPLC coupled with UV, PDA or fluorescence detector can be used for estimation of many compounds. The main benefits of LCMS/MS include low detection limits, the ability to generate structural information, the requirement of minimal sample treatment and the possibility to cover a wide range of analytes differing in their polarities[6].Bioanalytical method validation includes all of the procedures that illustrate that a particular method used for quantitative measurement of analytes in a given biological matrix, such as blood, plasma, serum, or urine, is reliable and reproducible for the intended use[7-8]. The fundamental parameters for this validation include selectivity, accuracy, precision, linearity and range, limit of detection, limit of quantification, recovery, robustness and stability. This guideline provides assistance to sponsors of investigational new drug applications (INDs), new drug applications (NDAs), abbreviated new drug applications (ANDAs) and supplements in developing bioanalytical method validation information used in human clinical pharmacology, bioavailability (BA) and bioequivalence (BE) studies requiring pharmacokinetic (PK) evaluation. This guideline also applies to bioanalytical methods used for non-human pharmacology/toxicologystudies and preclinical studies. For studies related to the veterinary drug approval process, this guidance applies only to blood and urine BA, BE and PK studies[9-10].
EXPERIMENTAL SECTION
METHOD DEVELOPMENT
Method development is the procedure for developing a sensitive, accurate, precise, rugged and robust quantitative method for estimation of drug and/metabolite in biological matrix.Method development involves evaluation and optimization of the various stages of sample preparation, chromatographic separation, detection and quantitation . With chromatographic methods, an important consideration at the method development stage is whether to use internal or external standardization. For external standardization the response of analyte is plotted against concentration to generate calibration line. While for internal standardization, a structural or isotopic analogue of the analyte is added and samples prior to sample pre-treatment the ratio of the response of the analyte to that of internal standard is plotted against concentration.
Steps Involved In Method Development: Literature survey:
Preparation of a product profile of an identified compound by collecting the data and information given below through literature search. Molecular formula/weight with structure, Physicochemical properties e. g. Solubility, pKa, Stability in solution. Pharmacokinetic parameters (Cmax, Tmax, AUC, Cl, Vd, Plsama binding, etc), Analytical methods if any specifying chromatographic conditions e.g, Column type (C18, C8 etc), Column oven temperature, Mobile phase, Injection volume, Flow rate and References.
Scanning and optimization of analyte and internal standard:
______________________________________________________________________________
Following are the principal experiments that can be performed with mass filtering tandem mass spectrometers:
Full Scan: Scan across the entire (or part of the) mass range of both mass filters (Q1 and Q3) while Q2 does not contain any collision gas. This test allows the user to see all ions contained in a sample.
Product Ion Scan: Select one specific m/Q in Q1, fill Q2 with collision gas to fragment the selected m/Q, and then scan across the entire (or part of the) mass range of Q3 – this experiment allows the user to see all fragment/product ions of the selected precursor ion.
Precursor Ion Scan: Scan across the entire (or part of the) mass range of Q1, fill Q2 with collision gas to fragment all ions in the scan range, and then select one specific m/Q in Q3 – this experiment allows the user, by temporal correlation of detection of the product ion and the m/Q that just preceded its detection, to determine which m/Q precursor ion(s) might have given rise to the selected product ion.
Neutral Loss Scan: Scan across the entire (or part of the) mass range of Q1, fill Q2 with collision gas to fragment all ions in the scan range, and then scan Q3 across a predetermined range that corresponds to a fragmentation-induced loss of one specific mass having occurred for every potential ion in the precursor scan range. This experiment allows identification of all precursors that have lost a selected common chemical group, e.g. all precursors that have lost the mass corresponding to a methyl-group.
Selective (or Multiple) Reaction Monitoring (SRM or MRM): Select one specific m/Q in Q1, fill Q2 with collision gas to fragment the selected m/Q, and then select one specific m/Q of these fragments in Q3 – this experiment allows highly specific detection of an analyte with the m/Q selected in Q1 that is known to fragment specifically into the product ion selected into Q3. For this specific ion-pair the detection sensitivity is also vastly increased, since the detector now processes primarily (or exclusively) this single analyte-specific ion-pair, and can do so repeatedly over several cycles.
Preparation of calibration curve (CC):
Calibration is the relationship between instrument response and known concentration of the Analyte. A sufficient number of standards should be employed to define the relationship between concentration and response .A calibration curve should be prepared in the same biological matrix as the samples in the intended study by spiking with known concentration of the analyte. Precaution should be taken to avoid precipitation while spiking the biological matrix .The number of standards used in constructing a calibrationcurve will be a function of anticipated range of analytical values and the nature of the analyte response relationship. Concentration of standards should be chosen on the basis of the concentration range expected in a particular study.A calibration curve should consist of, Blank sample (matrix sample processed without internal standard), Blank (duplicate), Zero sample (matrix processed with internal standard), Zero sample (duplicate), Five to eight non-zero samples covering the expected range, including LLOQ., Blank and zero samples are not used in calibration function, but they only serve to evaluate interferences.
The simplest model that adequately describes the concentration-response relationship should be used. Selection of weighting and use of a complex regression equation should be justified. The following conditions should be met in developing a calibration curve: 20% deviation of the LLOQ from nominal concentration. 15% deviation of standards other than LLOQ from nominal concentration
Limit of Detection (LOD):
The limit of detection is the lowest concentration of analyte in the sample that can be detected but not quantified under the standard experimental condition.
Lowest limit of Quantification (LLOQ):
Quality control sample (QC):
A spiked sample used to monitor the performance of a bioanalytical method and to asses the integrity and validity of the result of the unknown samples analysed in an individual batch. Each QC batch should contain, a) LLOQ, b) Low QC, c) Medium QC, d) High QC, LLOQ QC: Sample concentration as the lowest non-zero standard, Low QC: 2 to 3 times of LLOQ, Medium QC: Approx. 40 to 60% of ULOQ (Upper limit of quantification: it is the highest concentration in the CC range and it is 10 times greater than the Cmax value). High QC: It is approx. 80% of ULOQ.
Check the response linearity:
The response linearity using selected chromatographic condition, Thelowest concentration of CC standard be less then required limit of quantification, Accept the linearity only if r2should be >= 0.98.
Internal standard:
Test compound (s) (e.g. structurally similar analog, stable labeled compound) added to both calibration standards and sample at known and constant concentration to facilitate quantification of the target analyte (s)
Selection of internal standard (IS):
It should be detected under the chromatographic condition of the main compound (analyte).Processed blank matrix sample should be free from interference at IS retention time.It should elute close to retention time of the analyte of interest with proper resolution.
Sample collection and Sample preparation:
Sample preparation is an essential part of HPLC analysis, which is intended to provide a reproducible and homogenous solution that is suitable for injection to the column.
Aim of sample preparation:
o Relatively free of interferences
o Should not damage the column
o Compatible with the intended HPLC method
The biological media that contain the analyte are usually blood, plasma, urine, serum etc. Blood is usually collected from human subjects by vein puncture with a hypodermic syringe up to 5 to 7 ml (depending on the assay sensitivity and the total number of samples taken for a study being performed). The venous blood is withdrawn into tubes with an anticoagulant, e.g. EDTA, heparin etc. Plasma is obtained by centrifugation at 4000 rpm for 15 min. About 30 to 50% of the original volume is collected[11].
The purpose of sample preparation is to clean up the sample before analysis and/or to concentrate the sample. Material in biological samples that can interfere with analysis, the chromatographic column or the detector includes proteins, salts, endogenous macromolecules, small molecules and metabolic byproducts [12]. A goal with the sample preparation is also to exchange the analyte from the biological matrix into a solvent suitable for injection into the chromatographic system. General procedures for sample preparation like liquid/liquid extraction, solid-phase extraction(SPE) and protein precipitation. Sample can be prepared for bioanalysis in wide variety of form. Some of the important methods of sample preparation are given below:
Solid Phase Extraction (SPE):
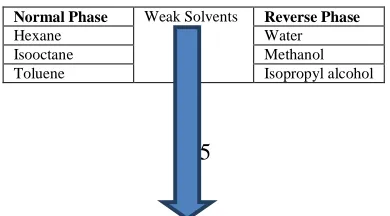
[image:4.595.201.396.689.797.2]SPE is a physical extraction process that involves a liquid and solid phase .The solid support is a chemically modified silica gel that has a greater attraction for the analyte than the matrix in which the analyte is present. Principle of SPE is based on the selective retention of the analyte [13]. Elution solvent commonly used is methanol which is strong enough to completely elute an analyte generally (1-2 ml) in volume. Following Table (1) describes the Solvent Strength for SPE process.
Table 1: Solvent Strengths for SPE process.
Normal Phase Weak Solvents Reverse Phase
Hexane Water
______________________________________________________________________________
Chloroform
Strong Solvents
Acetonitrile Methyl Chloride Acetone Tetrahydrofuran Ethyl acetate Ethyl acetate Tetrahydrofuran Acetone Methyl Chloride Acetonitrile Chloroform Isopropyl alcohol Toluene Methanol Isooctane
[image:5.595.82.523.84.595.2]Water Hexane
Figure 1: Steps involved in SPE
Figure 2: General solid-phase extraction procedure.
Liquid-Liquid Extraction(LLE):
[image:5.595.225.380.408.612.2]Figure 3: Steps involved in LLE
Protein Precipitation (PP):
It is suitable for highly water-soluble drug. Precipitating reagents most commonly used are Perchloric acid (PCA), Tri chloro acetic acid (TCA), Acetonitrile.Protein precipitation is often used in routine analysis to remove proteins. Precipitation can be induced by the addition of an organic modifier, a salt or by changing the pH which influence the solubility of the proteins [16]. The samples are centrifuged and the supernatant can be injected into the LC system or be evaporated to dryness and thereafter dissolved in a suitable solvent. A concentration of the sample is then achieved. There are some benefits with the precipitation method as clean-up technique compared to SPE. It is less time consuming, smaller amounts of organic modifier or other solvents are used. But there are also disadvantages. The samples often contain protein residues and it is a non-selective sample cleanup method, there is a risk that endogenous compounds or other drugs may interfere in the LC-system. However the protein precipitation technique is often combined with SPE to produce clean extract[17-18].
Figure 4: Steps involved in protein precipitation
Selection and Optimization of mobile phase:
Methods development for a LC/MS analysis differs from a traditional HPLC method. The selection of the mobile phase and the buffers must optimize the chromatographic separation, but for mass spectral detection, must promote the ionization of the analytes. In addition, the mobile phase modifiers should produce good peak shape with minimal tailing to maximize sensitivity.
Mobile phase preparation:
Only highly purified solvents should be used for HPLC work. Solvents of lesser quality often contain additives or stabilizers, which may alter the UV-detector.
______________________________________________________________________________
Figure 5: Steps involved in mobile phase preparation
System suitability: Determination of instrument performance (e.g., sensitivity and chromatographic retention) by analysis of a reference standard prior to running the analytical batch.
METHOD VALIDATION[19]
Method validation is a process used to verify/confirm that an analytic method developed is suitable for its intended purpose, that it provides reliable and valid data for a specific analyte. Typical parameters to validate are; include selectivity, accuracy, precision, linearity and range, limit of detection, limit of quantification, recovery, robustness and stability. General recommendation for analytical method validation, i.e.for pharmaceutical methods, can be found in The US Food and Drug Administration (FDA) guideline.
Bioanalytical Method Validation Parameters: Selectivity:
Selectivity is the ability of an analytical method to differentiate and quantify the analyte in the presence of other components in the sample. Procure appropriate biological matrix (plasma, urine, or other matrix) containing (Ethylenediaminetetraacetic acid) EDTA as an anticoagulant from a minimum of six individual.Inject an aqueous mixture of drug /metabolite and IS in appropriate concentration to check the retention time(RT).Process and run six different blank matrix samples and spikes samples of LLOQ in same six different matrix samples.Evaluate the interference at the RT of analyte and IS by comparing the response in blank matrix against the mean peak area response of the extracted LLOQ samples.Response of interfering peak at the RT of drug/metabolite should be ≤ 20% of the mean drug response in LLOQ samples and that for the IS should be ≤ 5% of the mean IS response in LLOQ samples. At least 67% of the screened matrix lots must meet the above criteria.
Matrix Effect[20-22]:
Matrix effect is investigated to ensure that selectivity and precision are not compromised within the matrix screened. The direct or indirect alteration or interference in response due to the presence of unintended analytes (for analysis) or other interfering substances in the sample.Perform matrix effect to ensure that precision, selectivity, sensitivity are not compromised due to change in matrix.Prepare in duplicate LQC and HQC samples in six different batches of blank matrix under testing. Process and analyze all the above QC samples along with freshly spiked calibration curve standard of conc. range.Back calculate the QC conc. using calibration curve data.The matrix effect is nullified if the % Nominal is within ± 15 % and %CV ≤ 15% at low and high QC.
Accuracy:
The accuracy of an analytical method describes the closeness of mean test results obtained by the method to the true value (concentration) of the analyte. The deviation of the mean from the true value serves as the measure of accuracy. The accuracy should be 15% more or less from the nominal value accept LLOQ where it should not deviate by more than 20%.
Precision:
LLOQ, where it should not exceed 20% of the CV. A precision and accuracy batch should contain the following samples with IS wherever required.
• Aqueous mixture (with IS standard if applicable)
• Standard blank matrix in duplicate
• Zero samples in duplicate
• Spiked calibration standard
• Six LLOQ QC samples
• Six LQC sample
• Six MQC sample
• Six HQC sample
Process all the above samples and calculate mean, standard deviation, accuracy, and precision of all QC SAMPLES conc. From the respected calibration curve.Accuracy of at least 67% QC samples must be within ±15% of the respective nominal value except at LLOQ, where it should be within ±20% of the nominal value.The accuracy of the mean value of LLOQ QC must be within ±20% of the nominal value and that for the other QCs within ±15% of the respective nominal value. The precision around the mean value should not exceed ±15% of the %CV except for LLOQ QC where it should not exceed ±20 % of the %CV.
Recovery:
Recoverymeans in how much amount the Analyte has been extracted from the sample solution. Recovery of the analyte need not be 100%, but the extent of recovery of an analyte and of the internal standard should be consistent, precise, and reproducible. Recovery experiments should be performed by comparing the analytical results for extracted samples at three concentrations (low, medium, and high) with unextracted standards that represent 100% recovery.Withdraw six sets each of QC samples (LQC, MQC, HQC) from deep freezer and thaw.Process and inject these QC samples (extracted samples). Prepare pure solution of drug and metabolite if any including IS at conc. representing 100% extraction of QC samples at low, middle and high concentration (non-extracted samples) and process.
The %CV of the mean analyte and IS recoveries must be ≤ 15% for each QC concentration levels
Stability Studies[23-27]:
Drug stability in a biological fluid is a function of the storage conditions, the chemical properties of the drug, the matrix, and the container system. The stability of an analyte in a particular matrix and container system is relevant only to that matrix and container system and should not be extrapolated to other matrices and container systems. Stability procedures should evaluate the stability of the analytes during sample collection and handling, after long-term (frozen at the intended storage temperature) and short-long-term (bench top, room temperature) storage, and after going through freeze and thaw cycles and the analytical process. Conditions used in stability experiments should reflect situations likely to be encountered during actual sample handling and analysis. The procedure should also include an evaluation of analyte stability in stock solution.
All stability determinations should use a set of samples prepared from a freshly made stock solution of the analyte in the appropriate analyte-free, interference-free biological matrix. Stock solutions of the analyte for stability evaluation should be prepared in an appropriate solvent at known concentrations.
Freeze and Thaw Stability:
______________________________________________________________________________
QC samples along with freshly spiked calibration curve std.Back calculate the QC conc. using the fresh calibration curve data.Mean % nominal conc. at each QC sample level must be ±15% and the %CV should be≤ 15%.
Short-Term (Bench Top Stability):
Short-Term room temperature stability for spiked sample is carried out to assess the stability of the analyte in biological fluids over a period of time during which the samples are accepted to be kept on bench while processing.Withdraw and thaw six sets each of QC samples (LQC and HQC) from the deep freezer and leave them at room temp for at least six hours (based on the expected duration that samples will be maintained at room temp in the intended study) and analyze using fresh calibration standard.% Nominal at each QC sample level must be ±15% and the %CV should be ≤ 15%. Short-Term room temp stabilityfor aqueous dilutions is carried out to assess the stability of dilution prepared and kept on bench at room temp over a period of time.Takesolution and keep one aliquot in the refrigerator (comparison samples) and the other at a designated Prepare aqueous. Solutions (stability dilutions) of analyte and IS from the stock place for minimum of 12 hrs. Inject six replicates of each stability dilutions kept in refrigerator and room temp.% Nominal should be ±15% of the nominal value. % Change should be
±10%
Long-Term Stability:
The storage time in a long-term stability evaluation should exceed the time between the date of first sample collection and the date of last sample analysis. Long-term stability should be determined by storing at least three aliquots of each of the low and high concentrations under the same conditions as the study samples. The volume of samples should be sufficient for analysis on three separate occasions. The concentrations of all the stability samples should be compared to the mean of back-calculated values for the standards at the appropriate concentrations from the first day of long-term stability testing. Long-Term Stability is carried out to assess the stability of analyte in biological fluid during its storage in deep freezer below -50°c for a period of storage that equal or exceed the period of time between the date of first sample collection and the date of last sample analysis.Withdraw six aliquots of each LQC and HQC from deep freezer stored below -50°c based on the expected duration (from first sample collection to last sample analysis) and determine the stability by comparing with freshly spiked calibration standard.Back calculates the QC conc. using the fresh calibration data and compare the conc. of stability samples with the mean of back calculated values for QC samples (considered as nominal conc.) at appropriate conc. from the first Precision &Accuracy (P&A) batch.Mean % nominal conc. at each QC sample level must be ±15% and the %CV should be ≤ 15%. % Change should be ±15%.
Short-term stability at -20°c storage:
Stability of drug in case of temporary storage of plasma samples Stability in human plasma at -20°c is conducted to assess the in -20°c deep freezer. Store six sets of QC samples (LQC&HQC) in -20°c deep freezer after bulk spiking.Withdraw six sets after minimum of three days and process and analyzes along with freshly spiked calibration curve standards.Back calculate the QC conc. using the fresh calibration data and compare the conc. of stability samples with the mean of back calculated values for QC samples (considered as nominal conc.) at appropriate conc. from the first P&A batch.Mean % nominal concentration. at each QC sample level must be ±15% and the %CV should be ≤ 15%.% Change should be ±15%
Post-Preparative (Auto injector) Stability):
Stock Solution Stability:
The stability of stock solutions of drug and the internal standard should be evaluated at room temperature for at least 6 hours. If the stock solutions are refrigerated or frozen for the relevant period, the stability should be documented. After completion of the desired storage time, the stability should be tested by comparing the instrument response with that of freshly prepared solutions. Refrigerated Stock solution stability is carried out to assess the stability of stock solution over a period of time (e.g. 7,14, and 21 days) during which it can be used.Store sufficient aliquots of stock solution in the refrigerator below 12°c over a period of time (e.g. 7,14, and 21 days) during which it can be
used. Prepare fresh standard stock solution of analyte and IS.Prepare stock dilutions of both refrigerated stock (comparison sample) and fresh stock solution (stability sample) equivalent to MQC conc.Inject six replicates of prepared comparison and stability sample immediately after preparation.
Post-Preparative Stability:
The stability of processed samples, including the resident time in the autosampler, should be determined. The stability of the drug and the internal standard should be assessed over the anticipated run time for the batch size in validation samples by determining concentrations on the basis of original calibration standards.
Although the traditional approach of comparing analytical results for stored samples with those for freshly prepared samples has been referred to in this guidance, other statistical approaches based on confidence limits for evaluation of an analytes stability in a biological matrix can be used. SOPs should clearly describe the statistical method and rules used. Additional validation may include investigation of samples from dosed subjects.
Robustness:
According to ICH guidelines, the robustness of an analytical procedure is the measure of its capacity to remain unaffected by small, but deliberate variations in method
parameters and provides an indication of its reliability during normal usage. Robustness can be described as the ability to reproduce the (analytical) method in different laboratories or under different circumstances without the occurrence of unexpected differences in the obtained result(s), and a robustness test as an experimental set-up to evaluate the robustness of a method.
Ruggedness:
One precision and accuracy batch should be processed using different set of reagent by different analyst and analyzed using different column (same type different manufacturer) the same instrument on different instrument.
Dilution Integrity:
In certain cases depending upon the requirement dilution integrity of the sample is established.Prepare 12 sets of QC spiked with about 1.5 - 1.8 times the conc. of the ULOQ.Process six sets of above QCs samples by diluting them twice and another six sets by diluting four times prior to extraction by addition of screened blank matrix.Inject these QC samples along with calibration curve standards and calculate the QC concentration using multiplication factor as 2 for two times dilute sample and 4 for four times dilute sample. Precision of QC having same dilution factors should be ≤ 15%
Accuracy of QC having same dilution factors should be ±15% of the nominal value.
CONCLUSION
______________________________________________________________________________
molecules. The concepts and relatively novel technology enclosed in this review article can be used to improve LC-MS/MS bioanalytical method development and the matrix effect caused due to the presence of unintended analytesor other interfering substances in the sample.
REFERENCES
[1] JJ Thomson. ProcCambPhilos Soc. 1897, 9, 243-244.
[2] JJ Thomson. Proc Royal Soc London A. 1913, A 89(607), 1-20.
[3] JB Fenn; M Mann; CK Meng; SF Wong; CM Whitehouse. Science. 1989, 246(4926), 64-71. [4] EJ Want; BF Cravatt; G Siuzdak. Chembiochem. 2005, 6(11), 1941–1951.
[5] F Bressolle; P Bromet; M Audran. J Chromatogr B Biomed Appl., 1996, 686(1), 3-10. [6] R Rao; K kalakuntla; S Kumar. J. Pharma. Sci. Res.,2009, 3, 2-3.
[7] E Reid; DI Wilson. Methodological Survey in Biochemistry and Analysis: Analysis for Drug and Metabolites, Including Anti-infective Agents. 1990, 20, 1-57.
[8] U.S .Department of Health and Human Services, Food and Drug Administration, Guidance for Industry, Bioanalytical Method Validation. May 2001.
[9] SK Grebe; RJ Singh. ClinBiochem Rev., 2011, 32(1), 5-31.
[10] S Murugan; N Pravallika; P Sirisha; K Chandrakala. Int. J. Cur. Pharm. Clin. Res., 2013, 3(1), 13-17. [11] H Rosing; WY Man; E Doyle; ABult; JH Beijnen. J. Liq. Chrom. Rel. Technol,2000, 23, 329-354.
[12] EM Thurman; MS Mills. Solid-phase extraction: Principles and practise. Chemical analysis: A series of monographs on analytical chemistry and its applications, Winefordner J.D, New York, John Wiley & sons Inc, 1998; 147.
[13] DA Wells. High throughput bioanalytical sample preparation: Methods and automation strategies, 1st ed. Amsterdam: Elsevier Science, 2003.
[14] Y Kazakevich; R Lobrutto. HPLC for Pharmaceutical Scientists, 1st ed, John Wiley & Sons, Inc.: New Jersey, 2007; 281-292.
[15] R Said. Application of new technology LC-MS/MS for determination of therapeutic drugs, Doctoral degree thesis, Department of Medicine Division of Clinical Pharmacology Karolinska Institute, Stockholm, Sweden. 2010; 1-5.
[16] RF Venn. Principles and practice of bioanalysis. London: Taylor and Francis. xviii. 2000; 364. [17] D Patel. Int. J. Pharm. Biol. Sci.,2011, 2, 559-564.
[18] SC Gad. Preclinical development handbook, New Jersey, John Wiley and Sons. 2008. [19] Food and Drug Administration Guidance for Industry Bioanalytical Method Validation. 2001.
[20] A Cappiello; GFamiglini; P Palma; E Pierini; V Termopoli; H Trufelli. Anal. Chem.,2008, 80, 9343-9348. [21] ML Chiu; W Lawi; ST Snyder; PK Wong; JC Liao; V Gau. J. Ass. Lab. Autom., 2010, 15, 233-242.
[22] M Shuguang; SK Chowdhury. Bioanalysis, 2014, 6(5), 587-590.
[23] LK Prashant; V Gantala; K Jignesh; S Ravi. Biomed. Chromatogr.,2011 25(1-2), 199-217. [24] C Ashish; M Bharti; C Priyanka. J. Anal. Bioanal. Tech., 2015, 6(1), 233-238.
[25] Z Wei; X Bing-Ren; W Cai-Yun. Biomed.Chromatogr., 2007, 21(3), 266-272. [26] R Causon. J Chromatogr B Biomed Sci Appl. 1997, 689(1), 175-180.