THE COMPARATIVE STUDY OF CANNY FILTER AND MORPHOLOGICAL OPERATOR IN FINGERPRINT RECOGNITION
ABDULGADER AB SINUSI
A thesis submitted in
fulfilment of the requirements for the award of Master of Computer Science (Software Engineering)
The Department of Software Engineering
Faculty of Computer Science and Information Technology Universiti Tun Hussein Onn Malaysia
v
ABSTRACT
ABSTRAK
vii
CONTENTS
TITLE i
DECLARATIONS ii
DEDICATION iii
ABSTRACT v
ABSTRAK vi
CONTENTS vii
LIST OF TABLES xii
LIST OF FIGURES xiii
LIST OF SYMBOLS AND ABBREVIATIONS xv
LIST OF APPENDICES xvi
CHAPTER 1 INTRODUCTION 1
1.1 Background 1
1.2 Motivation 1
1.3 Problem Statement 2
1.4 Objectives of the Study 2
1.5 Scope of the Study 2
1.6 Outline of the Study 3
CHAPTER 2 LITERATURE REVIEW 4
2.1 Introduction to Biometrics 4
2.2 History of Fingerprint Recognition 6
2.3 Fingerprint Recognition 7
2.4 Fingerprint Classification 7
2.6 Representation of Fingerprint 9 2.7 Fundamentals of Image Processing to Fingerprint
Recognition Finalization 10
2.8 Thinning 11
2.9 Fingerprint Pattern Recognition Approaches 11
2.9.1 Histogram Equalization 14
2.9.2 Fast Fourier Transform (FFT) 15
2.9.3 Introduction to Minutia-Based Algorithm 16
2.10 Minutia Match 17
2.10.1 Alignment Stage 18
2.10.2 Match Stage 19
2.10.3 Spectrum Analysis 20
2.11 Canny Filter 21
2.12 Features Extraction under Canny Filter 21
2.12.1 Entropy 22
2.12.2 Energy 22
2.12.3 Correlation 23
2.12.4 Homogeneity 23
2.12.5 Contrast 23
2.13 Morphological Operator 24
2.14 Region of Interest Extraction by Morphological Operation 24
2.14.1 Fingerprint Ridge Thinning 24
2.14.2 Morphological Marking 25
2.14.3 False Morphological Removal 26
2.15 Match Stage Based on Morphological 27
2.16 Evaluation of Fingerprint Recognition algorithms 28
ix
2.16.2 False Acceptance Rate (FAR) 28
2.16.3 False Rejection Rate (FRR) 28
2.17 Path Analysis Test Case 29
2.18 Previous Work Related to Fingerprint Recognition 29 2.19 The Advantages of using Canny Filter and Morphological
Operation in Designing Fingerprint Recognition 32
2.20 Summary of the Chapter 32
CHAPTER 3 METHODOLOGY 34
3.1 The Flow Chart of the Proposed Methods 35
3.2 Dataset 37
3.3 Image Enhancement 37
3.3.1 Histogram Equalization 37
3.3.2 Fast Fourier Transform (FFT) 38
3.4 Region of Interest extraction by Morphological operation 39 3.5 The Procedure of the Proposed Technique (Canny Filter
and Morphological Operation) 41
3.6 Features Extraction under Canny filter 41
3.7 Matching stage 42
3.8 Classification 42
3.9 Evaluation of Fingerprint Recognition with Morphological
and Canny Filter 43
3.10 Summary of the Chapter 43
CHAPTER 4 RESULTS AND DISCUSSION 44
4.1 Introduction 44
4.2 General Structure of the Designed System 44
4.3 Algorithm Designed 45
4.4 Graphical User Interface (GUI) 46
4.6 Dataset and Software Application 47
4.7 Acquired Images 48
4.8 Analysis of Morphological Algorithm 53
4.8.1 Case (1): System Analysis based on Five Users
with 40 Images 53
4.8.2 Overall Recognition of the Five Classes System 55 4.8.3 Case (2): System Analysis at 10 Classes 55
4.8.4 Overall Accuracy of the System 58
4.8.5 Case (3): System Analysis at 20 Classes 58 4.8.6 Case (4): System Analysis at 84 Classes with 672
Images 59
4.9 Analysis of Canny Filter Algorithm 60
4.9.1 Case (1): System Analysis Based on Five Users
with 40 Images 60
4.9.2 Overall Accuracy of the System 62
4.9.3 Case (2): System Analysis at 10 Classes 62
4.9.4 Overall Accuracy of the System 65
4.9.5 Case (3): System Analysis at 20 Classes 65 4.9.6 Case (4): System Analysis at 84 Classes 66
4.10 Comparison of the Propose Methods 67
4.11 Evaluation of Fingerprint Recognition with Morphological
and Canny Filter 68
4.11.1 Total Success Rate (TSR) 68
4.11.2 False Acceptance Rate (FAR) 68
4.11.3 False Rejection Rate (FRR) 68
4.12 Path Analysis Test Case of Morphological and Canny
Filter 69
xi
CHAPTER 5 CONCLUSION AND FUTURE WORK 70
5.1 Conclusion 70
5.2 Future Work and Suggestions 70
REFERENCES 72
APPENDICES 76
LIST OF TABLES
2.1 The Algorithms of sub-groups of Fingerprints 9 2.2 Results of the Previous Work Related To Fingerprint
Recognition
32
xiii
LIST OF FIGURES
2.1 Multimodal Biometrics System 5
2.2 Subgroups of Fingerprint Classification 8
2.3 Global Feature and Local Features 9
2.4 Ridge Ending and Ridge Bifurcation 10
2.5 Processing of Binarization 10
2.6 Enhancement Steps 11
2.7 Histogram Equalization 15
2.8 Different Ridge Shapes 16
2.9 Ridge Endings in Different Locations in Two Minutia 16 2.10 The Diagram Illustrate the Effect of Translation and Oration 19
2.11 Wave Pattern of Two Different Sections 20
2.12 Morphological Marking 26
2.13 False Morphological Structures 26
3.1 The Flow Chart Proposed Methods 35
3.2 Histogram Image 38
3.3 Fast Fourier Transform 39
3.4 Ridge Thinning 40
3.5 Morphological Marking 40
3.6 False Morphological Removal 41
4.1 Simplified Fingerprint Recognition System 44
4.2 Minutia Extractor Process 45
4.3 Illustrates the Graphical User Interface 47
4.4 The Database 48
4.5 DB3 Database 48
4.6 Original Image Person One 49
4.8 Minutia Marking 50
4.9 Enhanced Thinned Person One 50
4.10 Convolve Image Person One 51
4.11 Gradient Image Person One 51
4.12 Convolve Image Person Two 52
4.13 Gradient Image Person Two 52
4.14 Image Connectivity 52
4.15 Recognition Rate of 5 Classes using Minutia 54
4.16 Total accuracy of 5 Class using Minutia 55
4.17 Recognition Rate of 10 Classes using Minutia 57 4.18 Total Accuracy of 10 Classes using Minutia 58 4.19 Total Accuracy of the 20th Classes System 59 4.20 Total Accuracy of the 84th Classes System 60 4.21 Recognition Rate of 5 Classes using Canny Filter 61
4.22 Total Accuracy of the 5 Classes System 62
xv
LIST OF SYMBOLS AND ABBREVIATIONS
– The Variance of Image – The Mean of Image
DB1 – Database 1
DB2 – Database 2
DB3 – Database 3
B.C. – Before Christ
FVC – Fingerprint Verification Competition
FBI – Federal Bureau of Investigation
NIST – National Institute of Standards and Technology
GLCM – Grey-Level Co-occurrence Matrix
PINS – personal identification numbers
FFT – Fast Fourier transform
MC – Match Count
NF – Number of Fingers
MMC – Miss Match Count
TSR – Total Success Rate
FRR – False Rejected Rate
FAR – False Accepted Rate
LIST OF APPENDICES
APPENDIX TITLE PAGE
A Path Analysis for Minutia (Morphological) to 5 Classes 76 B Path Analysis for Minutia (Morphological) to 10 Classes 77 C Path Analysis for Minutia (Morphological) to 20 Classes 78 D Path Analysis for Canny Filter to 5 Classes 79 E Path Analysis for Canny Filter to 10 Classes 80 F Path Analysis for Canny Filter to 20 Classes 81
CHAPTER 1
INTRODUCTION
1.1 Background
Fingerprint recognition or fingerprint authentication refers to the automated method of verifying a match between two human fingerprints. Fingerprints are one of many forms of biometrics used to identify an individual and verify their identity. Due to their uniqueness and consistency over time, fingerprints have been used for over a century, more recently becoming automated (biometrics) due to the advancement in computing capabilities. Fingerprint identification is popular because of the inherent ease in acquisition, the numerous sources (ten fingers) available for collection, and their established use and collections by law enforcement and immigration. Fingerprint recognition is one of the oldest and most reliable biometric used for personal identification. Fingerprint recognition has been used for over 100 years now and has come a long way from tedious manual fingerprint matching. The ancient procedure of matching fingerprints manually was extremely cumbersome and time-consuming, and required skilled personnel.
1.2 Motivation
has a fingerprint on the tip of their fingers and every person’s fingerprint is different or unique. They differ because of the curves and ridges that make up the skeleton of the fingerprint. The finger is usually rolled in black ink in order to obtain the fingerprint image. Once the ink is on the fingertip, the finger is then rolled on a really heavy paper in order to leave an impression. The fingerprint is scanned into a machine with the name for safe keeping and held in the Federal Bureau of Investigation (FBI) database or in any organization (Kadhem et al., 2010).
1.3 Problem Statement
Fingerprint recognition system is one of the most common systems in forensic and commercial applications and it had been used for security for a very long time. The accuracy of the system is still facing challenges to achieve perfect rate, even though several systems have been built. Hence, designing a system with get good accuracy is the main task in fingerprint recognition system.
1.4 Objectives of the Study
The objectives of this study are summarized below:
(i) To implement canny filter and morphological operation for fingerprint recognition system.
(ii) To do a comparative study between the proposed two methods for fingerprint recognition system.
(iii) To evaluate the methods based on the total success rate, false accepted rate and false rejected rate.
1.5 Scope of the Study
The scope of the study is defined as follows:
3 1.6 Outline of the Study
CHAPTER 2
LITERATURE REVIEW
This chapter introduces the fundamentals of biometrics traits to security system. The history of biometrics is introduced and general overview of the physical and behavioural characteristics is elaborated. Furthermore, it introduces the history of fingerprint and the applications that can be implemented using fingerprint traits. It also introduces and discusses the previous published work that has been done by other researches in order to implement and improve the fingerprint system technology.
2.1 Introduction to Biometrics
Biometrics refers to the technique that depends on automatic authentication and verification. In other words, human beings have unique personalities that can be used for identification purposes. There are many types of biometrics that can be used, such as fingerprints, pattern of retinal and characteristics of voice. The knowledge of biometrics is still in its infancy, but the biometrics system is unavoidable and it plays a critical role.
5 Behavioural based biometrics is related to the behaviour of a person. It can be easily changed by altering a signature or using a new phrase. The examples are signature recognition, voice recognition, and keystroke dynamic.
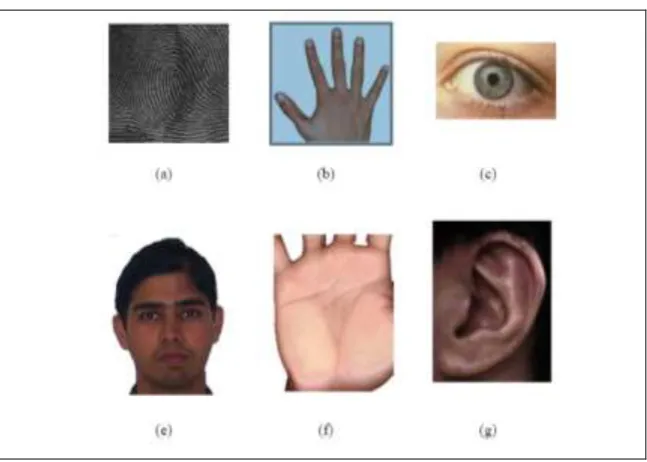
[image:18.595.158.482.252.483.2]In some applications, more than one biometrics trait is used to attain higher security and to handle failure to enrol situations for some users. These systems are called multimodal biometrics systems. Examples of multimodal biometrics are, thumbprint, fingerprint, iris, face recognition, palm print and ear feature as shown in Figure 2.1.
Figure 2.1: Multimodal Biometrics System (Li & Anil, 2009).
2.2 History of Fingerprint Recognition
Fingerprint imaging technology has been in existence since a very long time. The use of fingerprints as a unique human identifier dates back to second century B.C., where the identity of the sender of an important document could be verified by his fingerprint impression in the wax seal (Kuchen & Newell, 2004).
The first modern use of fingerprints occurred in 1856 when Sir William Herschel, the chief magistrate of the Hooghly district in Jangipara, India, had a local businessman, Rajyadhar Konai, impress his handprint on the back of a contract. Then, the right index and middle fingers were printed next to the signature on all contracts made with the citizens. The purpose was to frighten the signer of repudiating the contract because the locals believed that personal contact with the document made it more binding. As his collection of fingerprints grew, Sir Herschel began to realize that fingerprints could either prove or disprove identity (Zhang & Shu, 1999).
7 2.3 Fingerprint Recognition
Fingerprint recognition is one of the most common biometrics fingerprint technology based on uniqueness and ease of acquisition. Researchers and scientists discover two important keys about fingerprints; first, human fingerprints cannot change its structure normally after one year of birth, and second, everybody has unique fingerprint that is different from the other. Habitual fingerprint recognition was one of the first systems of machine recognition, and it did not solve problems, but on the contrary, fingerprint recognition is still a difficult and a very challenging pattern identification task. This is because, designing algorithms that are capable of getting efficient features and matching them in a stout way is very difficult, especially in poor quality fingerprint images and when low-cost acquirement devices with a small area are depended upon (Kalle, 1996).
Fingerprints have been used in forensics for more than 100 years and since the field of fingerprint analysis is so well-developed, fingerprint scanners are among the cheapest, most prolific, and most accurate biometrics applications found today. They are also easy to use and offer relatively high accuracy at a low price, with scanners available for less than $100. Fingerprint scanners are now incorporated into many firms that use them as a payment mechanism or to verify employee attendance. Recently, employee authentication solutions provider, Digital Persona Inc., integrated fingerprint biometrics into the company’s software offerings. Such systems can reduce payroll costs related to time and attendance fraud and also prevent unauthorized manager over rides. In hospitals, fingerprint recognition has been used for access control to medicines and drugs.
Fingerprint verification has become the preferred biometrics technology at the point-of-sale over such other options as iris scans, voice scans, and hand geometry because they present the best combination of a number of factors, including cost, accuracy, and size.
2.4 Fingerprint Classification
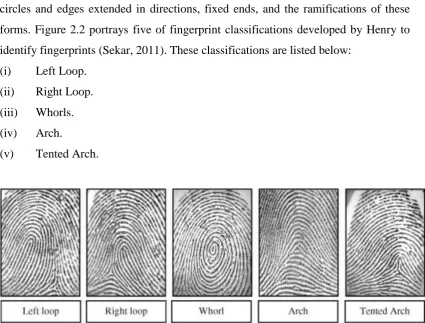
operates effort of the system when the definition of a person is required, the large data are divided into smaller pieces and compared through the items so that the test would class and compare the fingerprints. An imprint of the fingerprint may contain circles and edges extended in directions, fixed ends, and the ramifications of these forms. Figure 2.2 portrays five of fingerprint classifications developed by Henry to identify fingerprints (Sekar, 2011). These classifications are listed below:
(i) Left Loop. (ii) Right Loop. (iii) Whorls. (iv) Arch.
[image:21.595.114.540.131.454.2](v) Tented Arch.
Figure 2.2: Subgroups of Fingerprint Classification (Sekar, 2011).
2.5 Classification of Process
In any fingerprint system, its operations usually depend on the following classifications:
(a) Core point is considered the nucleus or centre fingerprint.
(b) Delta points are points of the embranchments at the top and bottom of the fingerprint (the edge).
(c) To link the fingerprint forms with their applications by a specific algorithm based on the points of core and delta concept are as follows:
9 (ii) If there is a key point and only one in the bow, the classification is left or
right loop.
(iii) If there are only two points and the arcs are in opposite directions, the classification is whorl.
[image:22.595.152.486.258.340.2]The classifications can be summarized using the general idea of algorithms as in Table 2.1.
Table 2.1: The Algorithms of sub-groups of Fingerprints
2.6 Representation of Fingerprint
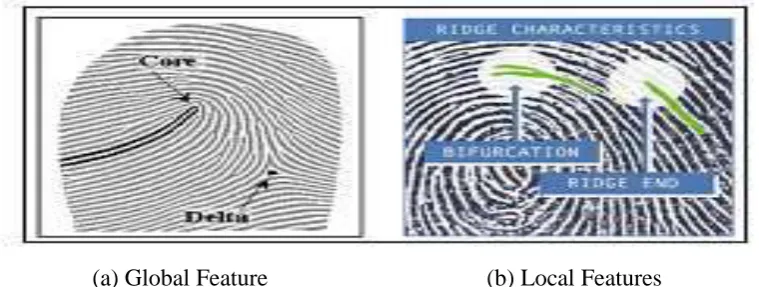
There are two types of fingerprint representations, namely, local and global representations as shown in Figure 2.3. Local fingerprints are based on the entire image and the edges of the fingerprint, as shown in Figure 2.4. Hence, by taking the salient features that are the most common, it takes the details of the individual and the information stored effectively and accurately observed, as well as strong, no matter how small the fingerprint may be. As for global representation, it depends on the location of critical points, the core and the delta (Bana & Kaur, 2011).
(a) Global Feature (b) Local Features
Figure 2.3: Global Feature and Local Features (Verm & Goel, 2011) NO. of Delta NO. of Core
Class
0 0
Arch
1(middle) 1
Tented arch
1(left) 1
Left loop
1(right) 1
Right loop
2 1
[image:22.595.127.507.565.708.2](a) Ridge Ending (b) Ridge Bifurcation
Figure 2.4: Ridge Ending and Ridge Bifurcation (Bana & Kaur, 2011)
2.7 Fundamentals of Image Processing to Fingerprint Recognition Finalization
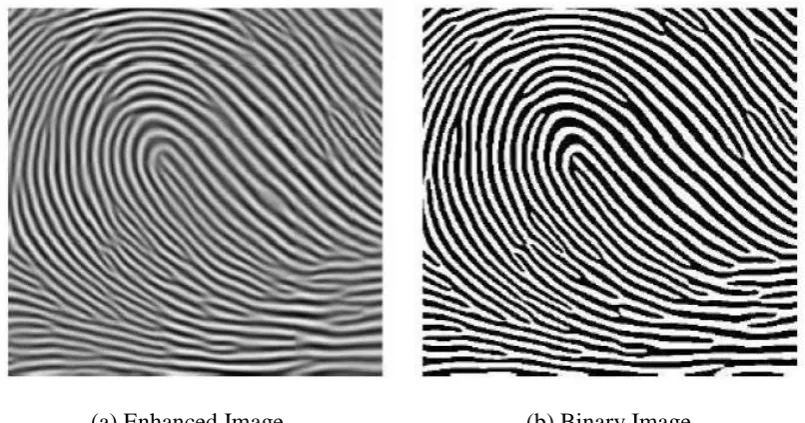
Fingerprint finalization is a converts on process from grey level image into binary image. After the process is over, the ridges will be changed to black and the furrows, white. The process of filtered image produces pixel value of zero and therefore, finalization of the image can be performed using global threshold of zero. Usually, the finalization process involves examining the grey-level value of each pixel in the enhanced image and if the value is greater than the global threshold value, then the pixel value is set to a binary value. The outcome is a binary image containing two levels of information which are; the foreground ridges and the background valley, as shown in Figure 2.5 (Ashok & Ummal, 2013).
[image:23.595.120.523.475.686.2](a) Enhanced Image (b) Binary Image
11 2.8 Thinning
The last image enhancement step on minutia extraction is thinning. Thinning transforms the image from binary to the pixels, which performs the thinning operation using two sub iterations. This algorithm is accessible in MATLAB via the thin operation under the bimorph function. Iteration begins by examining the neighbourhood of each pixel in the binary image and based on a particular set of pixel-deletion criteria, it is used to check if the pixel can be deleted. The process continues until there is no more pixels that can be deleted in the image (Ashok & Ummal, 2013). The application of the thinning algorithm to a fingerprint image preserves the connectivity of the ridge structures while forming a skeletonised version of the binary image, as shown in Figure 2.6.
[image:24.595.128.527.335.482.2](a) Enhanced image (b) Binary image (c) Thinned image
Figure 2.6: Enhancement Steps (Ashok & Ummal, 2013)
2.9 Fingerprint Pattern Recognition Approaches
template matching and statistical classification, and syntactic or structural matching, and neural networks. These models are not necessarily independent and sometimes the same pattern recognition method exists with different interpretations (Anil et al., 2000).
(a) Template-Matching and Correlation Method
One of the simplest and earliest approaches to pattern recognition is based on template matching. Matching is a generic operation in pattern recognition which is used to determine the similarity between two entities (points, curves, or shapes) of the same type. In template matching, or a prototype of the pattern to be recognized is available. The pattern to be recognized is matched against the stored template while taking into account all allowable pose (translation and rotation) and scale changes. The similarity measure, often a correlation, may be optimized based on the available training set. Often, the template itself is learned from the training set. Template matching is computationally demanding, but the availability of faster processors has now made this approach more feasible. The rigid template matching mentioned above, while effective in some application domains, has a number of disadvantages. For instance, it would fail if the patterns are distorted due to the imaging process, viewpoint change, or large intraclass variations among the patterns (Anil et al., 2000).
(b) Statistical Approach
13 or learned one can also take a discriminant analysis-based approach to classification. First a parametric form of the decision boundary (e.g., linear or quadratic) is specified, then the best decision boundary of the specified form is found based on the classification of training patterns (Anil et al., 2000).
(c) Syntactic and Structural Approach
In syntactic and structural approach, it is not only the digital values of the characteristics of each category are looked into, but also their inter-relations. Inter-relationship or interconnection of features between these characteristics in each category gives the necessary structural information to identify patterns. Recent studies in this area found that the most powerful way to identify the patterns is via combination of statistic pattern recognition approach with syntactic called Syntactic-Semantic approach. This way represents the style of a tree diagram or a graph string (literal string) on the initial elements of primitives, relations upon relations, and decision-making processes at the stage of recognition or classification is called Syntax analysis, or in other words, the Localization of parsing procedure. The highest percentage compared to the result of a comparison of the input image is with each tree (or graph/string, depending on the representation adopted in the application) stored determines the class to which the input image belongs (Anil et al., 2000).
(d) Neural Networks Approach
2.9.1 Histogram Equalization
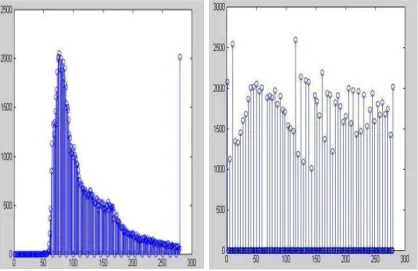
Histogram equalization is a technique of improving the global contrast of an image by adjusting the intensity distribution on a histogram. This allows areas of lower local contrast to gain a higher contrast without affecting the global contrast. Histogram equalization accomplishes this by effectively spreading out the most frequent intensity values, Figure 2.7 shown the original histogram of a fingerprint image has the bimodal type, and the histogram after the histogram equalization occupies all the range from 0 to 255 and the visualization effect is enhanced (Bana & Kaur, 2011).
In the meantime, contrast is expanded for most of the image pixels; the transformation improves the detectability of many image features. The probability density function of a pixel intensity level ( ) is given by:
( ) (2.1)
where
0 ≤ ≤ 1, k = 0,1,...,255 , nkis the number of pixels at intensity level, and n is the total number of pixels. The histogram is derived by plotting ( ) against . A new intensity of level k is defined as:
∑ ∑ ( ) (2.2)
Applying the histogram equalization locally using local windows of NxN pixels will result in expanding the contrast locally and changing the intensity of each pixel according to its local neighbourhood.
where
p : Mean.
: The number of pixels at intensity level.
n : Total number of pixels.
k : Number of pixels.
15
[image:28.595.114.533.71.342.2](a) Original Histogram (b) Histogram Equalization Figure 2.7: Histogram Equalization (Bana & Kaur, 2011)
2.9.2 Fast Fourier Transform (FFT)
In this method, the image is divided into small processing blocks such as (32 x 32 pixels) and Fourier transform is performed according to Equation as given:
( ) ∑
∑ ( ) { (
)}
(2.3)
As for the calculation, u = 0, 1, 2, ..., 31 and v = 0, 1, 2, ..., 31. In order to enhance a specific block by its dominant frequencies, multiply the FFT of the block by its magnitude a set of times. Where the magnitude of the original FFT = abs (F (u, v)) = |F (u, v)|. So, an enhanced block is acquired according to the Equation:
( ) ( ( ) ( ) ) (2.4)
For x = 0, 1, 2 …31 and y = 0, 1, 2 ...31.
the small holes in the ridges, but if the value is too high, it can result in false joining of ridges which might lead to termination and bifurcation. The enhanced image after the FFT is improved as some falsely broken points on ridges get connected and some spurious connections between ridges get removed (Masqueen & Renu, 2013).
2.9.3 Introduction to Minutia-Based Algorithm
Algorithms of Minutia-based extract information such as ridge ending, bifurcation, and short ridge from a fingerprint image are shown in Figure 2.8.
Short Ridge Ridge Ending Bifurcation
Figure 2.8: Different Ridge Shapes (Jain et al., 1999)
These features are then stored as mathematical templates or stored in matrices form. The identification or verification process compares the template of the live images with a database of enrolled templates (identification), or with a single enrolled template (authentication).
[image:29.595.178.464.549.676.2]
17 People with few or no minutia points cannot have successful enrolment or use of the system. This is demonstrated by the fingerprint immigration programmes such as the physical access control, information system security, customs and immigration, and National Identification (ID) systems, the largest Automated Fingerprint Identification System (AFIS) repository in America is operated by the department of homeland security's US visit program, containing over 120 million persons' fingerprints where finger moistening peripherals are standard. Furthermore, a low number of minutia points, as shown in Figure 2.9, can be a limiting factor for security of the algorithm. This can lead to false minutia points (darkened areas appear due to low-quality enrolment, fingerprint ridge detail or imaging). In the environment of the application, enrolment without assistance may take several attempts due to lack of pressure or poor position. While not quantified, user’s frustration will certainly have a negative impact on technology acceptance. Moreover, the widely used minutia-based representation does not utilize a significant component of the rich discriminatory information available in the fingerprints (Jain
et al., 1999).
2.10 Minutia Match
Two sets of minutia of two fingerprint images are matched and the algorithm would determine if the two minutia sets are from the same finger. An alignment-based match algorithm is partially derived from Jain et al. (2004) to be used in this study. This algorithm includes two consecutive stages; alignment and match. (i) Alignment stage: Given two fingerprint images for matching, choose any one minutia from each image, then the similarity of the two ridges associated with the two referenced minutia points are calculated. If the similarity appears larger than the threshold, each set of minutia is to be transformed to a new coordination system whose origin is at the referenced point and whose x-axis is coincident with the direction of the referenced point.
2.10.1 Alignment Stage
In first step, the ridge associated with each minutia is represented as a series of x-coordinates x1, x2…xn of the points on the ridge. All the points are sampled per ridge
length L starting from the minutia point, where the L represents the average inter-ridge length. The setting of n is 10 unless the total inter-ridge length is less than 10*L. So the similarity resulted from correlating the two ridges are derived from:
S =∑ [∑ ] (2.5)
where
(xi~xn) and (Xi~XN) respectively are the set of minutia for each fingerprint
image and M is minimal one of the n and N value. If the similarity score is greater than 0.8, then go to step 2, otherwise continue to match the next pair of ridges (Nandian & ravi, 2011).
In second step, for each fingerprint, translate and rotate all other minutia with respect to the reference minutia according to the following formula:
(
) [
( ) ( ) ( )
]
where
(x,y,) is the parameters of the reference minutia, and TM is as below:
19
Figure 2.10: The Diagram Illustrate the Effect of Translation and Oration (Nandian & Ravi, 2011).
The new coordinate system is originated as shown in Figure 2.10 at minutia F and the new x-axis is coincident with the direction of minutia F. There is no scaling effect taken into account by assuming two fingerprints from the same finger nearly similar size.
The method to align two fingerprints is almost the same with the one used by (Nandian & Ravi, 2011). But it is different at step 2. Lin’s method uses the rotation angle and it is calculated from all the sparsely sampled ridge points. This study used the rotation angle that was calculated earlier by densely tracing a short ridge starting from the minutia with length D. The minutia direction is derived from the minutia extraction stage. This method obviously reduces the redundant calculation and it still holds the accuracy. Besides, Lin’s transformation is to directly align one fingerprint image to another according to the discrepancy of the reference minutia pair.
However, it still requires transform to the polar coordinate system for each image at the next minutia match stage. This study obtained its transformation according to its own reference minutia and then, matched in a unified x-y coordinate. Therefore, less computation workload is achieved through this method.
2.10.2 Match Stage
The algorithm of matching for the aligned minutia patterns needs to be elastic as it requires that all parameters (x,y,) are the same for two identical minutia is impossible due to slight deformation and inexact quantization of minutia.
Match minutia is achieved by placing a bounding box around each template of minutia. If the minutia match is obtained within the rectangle box and the direction discrepancy between them is very small, then the two minutia are classified as a matched pair. Each minutia in the template image either has no matched minutia or has only one corresponding minutia. The final match ratio for two fingerprints is the number of total matched pair over the number of minutia of the template fingerprint. The score is 100 multiplied by ratio and ranges from 0 to 100. If the score is greater than a pre-specified threshold, then the two fingerprints are from the same finger. However, the elastic match algorithm is involved with large computation complexity and is vulnerable to spurious minutia.
2.10.3 Spectrum Analysis
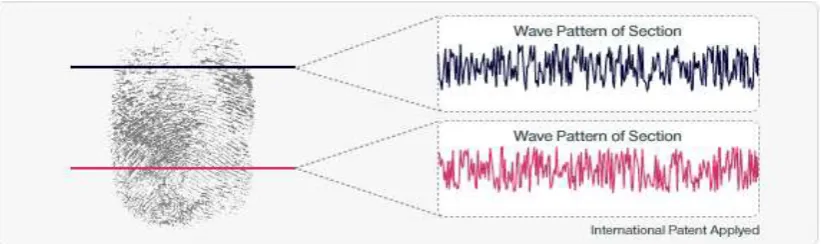
[image:33.595.116.527.484.606.2]Utilizing research from Nagoya Institute of Technology Graduate School in Japan, an algorithm was developed by Digital Development System (DDS) that is based on spectrum analysis, where this technique captures cross sections of a sliced fingerprint pattern and converts them to waves as shown in Figure 2.11. Spectrum analysis uses the wave’s spectral series as feature information to find the maximum correlations in the wave and verifies the identity of the fingerprint.
Figure 2.11: Wave Pattern of Two Different Sections (Sang et al., 2000)
21 In the course of verification under the spectrum analysis algorithm, storing the fingerprint image itself in the system is not needed, which eliminates the possibility of exposure or leakage of fingerprint images. It is impossible to regenerate original fingerprint image from the extracted characteristics of images. As a result, this addresses issues raised by the (Sang et al., 2000) on fingerprint reconstruction of minutia-based systems. The algorithm performs extremely well in controlled environments where positioning of the finger in verification and enrolment are similar. However, with disparate fingerprint positioning for enrolment and verifications results, it can be less than desired or low accuracy. This requirement limits the application developer to be more controlled in its ergonomic environments and may reduce some commercial viability.
2.11 Canny Filter
The edges for an image are always the important characteristics that offer an indication for higher frequency components. Detection of edges for fingerprint image helps in finding the core, ridges and minutia points.
Canny edge detection algorithm is well known as an optimal edge detector in digital image processing. Canny has found that the optimal smoothing function for finding edges of a noisy step edge is approximately a Gaussian (Shriram et al., 2010).
Edges can be defined as the boundaries between different textures. The discontinuities in image intensity from one pixel to another in the entire image are called edge. The edges for an image are always the important characteristics that offer an indication for higher frequency components.
2.12 Features Extraction under Canny Filter
2.12.1 Entropy
The entropy or average information of an image is determined approximately from the histogram of the fingerprint image. A Shannon entropy value is calculated from each sub bands obtained from the second level wavelet packet tree. Entropy is a statistical measure of randomness that can be used to characterize the texture of the input image. Shannon entropy criteria find the information content of signal ‘S’ using the Equation below. The histogram shows the different grey level probabilities in the image. The entropy is useful for image focusing. The wavelet energy signatures reflect the distribution of energy along the frequency axis over scale and orientation and have proven to be very powerful for texture characterization (Selvarajah & Kodituwakku, 2011).
∑ ( ) ( ) (2.6)
where
P ( )is the probability that the difference between 2 adjacent pixels is equal to i, and Log bis the base 2 logarithm.
2.12.2 Energy
The sum of squared elements in the GLCM is given by the Equation below. The range for GLCM is [0 1], energy is 1 for a constant image (Selvarajah & Kodituwakku, 2011).
∑ ∑ ( ) (2.7)
where
i :Image Pixel.
j : Image Pixel.
23 2.12.3 Correlation
It is a measure of how correlated a pixel is to its neighbour over the whole image, in other words, it determines the similarities between two images. The range for GLCM is given by [-1 1]. Correlation is 1 or -1 for a perfectly positively or negatively correlated image. Correlation is NaN (Not-a-Number) for a constant image. It is given by the following Equation (Selvarajah & Kodituwakku, 2011).
∑ ∑ ( )( ) ( ) (2.8)
where
:The Variance of Image. : The Mean of Image.
i :Image Pixel.
j : Image Pixel.
p : Probability Density of Grey Level.
2.12.4 Homogeneity
It is a value that measures the closeness of the distribution of elements in the GLCM to the diagonal as given by the Equation below (Selvarajah & Kodituwakku, 2011). The range for GLCM is [0 1], homogeneity is 1 for a diagonal GLCM.
∑ ∑ ( )
( ( ))
(2.9)
where
i :Image Pixel.
j : Image Pixel.
p : Probability Density of Grey Level. 2.12.5 Contrast
range for GLCM is given by [0, (size (GLCM,1)- 1)^2], contrast is zero for a constant image.
∑ ∑ ( ) ( ) (2.10)
where
i :Image Pixel.
j : Image Pixel.
p : Probability Density of Grey Level.
2.13 Morphological Operator
Morphological operations can be used to distinguish the boundaries of binary object. This operation is important. It is easy to see that the boundary points have at least one background pixel in its neighbourhood. Thus, applying the operator of erosion with a structural element that contains all possible neighbouring elements will remove all the boundary points. After that, the boundary is obtained. The operation of the difference between the sets of the original image and obtained as a result of erosion, thinning is a morphological operation that is used to remove selected foreground pixels from the binary images. In this process, it is used to tidy the wide-spread ridges by reducing all lines to single pixel thickness (Rajeswarl et al., 2012).
2.14 Region of Interest Extraction by Morphological Operation
Two Morphological operations called ‘OPEN’ and ‘CLOSE’ are used in this project. The ‘OPEN’ operation can expand images and remove peaks introduced by background noise whereas; the ‘CLOSE’ operation can shrink images and eliminate small cavities (Latha & Rajaram, 2013).
2.14.1 Fingerprint Ridge Thinning
72
REFERENCES
Anil, K. J., Robert P.W. & Jianchang, M. (2000). Statistical Pattern Recognition: A Review. IEEE Transactions On Pattern Analysis and Machine Intelligence,
22(1), pp. 4 – 37.
Ashok, K. D. & Ummal, T. (2013). Comparative Study on Fingerprint Matching Algorithms for EVM. Journal of Computer Sciences and Applications, 1(4), pp. 55 – 60.
Bana, S. & Kaur, D. (2011). Fingerprint Recognition using Image Segmentation.
International Journal of Advanced Engineering Sciences and Technologies
(IJAEST), 5, pp. 12 – 23.
Ganesh, P. V., Habibullah, K., Bhavana, K., Muralidhar, Ch. & Tulasi, Ch. (2012). Image enhancement using Wavelet transforms and SVD. International Journal of Engineering Science and Technology (IJEST), 4(3), pp. 1080 – 1087.
George, J. P., Abhilash, S. K. & Raja, K. B. (2012). Transform Domain Fingerprint Identification Based on DTCWT. International Journal of Advanced Computer Science and Applications (IJACSA), 3(1), pp. 190 – 195.
Jain, A.K., Ross, A. & Pankanti, S. (1999). A Prototype Hand Geometry-based Verification System. Proc. of 2nd Int'l Conference on Audio- and Video-based Biometric Person Authentication (AVBPA), Washington D.C., pp.166-171.
Jian, D. Z., Yuan, G. & Ming, Z. Z. (2009). Fingerprint Matching Algorithm Based on Similar Vector Triangle. Second International Congress on Image and Signal Processing, pp. 1 – 6.
Jianjiang, F. & Jie, Z. (2011). A Performance Evaluation of Fingerprint Minutia Descriptors. International Conference on Hand-Based Biometrics (ICHB),1, pp. 1 – 6.
Josphineleela. R. & Ramakrishnan. M. (2012). An Efficient Automatic Attendance System Using Fingerprint Reconstruction Technique. (IJCSIS) International Journal of Computer Science and Information Security, 10(3), pp. 1 – 6. Kadhem, M. & Hazeem, B. T. (2010). A New Algorithm for Fingerprint
Recognition. Journal of education of college,1(1), pp. 1 – 8.
Kalle, K. & Anil, K. (1995). Michigan State University, East Lansing, M1 48824, U.S.A. Pattern Recognition, 29(3), pp. 389 – 404.
Kuchen, M. & Newell, C. (2004). A Model for Fingerprint Formation Europhysletters. International Journal of Computer Science and Information Security 68(1), pp. 15 – 24.
Latha, S. S., & Rajaram, M. (2013). Optimization Technique for Fingerprint Recognition and Matching. Life Science Journal, 10, pp. 289 – 296.
Li, S. Z., Anil, J. K. (2009). Encyclopedia of Biometrics. XXXII, 1419 Hardcover ISBN 978-0-387-73002-8, 7, pp. 680 – 695.
Madhuri & Mishra, R. (2012). Fingerprint Recognition using Robust Local Features.
International Journal of Advanced Research in Computer Science and
Software Engineering, 2(6), pp. 1 – 5.
Maltoni, D. & Maio, D. (2009). Handbook of Fingerprint Recognition (Second Edition) Springer-Verlag http://extras.springer.com/2009/978-1-84882-253-5/FVC2000/Dbs.
74 Meenakshi, A., Gaganpreet, K. & Ravi, S. (2012). Minutiae Feature Based Algorithm for Finger Print Recognition and Verification. VSRD International Journal of Electrical, Electronics & Comm. Engg, 2, pp. 279 – 287.
Nandian, C. & Ravi, K. (2011). Improve fingerprint image representation for recognition. MIT International Journal of Computer Science & Information Technology, 1 (2), pp. 59 – 64.
Naresh, A. (2002). Testing from Use Cases, using Path Analysis Technique.
International Conference on Software Testing Analysis & Review, pp.1 – 22. Nasibe, A. & Ali, S, (2012). Automation of Fingerprint Recognition Using OCT
Fingerprint Images. Journal of Signal and Information Processing, 3, pp. 118 – 121.
Okada, K., Steffens, J. & Maurer, T. (1998). Face Recognition. The Bochum/USC Face Recognition System and How it Fared in the FERET Phase III Test. Springer-Verlag. NATO ASI Series, 163, pp. 186 – 205.
Rajeswarl, Allen, M. R., Arjun, A. & Asif, M. S. (2012). A novel enhancement method for low-quality fingerprint images in both spatial and frequency domains. International Journal of Computational Engineering Research, 2(6), pp. 1 – 5.
Ravi. K. L., Sai, S. K., Rajendra, J. P., Subba, B. V. R. & Ravi, P. P. (2012). Fingerprint Minutia Match Using Bifurcation Technique. International Journal of Computer Science & Communication Networks, 2(4), pp. 478 – 486.
Sang K., I., Hyung M., P., Soo W. K., Changkyung, C. & Hwansoo, C. (2000). Improved Vein Pattern Extracting Algorithm and its Implementation. IEEE International Conference on Digest of Technical, pp. 2 – 3.
Sekar, V. (2011). Denoising of Fingerprint Images using Q-shift Complex Wavelet Transform. International Journal of Computer Applications, 15(3), pp. 12 – 17.
Shriram, K., Sivaraman, R. & Karthick, S. (2010). Automotive Image Processing Technique Using Cranny’s Edge Detector. International Journal of Engineering Science and Technology, 2, pp. 32 – 35.
Suvarna, J. & Abhay, K. (2012). Correlation Filter based Fingerprint Verification System. International Conference on VLSI, Communication & Instrumentation (ICVCI) Proceedings published by International Journal of Computer Applications (IJCA), pp. 1 – 5.
Tico, M., Kuosmanen, P. & Saarinen, J. (2001). Wavelet domain features for fingerprint recognition. IEE Electronics Letters, 37(1), pp. 21 – 22.
Verma, R. & Goel, A. (2011). Wavelet Application in Fingerprint Recognition.
International Journal of Soft Computing and Engineering (IJSCE), 1(4), pp. 129 – 133.
Wan, A., Lim, T. & Salasiah, H. (2004). Fingerprint recognition in wavelet domain.
Jurnal Teknologi, 41(D), Universiti Teknologi Malaysia. pp. 25 – 42.
Xuzhou, L., & Fei, Y., (2009). A New Fingerprint Matching Algorithm Based on Minutia. IEEE International Conference on Communications Technology and Applications, pp. 869 – 873.